Potential Crime Areas Analysis Using Integration of Analytical
Hierar-chy Process (AHP) and Geographical Information System (GIS)
Nurul Hazwani Mohd Shamsuddin1*, Nor Azizah Ali2, Razana Alwee3
1,2,3
Department of Computer Science, Faculty of Computing, University Teknologi Malaysia, Malaysia * corresponding author: [email protected]
Abstract
Increasing crime rates in a community can be associated with several factors such as land use, economics ac-tivities, building use and demography. A preliminary survey conducted showed that land use and building use are potential cofactors that contribute to a crime. In this research, we attempt to develop a model to pre-dict crime areas by utilizing these two cofactors. To pursue this endeavor, Analytical Hierarchy Proces (AHP) method and Geographical Information System (GIS) were implemented. AHP is used to produce consistent and realistic weight values of crime factors by calculating the consistency ratio (CR) which can thereafter be used for validation. Though, the GIS is applied to visualize the weights obtained from the AHP results in spatial mapping in order to identify potential crime areas, which were classified as either high, me-dium or low. The data set for this research has been drawn from UGISP Sdn Bhd, which covers the areas of Wilayah Persekutuan Kuala Lumpur (WPKL). From the result, it shows that the potential crime areas are Kuala Lumpur, Bukit Indah, Jinjang and Bandar Tun Razak. As a conclusion, our model would assist the au-thorities (i.e., Dewan Bandaraya Kuala Lumpur, Malaysia) to identify and rank the potential crime areas, and then they can plan a strategy to monitor this matter properly.
Keywords.
Analytical hierarchy process; geographical information system; multi-criteria decision mak-ing; spatial analysis1
Introduction
Monitoring of crimes in Malaysia is necessary to ensure that the statistic of crime rates are still under control [1]. In terms of monitoring, crime analysis is among the chosen approach. The crime analysis is a law enforce-ment function that involves systematic analysis for identifying and analyzing patterns and trends in crime and disorder. Information on patterns can help law enforcement agencies to deploy resources in a more effective manner, and assist detectives in identifying and apprehending suspects [2]. Generally, crime analysis uses both qualitative and quantitative and also analytical methods [3]. Besides that, crime analysis can assist with these efforts by providing research and analysis of disorder indicators such as trespass warnings that can assist police in addressing these issues before they become more serious problems [1].
Multi Criteria Decision Making (MCDM) provides strong decision making in many domains where selection of best alternative is highly complex [4]. Although MCDM have been applied in many domains. Recently, many decisions are being made from various criterias so the decision can be made by providing the weight for each different criterion [5 – 6]. The problem becomes more complex when many criteria are involved for the alterna-tives. Thus, MCDM is one of the approaches that helps in making better decisions in complex problem when involved different criteria to select the best solution among a group of alternatives [7]. According to some re-searches, there are many factors that contribute to crime, but no specific factors are precise in affecting crime [5]. Decision making was used to determine the priority of each multiple factor in crimes by providing the weights [5]. However, in many situations, it is extremely difficult to assign relative weights to the different cri-teria involved in making a decision on potential crime areas in the mapping unit [6]. The study conducted by [8] mentioned that conventional MCDM method obtained the weight for each criterion from experts groups or sur-veys. Nevertheless, the weights provided from them has bias in decision making because there are some difficult decisions where experts are not able to provide the exact numerical values to their preference [8].
the Analytical Hierarchy Process (AHP) that can be used to improve the quality of decision making by reducing the risk of making the wrong decision [9 - 10]. Since the problem is constructed into a hierarchical structure so the importance of each element becomes clear. In addition, AHP incorporates a useful technique for checking the consistency of the decision maker’s evaluations, thus reducing the bias in the decision making process [11]. AHP will estimate the reliability of criteria weight by using consistency ratio (CR). The CR value is important as a guidance to check for validation. If the CR value is less than 0.1, the judgments are consistent, so the de-rived weight can be used [11 – 12]. The old pin maps were useful for showing where the crimes occurred, but unfortunately, it hasserious limitations. During updating, the prior crime patterns were lost [13]. Consequently, Geographical Information System (GIS) and data mapping applications for crime mapping has become a neces-sary tool in law enforcement agencies worldwide, probably one of the most valuable tools available [14]. Meanwhile, crime analysis requires handling both spatial and attribute data in many data layers. Therefore, it is appropriate to use GIS to exploit its strong capability in handling spatial data [15]. Using map can also help to manage, analyse and present the geographic location data [14]. Moreover, an integration of GIS and AHP method for potential crime areas analysis is expected to produce promising results.
Hence, this paper presents the results ofintegration between AHP and GIS in analyzing the potential crime areas conducted using the data collected for WPKL area. The organizations of this paper are as follows. Meth-odology of the study is discussed in Section 2. In Section 3, the results and the analysis process were thouroghly discussed. The discussions and conclusions were written in Section 4 and 5 respectively.
2
Methodology
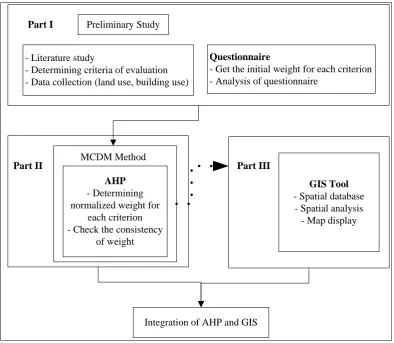
This section discussed the research methodology and conceptual framework that have been applied in this study. The general conceptual framework for potential crime area analysis is shown in Figure 1.
Preliminary Study Part I
- Literature study
- Determining criteria of evaluation - Data collection (land use, building use)
Questionnaire
- Get the initial weight for each criterion - Analysis of questionnaire
Part II
AHP - Determining normalized weight for
each criterion - Check the consistency
of weight MCDM Method
Part III
GIS Tool - Spatial database
- Spatial analysis - Map display
Integration of AHP and GIS
2.1
Research Scope and Area
The data set for this study has been drawn from UGISP Sdn Bhd, which covers the areas of Wilayah Perseku-tuan Kuala Lumpur (WPKL). Kuala Lumpur is the one of the most developing centre in Malaysia. Figure 2
shows the location of study area.
Figure 2. Study of Area
2.2
Research Data and Sampling
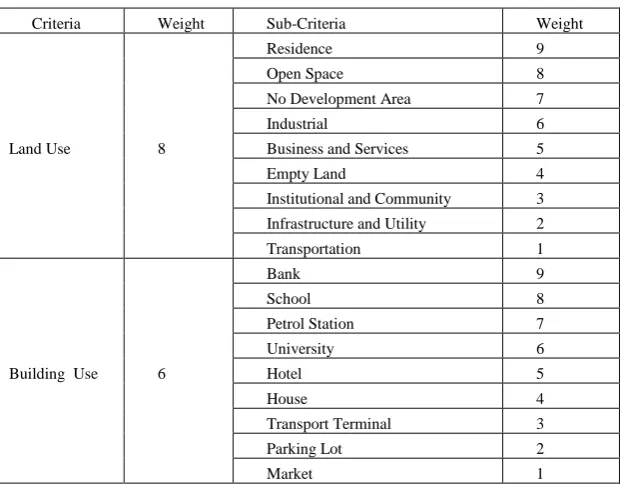
Due to data limitation, this study focus on building use and land use data set as the main criteria. The study by [16] stated that questionnaire forms have been used as instrument to gather primer data from the respondents. In order to determine the weight of each criterion, 100 sets of questionnaire were distributed to police and the ex-perts from the related fields regarding the crime analysis. The results of questionnaires were shown as numerical values to present the ranking of potential crimes.The weight obtained from the questionnaire as shown in Table 1.
Table 1. Weight of Criteria and Sub Criteria
Criteria Weight Sub-Criteria Weight
Land Use 8
Residence 9
Open Space 8
No Development Area 7
Industrial 6
Business and Services 5
Empty Land 4
Institutional and Community 3
Infrastructure and Utility 2
Transportation 1
Building Use 6
Bank 9
School 8
Petrol Station 7
University 6
Hotel 5
House 4
Transport Terminal 3
Parking Lot 2
2.3
Analytical Hierarchy Process (AHP)
AHP has been applied for many years. Itwas introduced and developed by Saaty (1980). In the AHP method, obtaining the priority vector and weights for each criterion are required.The procedures involve few essential steps [17 - 18].
A. Define the unstructured problem. The goal of this study is to identify the potential crime areas in WPKL. The criteria used are land and building use.
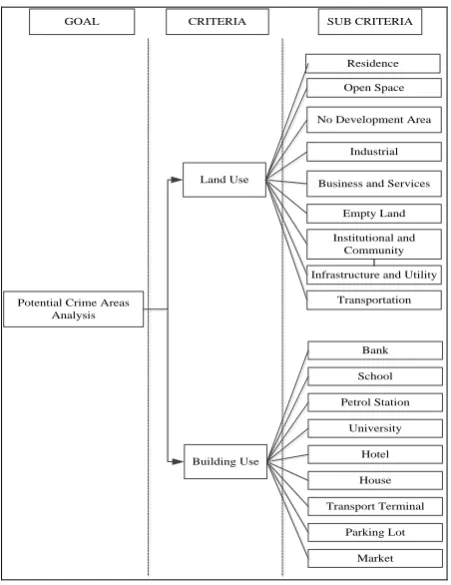
B. Developing the AHP Hierarchy. The principle utilized in AHP for problem solving is to construct hierarchy. The hierarchy allows assessment of the contribution criterion, starting from the lower levels to the higher levels of the hierarchy [19]. It begins by decomposing the overall goal into a number of criteria and criteria. The goal is presented at the top level of the hierarchy. Major criteria comprise level two, while sub-criteria in level three [20, 21]. By applying this step in potential crime areas analysis, the decision sub-criteria relevant to our goal can be identified. Figure 3 shows the potential crime areas hierarchy.
Potential Crime Areas Analysis
Land Use
Residence
Open Space
No Development Area
Industrial
Business and Services
Empty Land
Institutional and Community
Infrastructure and Utility
Transportation
Building Use
Bank
School
Petrol Station
University
Hotel
House
Transport Terminal
Parking Lot
Market
GOAL CRITERIA SUB CRITERIA
Figure 3. Potential Crime Areas Analysis Hierarchy
C. Criteria of Weighting. Criteria scores were determined according to the scale that represents score value of 9 to 1. The bigger thescore value, the higher the rank of the criteria [19]. The importance of each criterion relative to other criteria is shown by criteria weighting. Table 2 shows the scale of relative importance according to Saaty (1980) [17].
Table 2. Scale of Relative Importance
Intensity of importance Definition
1 Equal importance
3 Somewhat more important
5 Much more important
7 Very much important
9 Absolute important
D. Pair-wise Comparison Method. AHP requires evaluation of the pair-wise comparison matrices using measurement theory [20]. For each level in the hierarchy it is necessary to know whether the pair-wise comparison has been consistent in order to accept the results of the weighting [18].Typically, the value of weight will be normalized where the sum of weight of each criterion is equal to 1. If it has ‘n’ criteria such as C1, C2, ..., Cn with the weight W1, W2, ..., Wn, the equation used according tothe following formula [19].
11
i
Wi
(1)
E. Consistency Analysis. Consistency Ratio (CR) has been used to measure on how consistent the judgment relative to large samples of purely random judgments. If the CR is exceed 0.1, the judgments are untrustworthy because they are too close to randomness and the exercise is valueless or must be repeated [21]. The measure of consistency, called Consistency Index (CI) byusing the following formula.
1
max
n
CI
(2)
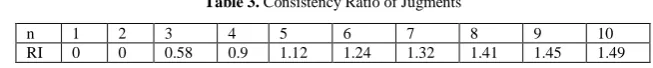
Table 3 shows the average random consistency index (RI) of sample size 500 matrices [21].
Table 3. Consistency Ratio of Jugments
n 1 2 3 4 5 6 7 8 9 10
RI 0 0 0.58 0.9 1.12 1.24 1.32 1.41 1.45 1.49
The measure of consistency, called Consistency Ratio (CR) using the following formula.
RI
CI
CR
(3)
2.4 Geographical Information System
GIS provide a new alternative approach to the conventional statistical methods [22]. A main advantage of GIS is that it can be visualize the spatial patterns of crimes in mapping. Moreover, anotherfunction of GIS is to alsovisualize the relations between crime and its correlates and the differentiation of crime type and its related attributes [23]. ArcGIS Desktop provides a set of analytical and data maintain capabilities for the trained GIS professional. It is also deployed to perform data very well when working with sources of data and services such as Enterprise Geodatabase, ArcGIS Image Server and ArcGIS Map Services [22 - 23]. The main analysis task are used ArcGIS Spatial Analysis to create the mapping for identifying the potential crime areas in WPKL. The mapping was reclassified into three categories: high, medium and low potential.
2.5
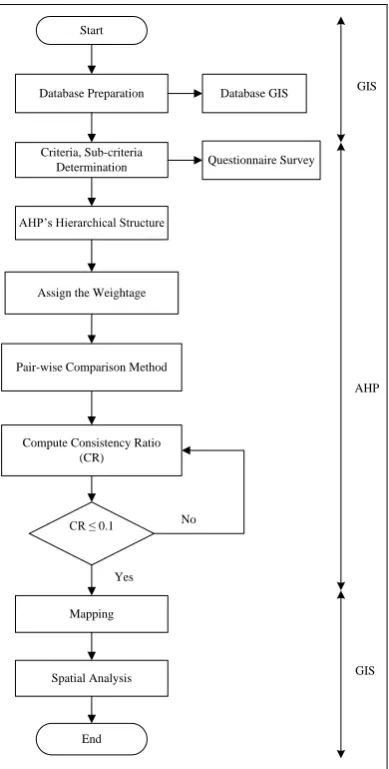
Integration of AHP and GIS
Start
Database Preparation
Criteria, Sub-criteria Determination
AHP’s Hierarchical Structure
Assign the Weightage
Pair-wise Comparison Method
Compute Consistency Ratio (CR)
CR ≤ 0.1
Mapping
Spatial Analysis
End
No
Yes
Database GIS
Questionnaire Survey GIS
AHP
GIS
Figure 4. Flowchart of Integration AHP and GIS
3
Results and Analysis
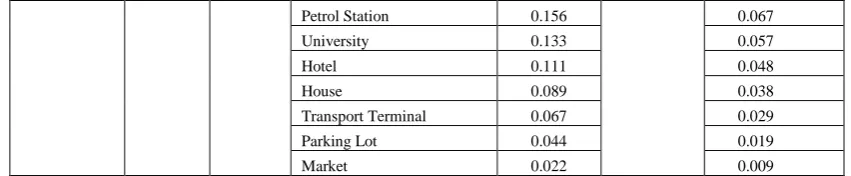
To define the potential crime areas in spatial mapping, we used the following criteria and sub criteria in Ta-ble 4. As stated previously, weightage for each criterion obtained from the analysis of questionnaire has been used to get the normalized weight using AHP. The matrix algebra (Eigenvector) was used to turn the matrix into ranking of normalized weightage. The final process to get ranking priorities from a pairwise matrix using AHP is as shown in Table 4.
Table 4. Criteria of Weighting in AHP
Level 1 Level 2 Overall Weight
Criteria W1 CR1 Sub-Criteria W2 CR2 (Wi = W1 x W2)
Land Use 0.571 CR = 0
(≤ 0.1)
Residence 0.200
CR = 0.095 (≤ 0.1)
0.114
Open Space 0.178 0.102
No Development Area 0.156 0.089
Industrial 0.133 0.076
Business and Services 0.111 0.063
Empty Land 0.089 0.051
Institutional and Community 0.067 0.038
Infrastructure and Utility 0.044 0.025
Transportation 0.022 0.013
Building Use 0.429 Bank 0.200 CR = 0.095
(≤ 0.1)
0.086
Petrol Station 0.156 0.067
University 0.133 0.057
Hotel 0.111 0.048
House 0.089 0.038
Transport Terminal 0.067 0.029
Parking Lot 0.044 0.019
Market 0.022 0.009
Table 4, shows that ‘Land Use’ is the most important criteria with a value of 0.571 and ‘Building Use’ is the least important criteria with a value of 0.429. Moreover, residence and bank are the most important sub-criteria with a value of 0.200 while transportation and market are least important sub-criteria with a value of 0.022. As we can seen from the results, the judgment of normalized weight for each criterion are reliable and consistent because the value obtained are acceptable in validation. As a result, the potential crime areas were mapped as shown in Figure 5. Using raster suitability analysis in GIS, intersection of both data; land use and building use will produced the new layers. The resulting layers have all of the attributes of the original layers by using over-lay concept. In addition, the potential crime areas were classified as high potential (red colour), medium poten-tial (orange colour) and low potenpoten-tial (yellow colour). By overlaying the criteria maps, we concluded that Kuala Lumpur, Bukit Indah, Jinjang and Bandar Tun Razak are categorised as the most potential crime areas.
4
Discussion
In the proposed model, AHP used to calculate the weights of the criteria, and GIS functionality was used to extract the suitability map with the weights calculated. As a result of the study, we find that the proposed model is practical inidentifying potential crime areas with respect to multiple criteria. The finding is extremely perti-nent for law enforcement to control the potential crime areas for public safety. We have evaluated the integra-tion of AHP and GIS which has not previously been used for this purpose. Furthermore, we hypothesized that AHP can deals with the complex problems which involved multiple criteria simultaneously compared with Weighted Sum Model (WSM) method [24]. By reducing complex decisions to a series of pairwise comparisons and then synthesizing the results, AHP helps to capture both objective and subjective aspects of a decision. In addition, AHP incorporates a useful technique for checking the consistency of the decision maker’s evaluations, thus reducing the bias in the decision making process compared with methods like TOPSIS and ELECTRE, the consistency is not controlled [25].What’s new in this paper is application of domain in finding out the potential crime areas in spatial mapping based on land and building use factors and a new model in raster suitability anal-ysis using GIS. However, the result isincreasingly flexible if more types of data used. It is anticipated that the current paper will help the decision maker with ability to look in to the future and make the best possible deci-sion. However, the limitation of this study, when the number of the levels in the hierarchy increase, the number of pair comparisons also increase, so that to build the AHP model takes much more time [20]. Due to data limition currently, it is difficult to provide aflexible and consistent analysis. In future research, it is recommend that adding more existing data and using defuzzization methods such as enhance current AHP with Fuzzy meth-od.
5
Conclusion
This paper proposed integration between AHP and GIS to identify the potential crime areas based on the data collected. AHP method, which is commonly used in multi-criteria decision-making exercises, was found to be a useful method to determine the weights. Compared with other methods (i.e., conventional MCDM and weighted sum used for determining weights), the AHP method is superior because it can deal with inconsistent judge-ments and provides a measure of the inconsistency of the judgement of the respondents. Moreover, GIS was found to be a technique that provides greater flexibility and accuracy for handling digital spatial data. Thus, the combination of AHP method with GIS in our experiment proves that it is useful to be applied in potential crime areas analysis.
Acknowledgments. This material is based upon work supported by Research Universiti Grant (RUG) under
Vote No. Q.J130000.2628.10J03 and University Teknologi Malaysia (UTM). Any opinions, findings and con-clusions or recommendation expressed in this material are those from the authors and do not necessarily reflect the views of the UTM.
References
1.Amin, B.M., Rahim, M.K. and Geshina, A.M.S. “A Trend Analysis of Violent Crimes in Malaysia,” Health and the Environment Journal, vol. 5, no. 2, pp. 41-56, 2014.
2.Buonanno, P. and Montolio, D. “Identifying the socio-economic and demographic determinants of crime across Spanish provinces,” International Review of Law and Economics, vol. 28, pp. 89-97, 2008.
3.Chandra, B, and Gupta, M. “A Multivariate Time Series Clustering Approach for Crime Trends Prediction,” IEEE International Conference Systems, Man and Cybernatics, pp. 892-896, 2008.
4.Chen, P., Chen, T. and Yuan, H. “GIS based Crime Risk Analysis and Management in Cities,” IEEE Interna-tional Conference Information Science and Engineering, pp. 3721-3724, 2010.
5.Aruldoss, M., Lakshmi, M. and Venkatesan, V.P. “A Survey on Multi Criteria Decision Making Methods and Its Application,” American Journal of Information Systems, vol. 1, no. 1, pp. 32-34, 2013.
6.Velasquez, M. and Hester, P.T. “An Analysis of Multi Criteria Decision Making Methods,” International Journal of Operations Research, vol. 10, no. 2, pp. 56-66, 2013
8.Evangelos, T. and Stuart, H.M. “Using The Analytic Hierarchy Process for Decision Making in Engineering Applications: Some Challenges,” International Journal of Industrial Engineering: Applications and Practice, vol. 2, no. 1, pp. 35-44, 1995.
9.Thomas, L.S “Decision making with the analytic hierarchy process,” International Journal Services Sciences, vol. 1, no. 1, pp. 83-98, 2008.
10.Alessio, I. and Asharaf, L. “Review of the main developments in the Analytic Hierarchy Process,” Interna-tional Journal Expert Systems with Applications, vol. 38, no. 11, pp. 14336-14345, 2011.
11.Martin, J.B., Kumaran, T.V. and Joseph, R. “Using Geographic Information Systems (GIS) for Spatial Plan-ning and Environmental Management in India: Critical Considerations,” International Journal of Applied Science and Technology, vol. 2, no. 2, pp. 40-54, 2012.
12.Mennecke, B.E. “Geographic information systems: applications and research opportunities for information systems researchers,” IEEE International Conference on System Sciences, vol. 3, pp. 537-546, 1996.
13.Rui-sheng, J. “Research on distributed GIS process modeling and integration,” IEEE International Symposi-um on IT in Medicine and Education, pp. 33-38, 2008.
14.Ai-Liang, X. “Geographic Information Sytstem Application in Ecotourism,” IEEE International Conference on Business Computing and Global Informatization, pp. 454-457, 2012.
15.Xiu-mei, L. “Research on the Technology of Geographical Information System Data Reconstruction,” IEEE WRI World Congress on Computer Science and Information Engineering, vol. 4, pp. 10-13, 2009.
16.Mohit, M.A. and Elsawahli, H.M.H. “A Study of Crime Potentials in Taman Melati Terrace Housing in Kua-la Lumpur: Issues and Challenges,” Asian Journal of Environment-Behaviour Studies, vol. 42, pp. 271-283, 2012.
17.Chakraborty, T., Ghosh, T. and Dan, P.K. “Application of Analytical Hierarchy Process and Heuristic Algo-rithm in Solving Vendor Selection Problem,” International Journal Business Intelligence, vol. 4, no. 1, pp. 167-177, 2010.
18.Bunruankaew, K. and Murayam, Y. “Suitability Evaluation for Ecotourism Using GIS & AHP: A Case Study of Surat Thani Province, Thailand,” International Conference on Spatial Thinking and Geographic Infor-mation Sciences, vol. 21, pp. 269-278, 2011.
19.Galleti, S.C. “The Multilevel Analytic Process for Situational Prevention (Maps): Implementing A New Methodology for Security and Crime Prevention,” International Sysmposium on the Analytic Hierarchy Pro-cess, pp. 1-6, 2011.
20.Xiaoguo, J.“Integration of Interval Numbers and the Method of AHP Along with its Improvement and Appli-cation,” International Conference on Information Management, Innovation Management and Industrial Engi-neering, vol 1, pp. 421-424, 2010.
21.Liu, J.P., Zhou, N. and Wang, Y. “The Experimental Research on the Method of Integrating AHP with GIS,” IEEE International Sysposium Computer Science and Computational Technology, pp. 698-702, 2008. 22.Samad, A.M., Hifni, N.A., Ghazali, R., Hashim, K.A., Disa N.M., and Mahmud, S. “A study on school
loca-tion suitability using AHP in GIS approach,” IEEE Internaloca-tional Colloqium Signal Processing and Its Appli-cation, pp. 393-399, 2012.
23.Coutinho-Rodrigues, J., Simão, A. and Antunes, C.H. “A GIS-based multicriteria spatial decision support system planning urban infrastructures,” Decision Support System, vol. 51, issue 3, pp. 720-726, 2011. 24.Yanhui, W., Chenchen, Z., Lingxi, Z. and Qian, S. “Application of improved AHP in the evaluation of
rail-way emergency plans,” International Conference on Networking, Sensing and Control, pp. 564-569, 2010. 25.Zhou, Z., Yanyu, W. and Zhengxin, W. “A grey TOPSIS based on weighted relational coefficient,” IEEE