Efficiency Evaluation Of A Few Organic Solar Cells
By Data Envelopment Analysis
Gitalee Sharma and Mithun J Sharma
Abstract: The measurement of Power Conversion Efficiency (PCE) of Organic Solar Cells (OSC) noted in literature till date is absolute and not relative. As in absolute measure, comparative ranking cannot be made by referring to a benchmark, scope for improvement is on lack. However, relative measurement compares the absolute values, thereby providing scope for benchmarking, referencing and improvement projections. This paper proposes the application of Data Envelopment Analysis (DEA), a non parametric operation research approach for relative efficiency measurement of OSCs (DMUs). The DEA model used reveal that out of the 25 OSCs studied here, one OSC (i.e. DMU Y[28]), is found to be efficient and all other DMUs are inefficient relatively taking Y[28] as benchmark. The result of input/output oriented DEA method used to measure the relative efficiency of OSCs prescribes to hold input/output constant and to determine how much of an improvement in the output/input dimensions of inefficient OSCs is necessary in order to reach the frontier.
Index Terms: Organic solar cells, Power conversion efficiency, Data envelopment analysis, Band gap
—————————— ——————————
1.
INTRODUCTION
THE growing demand for electricity has gained attention in photovoltaics as it is readily and freely available, environment friendly and has low maintenance property [1]. However, the photovoltaics dominated by inorganic materials because of their high conversion efficiency (highest PCE of 44.7% in lab), has its limitations of high energy consumption at fabrication and cost intensiveness [2]. In this view, organic solar cells (OSC) have attracted much attention because of their low-cost fabrication techniques, light weight, flexibility, solution processability and environment friendliness [3]. A review of the literature on organic solar cells reveal that a wide range of organic solar cell devices has been fabricated with a variety of PCE till date (highest PCE of 8.4% in lab)[4]. These variety of PCE have their absolute measure which is not relative. Relativity is required to see which input works better, easier to use or has improvement scope. Since, determination of PCE of OSC in isolation provide an absolute value, scope for improvement is limited. Therefore, the concept of relativity is vital for benchmarking, referencing and methodological improvement. However, not any technique has been incorporated to compare the relative efficiency of the organicsolar cell devices known in literature based on their input and output parameters. Thus, in this paper we propose to apply data envelopment analysis (DEA), a non-parametric operation research (OR) approach for efficiency measurement of organic solar cells. DEA is the optimization method of mathematical programming to generalize the single-input/ single-output technical efficiency measure to the multiple-input/ multiple-output case by constructing a relative efficiency score as the ratio of a single virtual output to a single virtual input [5].
In this paper, we have compared the relative efficiency of nine organic solar cell devices fabricated with different π-conjugated molecules (as active layer) with a few samples collected from literature. The active layers of the OSC devices were synthesized by a novel procedure [6]. The photovoltaic devices were fabricated and their current–voltage (I-V) characteristics studied [6]. The data was collected from the published record and analyzed by subsuming a linear programming mathematical technique, DEA.
2
METHODOLOGY
2.1 Device Fabrication
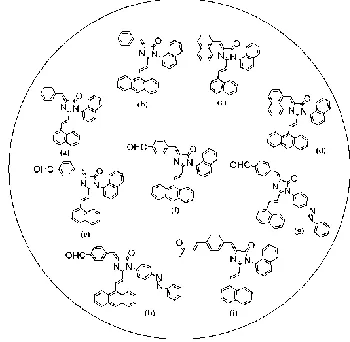
Nine OSC devices were fabricated with different highly conjugated imidazolinone molecules as active layers (Fig. 1).
Fig. 1 The molecules used as active layers in the fabricated OSC devices
The organic molecules used for the devices were synthesized by a novel procedure which we have already published [6]. The photovoltaic devices were fabricated using the formula: ITO (130nm) || WPTA (90nm) || PEDOT:PSS (60nm) || Organic layer (100nm) || Al (100nm). The current–voltage (I–V)
_________________________
Gitalee Sharma is currently an Assistant Professor in the Department of Engineering Chemistry, DUIET, ,Dibrugarh University, Assam, India, E-mail: [email protected] Mithun J Sharma is currently an Assistant Director (Academics),
characteristics of the photovoltaic solar cell were measured using a Keithley model 2420 source meter under day sunlight of 100mW/cm2 illumination. The solar illumination was measured by using a lux meter. In this study, the film thickness of the W-PTA and PEDOT:PSS layer was controlled by varying the weight percent of their solutions during the spin-coating process while all other experimental conditions, such as rpm (3000rpm) for 30s and annealing temperature (115 0C), were fixed. The spin coating rpm of the organic layer was maintained at 1000 rpm for 60s [6].
The Current-voltage (I-V) characteristics of the OSC devices fabricated with the synthesized molecules as active layers were studied and published [6].
2.2 Model for DEA (CRS Model)
DEA is a multi-factor productivity analysis model for measuring the relative efficiencies of a homogenous set of decision making units (DMUs) [7]. DEA models are classified with respect to the type of envelopment surface, the efficiency measurement and the orientation (input or output). There are two basic types of envelopment surfaces in DEA known as constant returns-to-scale (CRS) and variable returns-to-scale (VRS) surfaces [8]. Each model makes implicit assumptions concerning returns-to-scale associated with each type of surface. Charnes, Cooper and Rhodes introduced the CCR or CRS model that assumes that the increase of outputs is proportional to the increase of inputs at any scale of operation [9]. DEA models are also classified as radial input oriented, radial output oriented or additive (both inputs and outputs are optimized) based on the direction of projection of the inefficient unit into the frontier [10]. We here utilize only the radial output oriented models in our study of organic solar cells. Charles, Cooper and Rhodes (CCR) model allows representing multiple inputs and outputs of each DMU and can be represented as a ratio of the abstract input to abstract output, and the resulting efficiency value can then be used for comparison with other DMU in the set [9]. Mathematically, in all variations of the DEA models [11] the DMUs with the best inherent efficiency in converting inputs X1, X2,…..Xninto outputs Y1, Y2,…..Ymis identified, and then all other DMUs are ranked relatively to the most efficient DMU.
Consider a set of n observations on the DMUs. Each
observation,
DMU
j(
j
1, ...., )
n
, uses m inputs( 1, 2, ...., )
ij
x i m to produce s outputs yrj(r1, 2, ...., s). The (empirical) efficient frontier or best practice frontier is determined by these n observations [12]. Table 1 and Table 2 summarizes the envelopment models with respect to the orientations and frontier types [12].
Table 1. Envelopment model (input oriented) [12]
Frontier type
Input –Oriented
CRS 1 1
min
(
)
m s
i r
i r
s
s
1
1
1, 2,..., ;
1, 2,..., s;
0 1, 2,..., n .
n
j y i io
j n
j rj r ro
j
j
subject to
x s x i m
y s y r
j
Efficient
Target * *
*
ˆ 1, 2,...., m
ˆ 1, 2,....,s
io io i
ro ro r
x x s i
y y s r
Table 2. Envelopment model (output oriented) [12]
Frontier type
Output- Oriented
CRS
1 1
1 1
max ( )
1, 2,..., ;
1, 2,..., s;
0 1, 2,..., n .
m s
i r
i r
n
j ij i io j
n
j rj r ro j
j
s s
subject to
x s x i m
y s y r
j
Efficient Target
*
* *
ˆ
1,2,...., m
ˆ
1,2,....,s
io io i
ro ro r
x
x
s
i
y
y
s
r
The interpretation of the envelopment model results can be summarized as
i) If * *
1or 1,
then the DMU under evaluation is a frontier point. i.e., there is no other DMUs that are operating more efficiently than this DMU. Otherwise, if * *
1or 1
, then the DMU under evaluation is inefficient. i.e., this DMU can either increase its output levels or decrease its input levels.
ii) The left-hand-side of the envelopment models is usually called the ―Reference Set‖, and the right-hand-side represents a specific DMU under evaluation. The non-zero optimal *
j
represents the benchmarks for a specific DMU under evaluation. The Reference Set provides coefficients(
*j)
to define the hypothetical efficient DMU. The Reference Set or the efficient target shows how inputs can be decreased and outputs increased to make the DMU under evaluation efficient. iii) The last row presents the efficient target (DEA projection) of a specific DMU under evaluation [12].output (maximum electrical power and power conversion efficiency). The model solution result indicates if a particular solar cell is efficient or inefficient relatively. Based on a comprehensive literature review, the input and output data of the organic molecules synthesized for fabricating solar cells were collected. These input and output data were processed using the DEA linear programming.
3. RESULTS AND DISCUSSION
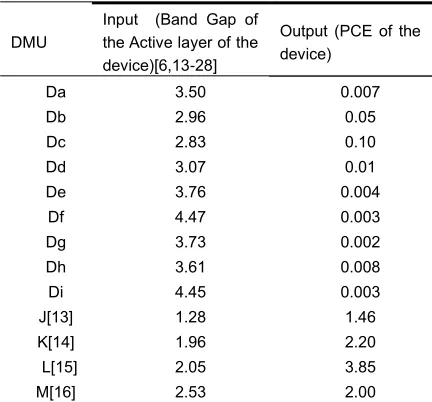
The DEA analysis was performed with the nine devices fabricated with the synthesized imidazolinone molecules[6] and eleven other samples reported in literature[13-28]. The analysis was executed in the DEA software using both CCR-I and CCR-O models (where I and O stands for input and output respectively). The single input and single output case is used for the DEA analysis of the samples. The band gap of the active layer is considered as the input and the power conversion efficiency of the OSC device is the accounted output parameter. This criteria is detailed in the Table 3. In Table 3, 25 different OSC devices were considered as DMUs (Decision Making Units), as these are the units whose relative comparison is to be made using the CCR DEA model. The DMUs from Da to Di were those fabricated and published by us and the DMUs from J[13] to Y[28] are the few selected from literature [13-28]. The results of the analysis using the CCR-I model and CCR-O model revealed that DMU Y[28] is the most efficient OSC, having an efficiency rate of 1. The other DMUs are found to be inefficient relatively. The performance target for inefficient DMUs can be enabled to reach 100% relative efficiency in comparison with DMU Y[28], the most efficient. DMU Y[28] has operated in an environment similar to the others and hence using its performance as a benchmark is realistic. The DMU efficiency rate using the CCR-I model and CCR-O model are briefed in Table 4 and Table 5 respectively. Input Output parameters for the DEA comparative analysis are shown in Table 3 below. The DEA analysis on the DMUs outlined in Table 3 can be explained by taking a sample DMU, say X[27]. The same logic is applicable to the other inefficient DMUs. X[27] is ranked 5th in the input as well as output oriented CCR model with an efficiency rate of 0.62329, which is considered inefficient relatively with respect to the most efficient DMU Y[28], the reference set.
Table 3. List of DMUs with Inputs and Outputs
DMU
Input (Band Gap of the Active layer of the device)[6,13-28]
Output (PCE of the device)
Da 3.50 0.007
Db 2.96 0.05
Dc 2.83 0.10
Dd 3.07 0.01
De 3.76 0.004
Df 4.47 0.003
Dg 3.73 0.002
Dh 3.61 0.008
Di 4.45 0.003
J[13] 1.28 1.46
K[14] 1.96 2.20
L[15] 2.05 3.85
M[16] 2.53 2.00
N[17] 1.95 1.70
O[18] 1.75 2.02
P[19] 2.11 1.14
Q[20] 1.16 1.94
R[21] 2.17 7.99
S[22] 1.82 6.56
T[23] 1.90 2.50
U[24] 2.33 2.99
V[25] 1.86 3.07
W[26] 2.02 5.71
X[27] 1.66 4.00
Y[28] 1.94 7.50
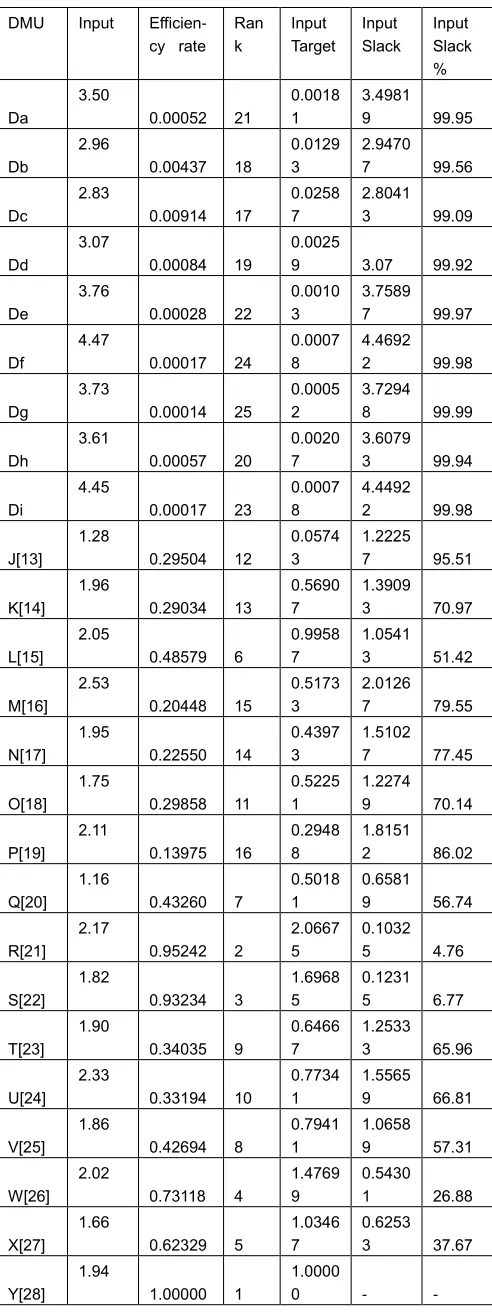
TABLE 4. DMU Efficiency Rate: Input oriented CCR Model
Similarly, in case of CCR-O model, if a particular inefficient
DMU is to reach the efficient frontier, it should increase its output to a certain extent, at par with the reference set, keeping the input constant. Taking the same sample i.e. DMU
TABLE 5. DMU Efficiency Rate: Output oriented CCR Model
X[27], the output oriented DEA analysis can be explained. In this model, the output target, output slack and output slack percentage are computed. For inefficient DMUs, output target will be greater than the actual output. The difference between actual output and output target is the output slack. The output target for X[27] is 6.41753, output slack is 2.41753 and output slack percentage is 60.44% (Table 5). This implies that for X[27] to reach the same efficient frontier as Y[28], it should increase its power conversion efficiency (output) by 2.41753 or 60.44% for the same level of input. The DEA model determines how a particular DMU should change its behaviour to become efficient and rise to the efficiency curve. This is depicted graphically in fig. 2 for input-oriented and output-oriented CCR model. The CCR-I model suggests that for an inefficient DMU to become efficient, it must lower its inputs, DMU Input
Efficien-cy rate Ran k Input Target Input Slack Input Slack % Da 3.50
0.00052 21
0.0018 1
3.4981 9 99.95
Db
2.96
0.00437 18
0.0129 3
2.9470 7 99.56
Dc
2.83
0.00914 17
0.0258 7
2.8041 3 99.09
Dd
3.07
0.00084 19
0.0025
9 3.07 99.92
De
3.76
0.00028 22
0.0010 3
3.7589 7 99.97
Df
4.47
0.00017 24
0.0007 8
4.4692 2 99.98
Dg
3.73
0.00014 25
0.0005 2
3.7294 8 99.99
Dh
3.61
0.00057 20
0.0020 7
3.6079 3 99.94
Di
4.45
0.00017 23
0.0007 8
4.4492 2 99.98
J[13]
1.28
0.29504 12
0.0574 3
1.2225 7 95.51
K[14] 1.96
0.29034 13
0.5690 7
1.3909 3 70.97
L[15] 2.05
0.48579 6
0.9958 7
1.0541 3 51.42
M[16] 2.53
0.20448 15
0.5173 3
2.0126 7 79.55
N[17] 1.95
0.22550 14
0.4397 3
1.5102 7 77.45
O[18] 1.75
0.29858 11
0.5225 1
1.2274 9 70.14
P[19] 2.11
0.13975 16
0.2948 8
1.8151 2 86.02
Q[20] 1.16
0.43260 7
0.5018 1
0.6581 9 56.74
R[21] 2.17
0.95242 2
2.0667 5
0.1032
5 4.76
S[22] 1.82
0.93234 3
1.6968 5
0.1231
5 6.77
T[23] 1.90
0.34035 9
0.6466 7
1.2533 3 65.96
U[24] 2.33
0.33194 10
0.7734 1
1.5565 9 66.81
V[25] 1.86
0.42694 8
0.7941 1
1.0658 9 57.31
W[26] 2.02
0.73118 4
1.4769 9
0.5430 1 26.88
X[27] 1.66
0.62329 5
1.0346 7
0.6253 3 37.67
Y[28] 1.94
1.00000 1
1.0000
0 - -
DMU Output Efficien-cy rate
Ran k Output Target Output Slack Output Slack %
Da 0.007 0.00052 21 13.530 9
13.523 9
193198. 97
Db 0.05 0.00437 18 11.443 3
11.393 3
22786.6 0
Dc 0.1 0.00914 17 10.940 7
10.840 7
10840.7 2
Dd 0.01 0.00084 19 11.868 5
11.858 6
118585. 57
De 0.004 0.00028 22 14.536 0
14.532 1
363302. 06
Df 0.003 0.00017 24 17.280 9
17.277 9
575930. 93
Dg 0.002 0.00014 25 14.420 1
14.418 1
720905. 15
Dh 0.008 0.00057 20 13.956 1
13.948 2
174352. 32
Di 0.003 0.00017 23 17.203 6
17.200 6
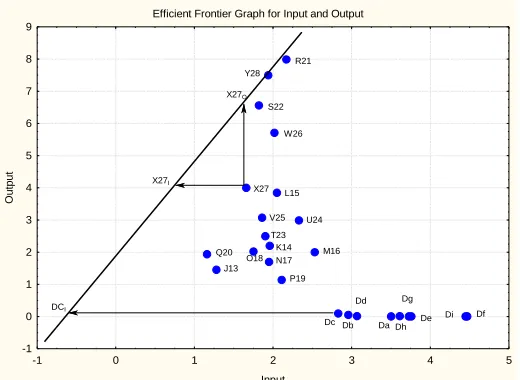
keeping the output constant. In our case, DMU X[27] will be efficient if it lower the level of its band gap (input) by 0.62533 to point X27I on the efficiency curve (Fig 2).
Efficient Frontier Graph for Input and Output
-1 0 1 2 3 4 5
Input -1
0 1 2 3 4 5 6 7 8 9
Ou
tp
u
t
Y28 R21
Dc De Di Df Dg
Dh Da Dd
Db J13
Q20
P19 N17 O18
K14 T23
M16 U24 V25
L15 X27
W26 S22 X27O
X27I
DCI
Fig. 2 The Efficient Frontier Graph for Input and Output. Again, taking a sample from our fabricated devices, DMU Dc, is found to have better performance relatively. Its input target is 0.02587, input slack 2.80413 and input slack percentage is 99.09%. Thus, referring to fig 2, it can be inferred that DMU Dc will be efficient if it lower the level of its band gap (input) by 2.80413 to point DCI on the efficiency curve. The CCR-O model suggests that in order to attain efficiency, the inefficient DMUs must increase their outputs keeping the inputs constant. In case of DMU X[27], it would therefore be necessary for it to raise the level of its power conversion efficiency (output) by 2.41753, to reach point X27O on the efficiency curve (Fig 2).
4. CONCLUSION
Although there has been a substantial body of efficiency measurement of organic solar cells research, the idea of using relative measurement instead of absolute measure in particular using DEA has not gained any attention till date. As
absolute measurement cannot provide any benchmarks or improvement projections, there is a need for relative measurement to compare the absolute values for benchmarking, referencing and making improvements. This paper has applied DEA, a non-parametric operation research approach for relative efficiency measurement of OSCs. The CCR-I and CCR-O model was used for the measurement and the single input and single out case was considered. The analysis revealed that out of the 25 OSCs, one OSC i.e. DMU Y[28] was found to be efficient. From the result of the DEA analysis it was found that all other DMUs were inefficient and their improvement scope was determined relative to the DMU OSC-Y[28]. In order to explain how to achieve the performance target for the inefficient DMUs, a prototype of all inefficient DMUs, X[27] was considered. The DEA analysis shows that the efficiency of X[27] projects into observable portion of the efficient frontier of Y[28], only when it produces the same output using a less percentage of input. Furthermore, it should also increase its power conversion efficiency (output) by the same level of input. Thus, it can be concluded that efficiency up gradation is possible only if the
value of the actual input is lowered by the input slack in the CCR-I model and the value of the actual output is increased by the output slack in the CCR-O model. This paper contributes to the projection of a noble approach towards scientific research in chemical field using operational research methodology, thereby providing a new viewpoint to interdisciplinary research. As a perspective, the multi-input-output DEA methodology can be used to give new standpoint to the relative measurement of efficiencies of organic solar cells.
ACKNOWLEDGMENT
The authors would like to acknowledge Department of Science and Technology (DST) India for financial support.
REFERENCES
[1] Kumavata P P, Sonarb P, Dalala D S (2017) An overview on basics of organic and dye sensitized solar cells, their mechanism and recent improvements. Renewable and Sustainable Energy Reviews78: 1262– 1287https://doi.org/10.1016/j.rser.2017.05.011
[2] Regan B.O, Gratzel M (1991). A low-cost, high-efficiency solar cell based on dye-sensitized colloidal TiO2 films. Nature353: 737-740
https://doi.org/10.1038/353737a0
[3] Gunes S, Neugebauer H, Sacriciftci N S (2007) Conjugated polymer based organic solar cells. Chem Rev 107: 1324-1338
https://doi.org/abs/10.1021/cr050149z
[4] Cnops K, Rand B P, Cheyns D,Vereet B, Empland M A, Heremans P, (2014) 8.4% efficient fullerene-free organic solar cells exploiting long-range exciton energy transfer. Nature Communications 5: 3406
https://doi.org/10.1038/ncomms4406
[5] Kao C, (2016) Output-input ratio efficiency measures. Network Data Envelopment Analysis, International Series in Operations Research & Management Sciencech. 2: Springer International Publishing, Switzerland, pp 19-41 http://doi.org/10.1007/978-3-319-31718-2_2
[6] Sharma G, Handique J G (2016) Synthesis of series of low band gap small organic molecules and evaluation of their solar cell activity. Asian J. Chem 20: 2223-2227 https://doi.org/10.14233/ajchem.2016.19931
[7] Talluri S, (2002) Data envelopment analysis: models and extensions. Decision Line 31: 8-11
http://doi.org/ 10.1.1.584.644
[8] Ali A I, Lerm C S, Seiford L M (1995) Components of efficiency evaluation in data envelopment analysis. European journal of Operational Research 80: 462-473 https://doi.org/10.1016/0377-2217(94)00131-U
[9] Charnes A, Cooper W W, Rhodes E (1978) Measuring the efficiency of decision making units. European Journal of Operational Research 2: 429-444
https://doi.org/10.1016/0377-2217(78)90138-8
[10] Charnes A, Cooper W W, Galony B, Seiford L M, Stutz J, (1978) Foundations of data envelopment analysis and Pareto Koopmans empirical production functions. Journal of Econometrics30: 91-107
https://doi.org/10.1016/0304-4076(85)90133-2
http://doi.org/10.1007/978-1-4419-6151-8
[12] ZhuJ, (2009) Quantitative models for performance evaluation and benchmarking. International Series in Operations Research and Management Science, 2nded: F. S. Hillier, Ed. Springer,USA, pp. 1-13
http://doi.org/10.1007/978-3-319-06647-9
[13] Zoombelt A P, Fonrodona M, Turbiez M G R.,Wienk,M. M., Janssen, R. A. J. (2009) Synthesis and photovoltaic performance of a series of small band gap. J. Mater. Chem 19: 5336-5342
http://doi.org/ 10.1039/B821979F
[14] Dutta P, Yang W, Eom S H, Lee W-H, Kang I N, Lee S-H, (2012) Development of naphtha[1,2-b:5,6-b´] dithiophene based novel small molecules for efficient bulk-heterojunction organic solar cells. Chem. Commun 48: 573-575
http://doi.org/10.1039/C1CC15465F
[15] Zeng S, Yin L, Ji C, Jiang X, Li K, Li Y, Wang Y, (2012) D–π–A–π–D type benzothiadiazole–triphenylamine based small molecules containing cyano on the π-bridge for solution-processed organic solar cells with high open-circuit voltage. ChemCommun 48: 10627–10629
https://doi.org/10.1039/c2cc35754b
[16] Chou W-Y, Chang J, Yen C-T, Lin Y-S, Tang F-C, Liu S-J, Cheng H-L, Hsu S L-C, Chen J-S, (2012) The importance of p-n junction interfaces for efficient small molecule-based organic solar cells. Phys. Chem. Chem. Phys14: 5284–5288
http://doi.org/ 10.1039/C2CP24047E
[17] Sharma G D, Mikroyannidis J A, Kurchania R, ThomasK R J, (2012) Organic bulk heterojunction solar cells based on solution processable small molecules (A–p–A) featuring 2-(4-nitrophenyl) acrylonitrile acceptors and phthalimide-based p-linkers. J. Mater. Chem 22: 13986– 13995
http://doi.org/ 10.1039/c2jm16915k
[18] Demeter D, Rousseau T, Roncali J, (2013) 3,4-Ethylenedioxythiophene (EDOT) as building block for the design of small molecular donors for organic solar cells. RSC Adv 3: 704–707
http://doi.org/ 10.1039/C2RA22818A
[19] Chen M, Fu W, Shi M, Hu X, Pan J, Ling J, Li H, Chen H, (2012) An ester-functionalized diketopyrrolopyrrole molecule with appropriate energy levels for application in solution-processed organic solar cells. J. Mater. Chem. A 1: 105–111
http://doi.org/ 10.1039/C2TA00148A
[20] Fan Q, Li M, Yang P, Liu Y, Xiao M, Wang X, Tan H, Wang Y, Yang R, Zhu W, (2015) Acceptor-donor-acceptor small molecules containing benzo [1,2-b:4,5-b']dithiophene and rhodanine units for solution processed organic solar cells. Dyes and Pigments 116: 13–19 https://doi.org/10.1016/j.dyepig.2015.01.006
[21] Yan R, Qian X, Jiang Y, He Y, Hang Y, Hou L (2017) Ethynylene-linked planar rigid organic dyes based on indeno[1,2-b]indole for efficient dye-sensitized solar cells. Dyes and Pigments 141: 93–102
https://doi.org/10.1016/j.dyepig.2017.02.011
[22] Zhang J, Zhao B, Mi Y, Liu H, Guo Z, Bie G, Wei W, Gao C, An Z, (2017) A new wide bandgap small molecular acceptor based on indenofluorene derivatives for fullerene-free organic solar cells. Dyes and Pigments 140:261–268
https://doi.org/10.1016/j.dyepig.2017.01.039
[23] Courté M, Alaaeddine M, Barth V, Tortech L, Fichou D, (2017) Structural and electronic properties of 2,2′,6,6′-tetraphenyl-dipyranylidene and its use as a hole-collecting interfacial layer in organic solar cells. Dyes and Pigments 141: 487–492
https://doi.org/10.1016/j.dyepig.2017.03.002
[24] Park M, Jung J W, (2017) Anthracene-based perylenediimide electron-acceptor for fullerene-free organic solar cells. Dyes and Pigments 143: 301–307 https://doi.org/10.1016/j.dyepig.2017.04.057
[25] Sung M J, Huang M, Moon S H, Lee T H, Park S Y, Kim J Y, Kwon S-K, Choi H, Kim Y-H, (2017) Naphthalene diimide-based small molecule acceptors for fullerene-free organic solar cells. Solar Energy 150: 90–95
https://doi.org/10.1016/j.solener.2017.03.090
[26] Zhu K, Tang D, Zhang K, Wang Z, Ding L, Liu Y, Yuan L, Fan J, Song B, Zhou Y, Li Y, (2017) A two-dimension-conjugated small molecule for efficient ternary organic solar cells. Organic Electronics 48: 179–187
https://doi.org/10.1016/j.orgel.2017.06.009
[27] Domínguez R, Schulz G, Cruz P d. l, Bauerle P, Langa F, (2017)Cyclopentadithiophene-based co-oligomers for soluiton-processed organic solar cells. Dyes and Pigments 143:112–122
https://doi.org/10.1016/j.dyepig.2017.04.029
[28] Zhu X, Fang J, Lu K, Zhang J, Zhu L, Zhao Y, Shuai Z, Wei Z, (2014) Naphtho[1,2-b:5,6-b']dithiophene based two-dimensional conjugated polymers for high efficient thick-film inverted polymer solar cells. Chem. Mater 26: 6947-6954
![Table 2. Envelopment model (output oriented) [12]](https://thumb-us.123doks.com/thumbv2/123dok_us/8624654.1414362/2.612.326.563.273.483/table-envelopment-model-output-oriented.webp)