The Molecular Chaperone DnaK Is a Source of Mutational
Robustness
Jose´ Aguilar-Rodrı´guez
1,2,y, Beatriz Sabater-Mun˜oz
3,4,y, Roser Montagud-Martı´nez
3, Vı´ctor Berlanga
3,
David Alvarez-Ponce
5, Andreas Wagner
1,2,6,*, and Mario A. Fares
3,4,*
1Department of Evolutionary Biology and Environmental Studies, University of Zurich, Zurich, Switzerland
2Swiss Institute of Bioinformatics, Lausanne, Switzerland
3
Department of Abiotic Stress, Instituto de Biologı´a Molecular y Celular de Plantas (CSIC-UPV), Valencia, Spain 4
Department of Genetics, Smurfit Institute of Genetics, University of Dublin Trinity College Dublin, Dublin, Ireland 5
Department of Biology, University of Nevada, Reno, Reno, Nevada, USA 6
Santa Fe Institute, Santa Fe, New Mexico, USA
*Corresponding authors: E-mail: [email protected]; [email protected], [email protected]. y
These authors contributed equally to this work.
Accepted:July 22, 2016
Data deposition:New genomic sequences have been deposited in the Sequence Read Archive under the accession number SRP074414.
Abstract
Molecular chaperones, also known as heat-shock proteins, refold misfolded proteins and help other proteins reach their native conformation. Thanks to these abilities, some chaperones, such as the Hsp90 protein or the chaperonin GroEL, can buffer the deleterious phenotypic effects of mutations that alter protein structure and function. Hsp70 chaperones use a chaperoning mech-anism different from that of Hsp90 and GroEL, and it is not known whether they can also buffer mutations. Here, we show that they can. To this end, we performed a mutation accumulation experiment inEscherichia coli, followed by whole-genome resequencing. Overexpression of the Hsp70 chaperone DnaK helps cells cope with mutational load and completely avoid the extinctions we observe in lineages evolving without chaperone overproduction. Additionally, our sequence data show that DnaK overexpression increases mutational robustness, the tolerance of its clients to nonsynonymous nucleotide substitutions. We also show that this elevated mutational buffering translates into differences in evolutionary rates on intermediate and long evolutionary time scales. Specifically, we studied the evolutionary rates of DnaK clients using the genomes ofE. coli,Salmonella enterica, and 83 other gamma-proteo-bacteria. We find that clients that interact strongly with DnaK evolve faster than weakly interacting clients. Our results imply that all three major chaperone classes can buffer mutations and affect protein evolution. They illustrate how an individual protein like a chaperone can have a disproportionate effect on the evolution of a proteome.
Key words:molecular chaperones, mutational robustness, experimental evolution, protein evolution,Escherichia coli, DnaK.
Introduction
Robustness is one of the fundamental properties of living sys-tems (de Visser et al. 2003;Wagner 2005;Masel and Siegal 2009; Fares 2015). This property describes the ability of a biological system to preserve its phenotype in a particular en-vironment despite perturbations that it encounters. The ro-bustness of a system against perturbations that are environmental (e.g., a change in temperature) is referred to as environmental robustness, whereas robustness against per-turbations caused by genetic mutations receives the name of
mutational or genetic robustness. Molecular chaperones (Ellis 1987) are one of the best-known sources of both types of robustness (Fares 2015). Chaperones, also called heat-shock proteins, assist proteins in reaching their native conformations, prevent protein aggregation, and refold misfolded proteins (Young et al. 2004;Hartl and Hayer-Hartl 2009;Hartl et al. 2011). Thanks to these roles, chaperones can restore the native conformation of proteins destabilized by environmental perturbations, thus providing environmental robustness to or-ganisms coping with stressful conditions. Because some
GBE
ßThe Author 2016. Published by Oxford University Press on behalf of the Society for Molecular Biology and Evolution.
chaperones can buffer the deleterious effects of mutations that affect protein folding, they are also a source of mutational robustness. In the context of protein evolution, chaperones are able to increase a protein’s mutational robustness because they alter the mapping from protein genotypes into protein phenotypes, that is, into the structures that proteins form (Rutherford 2003). Specifically, they increase the number of amino acid sequences that fold into the same structure and that can perform the function associated with this structure. There are three main chaperone systems, which are the Hsp90 system, the Hsp70 system, and the Hsp60 system (or chaperonins), of which the bacterial GroEL is a prominent member (Hartl et al. 2011). Overwhelming evidence shows that Hsp90 and GroEL can buffer mutations (Bogumil and Dagan 2012), but whether the same holds for any major chaperone from the Hsp70 system is to our knowledge un-known. A recent study has shown that RNA chaperones— they help RNA molecules to fold properly, and comprise a class of chaperones different from these three systems—can also buffer deleterious mutations in Escherichia coli(Rudan et al. 2015).
Pioneering work carried out byRutherford and Lindquist (1998)showed that inhibition of the chaperone Hsp90 can unveil cryptic genetic variation—genotypic variation without phenotypic variation—in the fruit flyDrosophila melanogaster. Subsequently, similar observations have been made in the plant Arabidopsis thaliana (Queitsch et al. 2002), the yeast
Saccharomyces cerevisae (Cowen and Lindquist 2005) and the fishAstyanax mexicanus(Rohner et al. 2013). Further sup-port was provided byBurga et al. (2011), who found that high induction of Hsp90 during development of the nematode
Caenorhabditis elegans reduced the penetrance of certain mutations. Additionally,Lachowiec et al. (2013)found that paralogs of duplicated kinase-coding genes that encode a substrate of Hsp90 (i.e., a Hsp90 “client”) inSaccharomyces cerevisiaeoften evolve faster than paralogs encoding noncli-ents. In general, the rate at which nonconservative substitu-tions—those that alter physicochemical properties of amino acids—accumulate is especially accelerated in Hsp90 clients (Pechmann and Frydman 2014).
Multiple studies also demonstrate mutational buffering me-diated by the bacterial chaperonin GroEL. For example,Fares et al. (2002)showed that overexpressing GroEL considerably improved the fitness ofE. colistrains with a high load of del-eterious mutations, a pattern that was also observed later in
Salmonella enterica (Maisnier-Patin et al. 2005). Moreover, GroEL overexpression inE. coliincreases the ability of GroEL client proteins to tolerate mutations (Tokuriki and Tawfik 2009; Bershtein et al. 2013; Wyganowski et al. 2013;
Sabater-Mun˜oz et al. 2015), as well as their ability to undergo adaptive evolution (Tokuriki and Tawfik 2009; Wyganowski et al. 2013). Buffering of destabilizing mutations accelerates the evolutionary rates of GroEL clients (Bogumil and Dagan
2010;Warnecke and Hurst 2010;Williams and Fares 2010;
Pechmann and Frydman 2014).
While no Hsp70 chaperone has been directly implicated in mutational buffering, pertinent circumstantial evidence exists. For example, DnaK—the major bacterial Hsp70 chaperone— is overexpressed together with GroEL inS. entericalineages with reduced fitness caused by the accumulation of deleteri-ous mutations (Maisnier-Patin et al. 2005). In addition, D. melanogaster populations showing inbreeding depression, where increased homozygosity exposes recessive deleterious mutations, significantly up-regulate the expression of Hsp70 compared with outbred populations (Pedersen et al. 2005).
The chaperones from the Hsp70 system are very conserved from bacteria to humans (Powers and Balch 2013). They play a central role in proteome integrity, and are involved both in co-and post-translational folding (Hartl et al. 2011). In bacteria, the Hsp70 chaperone DnaK (together with GroEL and the Trigger Factor) is one of the main molecular chaperones, where it is the central hub in the chaperone network of the cytosol (Bukau and Walker 1989;Calloni et al. 2012). It inter-acts with at least ~700 mostly cytosolic proteins (Calloni et al. 2012). The DnaK interactome was characterized by the isola-tion of DnaK interactors using immobilized metal affinity chro-matography, followed by liquid chromatography mass spectrometry. These regular clients of DnaK are enriched for proteins with low intrinsic solubility, proteins that tend to be members of hetero-oligomeric complexes and/or proteins that show a high density of hydrophobic patches flanked by pos-itive residues (Calloni et al. 2012). DnaK is highly expressed constitutively and essential at 42C (Bukau and Walker 1989; Calloni et al. 2012). During its ATP-dependent reaction cycle, DnaK interacts with the Hsp40 co-chaperone DnaJ, which determines the client binding specificity of DnaK (Straus et al. 1990; Hoffmann et al. 1992), and the nucleotide ex-change factor GrpE (Hartl et al. 2011). The chaperone system formed by these three proteins can both fold nascent proteins and refold denatured proteins. It does so by binding to ex-posed hydrophobic patches in unfolded or partially folded protein substrates, thus preventing detrimental interactions with other polypeptides in the crowded cellular milieu. By suc-cessively binding and releasing a protein substrate in a cyclic process that consumes ATP, the chaperone system DnaK– DnaJ–GrpE allows the substrate to gradually explore its com-plex folding energy landscape (Hartl and Hayer-Hartl 2009;
Hartl et al. 2011). For some proteins (~20% of the total pro-teome), several of these bind-release cycles are enough to achieve the native conformation. However, other proteins (~10% of the total proteome) still require the downstream chaperone system GroEL/ES (Hartl et al. 2011). The impor-tance of the DnaK–DnaJ–GrpE system in the bacterial chaper-one network is obvious from its strong conservation across bacteria, except for two species from the order Aquificales that have lost the entire system, and individual losses of
dnaJ andgrpE in obligate endosymbionts that have experi-enced considerable genome reductions (Warnecke 2012).
Most mutations affecting proteins are neutral or deleteri-ous (Eyre-Walker and Keightley 2007), and functionally impor-tant mutations often destabilize proteins (Tokuriki et al. 2008;
Wyganowski et al. 2013). If DnaK buffers destabilizing muta-tions, then the deleterious effects of mutations in highly inter-acting (strong) clients should be lower than in sporadic (weak) clients, where they should be lower than in nonclients. In other words, the more strongly a protein’s integrity depends on DnaK, the higher should be its tolerance to mutations, and the lower the signature of purifying selection that purges those mutations. With this reasoning in mind, we here use laboratory experiments to evaluate the effect of DnaK buffer-ing on the evolution of its client proteome on short evolution-ary time scales. We complement our experimental observations with sequence analyses to study the effect of DnaK on intermediate and long evolutionary time scales.
Results
Experimental Evolution of E. coli under DnaK Overexpression
To study the effect of DnaK overexpression on protein evolu-tion experimentally, we performed mutaevolu-tion accumulaevolu-tion ex-periments similar to those we reported recently for the chaperonin GroEL, but for DnaK overexpression ( Sabater-Mun˜oz et al. 2015). Briefly, we initiated 68 parallel and inde-pendent clonal lines of evolution, all of which derived from the same hypermutable clone (E. coli K12 MG1655 mutS) (Sabater-Mun˜oz et al. 2015) (fig. 1A). Cells of the 68 lines all harbored the plasmid pKJE7, which contains the operon
dnaK–dnaJ–grpEunder the control of theL
-arabinose-induc-iblearaBpromoter PBAD(Nishihara et al. 1998). We refer to
this strain as DnaK+. We evolved 60 of the 68 DnaK+lines through repeated single-cell bottlenecks in the presence of the inducer, to ensure overexpression of DnaK, as well as of the cochaperone DnaJ and the nucleotide exchange factor GrpE. All evolving lineages were passaged after 24 hours of incubation. Because of the bottlenecks to which we exposed the populations, genetic drift was strong and the efficiency of selection was weak during the experiment, such that nonle-thal mutations are free to accumulate (Barrick and Lenski 2013). We evolved 30 of the 60 clonal lines at 37C, and
the other 30 at 42C. The higher temperature serves to
in-crease the deleterious effect of destabilizing mutations in the bacterial proteome (Bukau and Walker 1989). Finally, the re-maining 8 DnaK+lines were evolved in the absence of inducer,
and therefore without DnaK overexpression (4 lines at 37C
and the other 4 at 42
C).
At each of the two temperatures, we additionally evolved 8 control clonal lines founded from the same parental strain, but carrying a pKJE7-derived plasmid where the operon
dnaK–dnaJ–grpE is deleted (fig. 1B). Cells of all 16 control lines therefore cannot overexpress DnaK, even though their growth medium containsL-arabinose (DnaK lines). At each
temperature, half of the lines evolved in the presence ofL
-arabinose, whereas the other half evolved in medium devoid of this expression inducer. In total, we evolved 86 bacterial populations: 68 DnaK+lines and 16 DnaK
lines. We stopped the evolution experiment after 85 single-cell bottlenecks, or ~1,870 generations (assuming conservatively ~22 generations per daily growth cycle).
Evolving Lineages Tend to Go Extinct in the Absence of DnaK Overexpression
One of the first indications that DnaK overexpression could be buffering deleterious mutations accumulated during the evo-lution experiment is the observed pattern of extinctions (fig. 1). Some evolving lines went extinct, presumably due to high levels of mutational load, and remarkably, all extinctions occurred in lines that were not overexpressing DnaK. They were either DnaK
lines or DnaK+evolved in the absence of the inducer. More specifically, 75% of the DnaK
lines (12 of 16) went extinct before the end of the evolution experiment (fig. 1B). Among the DnaK+lines, 62.5% of the lines (5 of 8) evolving in the absence of the inducer went extinct, whereas none of the 60 lines evolving in the presence of the inducer experienced any extinction (fig. 1A). This observation strongly suggests that overexpressing the chaperone DnaK has in-creased the robustness of the cells to the accumulation of deleterious mutations, helping them cope with mutational load.
Overexpressing DnaK Increases the Robustness to Nonsynonymous Mutations of DnaK Clients
In order to study the effect of DnaK buffering on genome evolution, we sequenced the genomes of some lines at the end of the evolution experiment, after 85 passages, and com-pared them to the ancestral genome, which we had se-quenced in a previous study (Sabater-Mun˜oz et al. 2015). Among the clonal lines evolved in the presence of the inducer
L-arabinose, we randomly selected for sequencing 3
DnaK+lines evolved at 37C, and another 3 at 42C. We
also sequenced the only two surviving control DnaK
lines evolved withL-arabinose in the medium, each at a different
temperature. Although all sequenced lines evolved in the pres-ence of the inducer, only DnaK+lines are able to overexpress the chaperone.
In order to evaluate if a significant difference existed in the mutation rate (or generation time) between the sequenced DnaK+and DnaK
lines, we compared the number of accu-mulated synonymous mutations between them ( supplemen-tary table S1,Supplementary Material online). We observed an average number of 78 synonymous mutations per DnaK+line and 66 synonymous substitutions per DnaK
line,
which is not significantly different (binomial test,P= 0.359;
supplementary table S1,Supplementary Materialonline). We also did not observe any significant difference in the number of accumulated nonsynonymous mutations (binomial test,
P= 0.646; table 1), the number of indels (binomial test,
P= 0.332; supplementary table S1, Supplementary Material
online), or the ratio of transitions to transversions (2test,
P= 0.273; supplementary table S1, Supplementary Material
online).
We also verified that DnaK was still overexpressed at the end of the experiment in the 8 sequenced lines.
The overexpression of DnaK may be energetically costly, just as is the case for the chaperonin GroEL (Fares et al. 2002;
Sabater-Mun˜oz et al. 2015). In principle, this cost could favor the accumulation of mutations that lead to a decrease in the expression of DnaK during the evolution experiment, especially if the energetic cost of overproducing the chaper-one is greater than the benefits derived from mutational buff-ering (Sabater-Mun˜oz et al. 2015). However, we observed that for the sequenced lines the overexpression of DnaK was maintained through the mutation accumulation experi-ment at both 37C and 42C (fig. 2;supplementary fig. S1, FIG. 1.—Mutation accumulation experiment. Evolutionary history of the populations evolved in this study from the first daily transfer or single-cell bottleneck (T0) until the end of the evolution experiment (T85). We constructed two strains derived from an ancestralEscherichia coliK-12 MG1655 strain
lacking the mismatch repair genemutS. The DnaK+strain harbours the ~15-copy plasmid pKJE7 that contains the DnaK/DnaJ/GrpE chaperone system under the control of the promoter PBADinducible by L-arabinose (Nishihara et al. 1998). The DnaKstrain contains a control pKJE7-derived plasmid where the
operondnaK–dnaJ–grpEhas been deleted. We evolved in parallel multiple independent populations of both strains through single-cell bottlenecks under the effect of strong genetic drift at two different temperatures (37C and 42C). At each temperature we evolved some populations in the presence of L-arabinose (L-ara+), and some in the absence of this expression inducer (L-ara–). (A) During the evolution of 68 DnaK+populations, five out of eight lines
evolving in the absence of inducer went extinct (indicated by a cross). None of the 60 lines evolving under DnaK overexpression experienced any extinction. (B) Of the 16 independent DnaK
populations, 12 populations went extinct. We finished the evolution experiment after 85 single-cell bottlenecks (T85), or
~1,870 generations.
Supplementary Materialonline). In the presence of the inducer
L-arabinose, all DnaK+lines overexpressed DnaK not only at
the start of the evolution experiment, but also at the end, except for one of the DnaK+lines evolved at 42C.
However, this loss of overexpression occurred towards the end of the experiment and even then DnaK was still over-expressed for most of the daily growth cycle of this line ( sup-plementary fig. S2,Supplementary Materialonline). In no line did we observe overexpression in the absence of the inducer. The control DnaK
lines always exhibited wild-type expression levels of DnaK.
In the genomes of the evolved DnaK+lines, we first studied the incidence of nonsynonymous nucleotide substitutions among DnaK clients and nonclients (table 1). In this analysis, we considered as nonclients all proteins from theE. coli pro-teome that are not part of a set of 674 DnaK clients deter-mined byCalloni et al. (2012), and analyzed the lines evolved at 37
C and 42
C independently. To improve statistical power, we combined mutations across DnaK+lines evolved
at the same temperature after classifying them according to whether they affect DnaK clients or nonclients. If DnaK is buffering deleterious mutations, we would expect a higher proportion of mutations affecting clients in the lines evolved under DnaK overexpression.
In the DnaK
line evolved at 37C, ~14% of
nonsynon-ymous mutations (17 out of 125) affected DnaK clients. Compared with this proportion when DnaK is not overex-pressed, the proportion of mutations in clients in the DnaK+lines was significantly higher (56 out of the total 288 mutations, ~19%; binomial test:P= 0.006;fig. 3A). Similarly,
compared with the DnaK
line evolved at 42C, where ~13%
of all mutations affected DnaK clients (15 out of 114 muta-tions), the DnaK+lines showed significantly more mutations in clients (71 out of 384 total mutations, ~18%; binomial test:
P= 0.003;fig. 3A). These results suggest that overexpressing DnaK does indeed increase the robustness of its clients to amino acid replacements. Temperature itself had no signifi-cant effect on the fraction of all mutations affecting DnaK clients in DnaK+lines (Fisher’s exact test: odds ratioF= 1.06,
P= 0.77) and DnaK
lines (Fisher’s exact test: odds ratio
F= 1.04,P= 0.999).
Strong DnaK Clients Accumulate More Nonsynonymous Mutations than Weak Clients
Next, we studied if strongly interacting DnaK clients are more robust to mutations than weakly interacting clients, as evi-denced by the pattern of mutations fixed in the mutation accumulation experiment under DnaK overexpression. To assess how strongly a protein depends on DnaK for folding, we used recent experimental proteomic data which deter-mined how strongly 668 DnaK-interacting proteins interact with DnaK by measuring the fraction of cellular protein bound to DnaK at 37C, a property that correlates with
chap-erone dependency for folding and maintenance and residence time of the protein on DnaK (Calloni et al. 2012). In adnaK E. colistrain, strong clients are more prone to form aggregates than weak clients, indicating that the relative enrichment of a protein on DnaK is a good proxy for the dependence upon DnaK for folding (Calloni et al. 2012). We consider as strong clients those with a relative enrichment factor on DnaK within the third quartile of the distribution of DnaK dependency (N= 167), and weak clients those within the first quartile (N= 167). Therefore, strong clients include those clients with the highest DnaK dependency, whereas weak clients include clients with the lowest chaperone dependency.
In the DnaK+lines evolved at 37C, we found more
non-synonymous substitutions in strong clients (21 mutations) than in weak clients (4 mutations) (table 1). Considering the number of nonsynonymous sites in strong clients (43,731 sites) and weak clients (41,238 sites), this difference was sig-nificant (Fisher’s exact test: F= 4.95, P= 0.001; fig. 3B). At 42C, the results were similar, with 33 mutations in strong
clients and 6 in weak clients (Fisher’s exact test: F= 5.12,
P= 1.9105
;fig. 3B; table 1). In conclusion, at both tem-peratures, client proteins that are more dependent upon DnaK for folding accumulate significantly more mutations than less dependent clients.
DnaK Accelerates Protein Evolution On Intermediate and Long Evolutionary Time Scales
[image:5.595.51.288.132.275.2]We wanted to find out if the DnaK-mediated mutational buff-ering we observed on the short time scales of laboratory evo-lution has also left signatures on longer evoevo-lutionary time
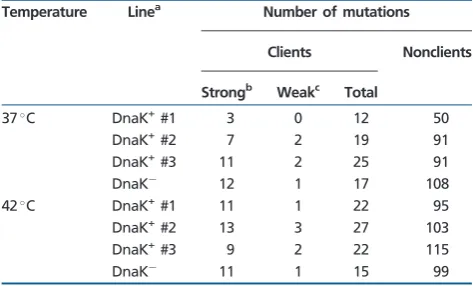
Table 1
Distribution of Nonsynonymous Nucleotide Substitutions among DnaK Client and Nonclient Proteins After ~1,870 Generations of Evolution
in Mutation Accumulation Experiments Conducted at 37C and 42C
Temperature Linea Number of mutations
Clients Nonclients
Strongb Weakc Total
37C DnaK+#1 3 0 12 50
DnaK+#2 7 2 19 91
DnaK+#3 11 2 25 91
DnaK 12 1 17 108
42C DnaK+
#1 11 1 22 95
DnaK+#2 13 3 27 103
DnaK+#3 9 2 22 115
DnaK
11 1 15 99
aExperimental evolution lines sequenced in this study. For each temperature, we sequenced three lines overexpressing the DnaK–DnaJ–GrpE chaperone system (DnaK+lines) and a control line where this system is expressed at wild type levels (DnaKline).
bStrong clients are those with a high relative enrichment factor on DnaK within the third quartile of the distribution.
cWeak clients are those with a low relative enrichment factor on DnaK within the first quartile of the distribution.
scales. To this end, we determined two measures of evolu-tionary rates for protein-coding genes from gamma-proteo-bacteria. The first, nonsynonymous divergence among one-to-one orthologs ofE. coliandS. enterica, is relevant for in-termediate evolutionary time scales. The second, protein (amino acid) distance among orthologous proteins found in 85 gamma-proteobacterial genomes (includingE. coliandS. enterica), is relevant for long time scales. We employ protein distance instead of nonsynonymous distance because amino acid replacements are less sensitive than nucleotide substitu-tions to the expected loss of phylogenetic signal between se-quences of distantly related taxa. To assess how strongly a protein depends on DnaK for folding, we use the relative en-richment of the protein on DnaK as a proxy for the depen-dence of the protein upon DnaK for folding (Calloni et al. 2012). We note that this interaction strength is more likely to have remained unchanged during the divergence ofE. coli
andS. enterica, than during the divergence of all the other 83 gamma-proteobacterial species we analyzed.
We find a strong and highly significant positive association between DnaK dependency and the rate of nonsynonymous substitutions for S. enterica and E. coli (Spearman’s rank
correlation coefficient,r= 0.367, N= 627, P<2.21016
;
fig. 4A). This indicates that the stronger the interaction of a protein with DnaK, the faster the protein evolves. The same pattern is obtained at the larger time scales of protein dis-tances for 85 gamma-proteobacterial genomes (r= 0.257,
N= 311, P= 4.4106
; fig. 4B). Gene expression level, which is the most important determinant of protein evolution-ary rates, at least in unicellular organisms (Pa´l et al. 2001;
Drummond et al. 2005;Zhang and Yang 2015), is a possible confounding factor in this analysis. For example, using codon usage bias (CUB) as a proxy for gene expression, we observe that genes with higher CUB show lower nonsynonymous di-vergence (r=0.558, N= 1014, P<2.21016
), protein distance (r=0.255,N= 3159,P<2.21016
) and DnaK dependency (r=0.262, N= 627, P= 2.51011
). However, the association between DnaK dependency and evolutionary rate cannot be solely explained by this confound-ing factor: A partial correlation analysis shows that the asso-ciation still holds after controlling for CUB, both on intermediate time scales (r= 0.295, N= 627, P= 1.21014
) and long time scales (r= 0.229, N= 311,
P= 3.8105
). We use CUB instead of gene expression
FIG. 2.—DnaK abundance at the beginning and the end of the mutation accumulation experiment. We measured the abundance of the chaperone DnaK for the 8 sequenced lines evolved trough 85 single-cell bottlenecks (~1,870 generations) at 37C or 42C. For comparison, we also measured the abundance of the chaperone in the ancestral DnaK+and DnaK
strains at both temperatures. We determined DnaK levels in the presence and absence of the inducer L-arabinose (L-ara+and L-ara–, respectively), as described in Materials and Methods (“Verification of DnaK overexpression”), via the intensity of the
DnaK band in a Western blot. The evolved lines did not lose the ability to overexpress DnaK in the presence of the inducer L-arabinose except for a DnaK+line evolved at 42C (line #2), which explains the decrease in the average DnaK abundance at the end of the evolution experiment. However, this loss of overexpression occurred late in the evolution experiment, and it is not even complete for most of the daily growth cycle of this line (supplementary fig. S2, Supplementary Materialonline). The height of the bars indicates mean DnaK abundance across two experimental replicates per strain and condition. Error bars represent 1 SD of the mean.
data here for two main reasons. First, we can compute CUB for all 631 DnaK clients in our data set, whereas expression data is only available for 457 clients. Second, gene expression data has been measured in just one environment and one strain ofE. coli, whereas CUB is the result of selective pressures imposed by many different environments over long periods of time. Nonetheless, the association between evolutionary rate and DnaK dependency still holds after correcting for gene expression directly (supplementary information section 1.1,
Supplementary Materialonline). Together, these results indi-cate that the chaperone DnaK affects protein evolution in accordance with the mutational buffering hypothesis. Importantly, this effect is not only independent of CUB and gene expression, but also of other biological factors, such as essentiality and number of protein–protein interactions (supplementary information section 1.2 and table S2,
Supplementary Materialonline).
In a subsequent analysis, we find that clients evolve more slowly than nonclients (supplementary fig. S3and supplemen-tary informationsection 1.3,Supplementary Materialonline). This last difference cannot be explained by the number of protein–protein interactions, by essentiality, or by CUB as con-founding factors (supplementary informationsection 1.3 and
supplementary tables S3 and S4, Supplementary Material
online). The reason for this observation could be that clients are intrinsically less robust to mutations than nonclients due to some general physicochemical difference. For example,
Calloni et al. (2012)found that DnaK clients have generally low solubility, often belong to heterooligomeric complexes, and are prone to misfolding. However, in accordance with the mutational buffering hypothesis we observe that strong clients evolve faster than weak clients (fig. 5;supplementary informationsection 1.3,Supplementary Materialonline). The accelerated evolution of strong clients compared with weak clients exactly mirrors the greater accumulation of nonsynon-ymous mutations in strong clients during the evolution exper-iment (fig. 4B).
DnaK-Mediated Acceleration of Protein Evolution Is Independent of GroEL Buffering
The ability of DnaK to facilitate the accumulation of nonsynon-ymous mutations in DnaK clients resembles the well-studied mutational buffering by the chaperonin GroEL (Fares et al. 2002; Tokuriki and Tawfik 2009; Bershtein et al. 2013;
Wyganowski et al. 2013; Sabater-Mun˜oz et al. 2015). Additionally, the observed correlation between DnaK depen-dency and protein evolutionary rates is similar to the previously
FIG. 3.—Nonsynonymous mutations accumulated in DnaK clients. (A) The proportion of nonsynonymous mutations that affect DnaK clients is signif-icantly higher in DnaK+lines that overexpress DnaK than in the control DnaK
lines that do not express the chaperone at such high levels. This is observed both for lines evolved at 37C and 42C. We combined mutations across DnaK+
lines evolved at the same temperature. The significance of the difference in the proportions was evaluated using a binomial test. (B) At both temperatures, strong clients have accumulated significantly more nonsynonymous substitutions than weak clients in DnaK+lines. Strong clients include those clients with the highest DnaK dependency, whereas weak clients include clients
with the lowest chaperone dependency. Statistical significance was evaluated using Fisher’s test.
reported acceleration of protein evolution by GroEL (Bogumil and Dagan 2010; Williams and Fares 2010). We therefore removed known GroEL clients from our data set to investigate if our observations are independent of the effect of GroEL on
mutation accumulation and evolutionary rates. We defined the GroEL interactome inE. colias the union of two previously reported sets of DnaK interactors (Kerner et al. 2005;Fujiwara et al. 2010). Of the 253 GroEL clients that comprise the GroEL
FIG. 4.—DnaK accelerates protein evolution on intermediate and long evolutionary time scales.Scatter-plots showing the relationship between DnaK dependency (calculated as a relative enrichment factor that indicates the fraction of cellular protein bound to DnaK at 37C, horizontal axis) and the degree of divergence over (A) intermediate time scales, measured as nonsynonymous divergence (Spearman rank correlation coefficient,r= 0.367,N= 627, P<2.21016), and (B) long time scales, measured as protein (amino acid) distance (r= 0.257,N= 311,P= 4.4106) (vertical axes). Solid lines
represent the best fit to the points. Note the logarithmic scale on both axes.
FIG. 5.—Strong clients evolve faster than weak clients. (A) We find that strong clients evolve faster than weak clients on intermediate evolutionary time scales, measured as the rate of nonsynonymous substitutions (Wilcoxon rank-sum test,P<2.21016). (B) On long evolutionary time scales, we also find
that strong clients evolve faster than weak clients (Wilcoxon rank-sum test,P= 2.3103
). The thick horizontal line in the middle of each box represents the median of the data, whereas the bottom and top of each box represent the 25th and 75th percentiles, respectively. Note the logarithmic scale on they-axis in (A).
interactome, there are 122 proteins that are also clients of DnaK.
The observation that DnaK overexpression increases the proportion of nonsynonymous substitutions affecting DnaK clients is still significant after removing GroEL clients. Combining mutations from the DnaK+lines evolved at 37C
and 42C we find that ~16% of mutations (97 out of 621)
affected DnaK clients, which is significantly higher than what we find in the DnaK
lines (28 out of 230 mutations, ~12%; binomial test:P= 0.01). Similarly, considering the number of nonsynonymous sites in strong clients (36,026 sites) and weak clients (33,047 sites) after removing GroEL clients, we still find that strong DnaK clients accumulate more nonsynonymous substitutions than weak clients (Fisher’s exact test: odds ratio F= 4.7, P= 2105). Finally, the positive association
between DnaK dependency and evolutionary rates still holds after removing GroEL clients and controlling for CUB in a par-tial correlation analysis, both on intermediate time scales (r= 0.318, N= 511, P= 3.91014) and long time scales
(r= 0.226,N= 240,P= 3.6104).
Discussion
We show how the overexpression of the DnaK–DnaJ–GrpE chaperone system over the course of a mutation accumulation experiment increases the proportion of nonsynonymous sub-stitutions affecting DnaK clients. In addition, strong clients accumulate more nonsynonymous mutations than weak cli-ents. Additional evidence of mutational buffering by DnaK is provided by the observation that evolving lines overproducing this chaperone avoid extinction after experiencing 85 single-cell bottlenecks. Recently, we obtained similar results in hyper-mutable E. coli cells evolving in identical conditions but overproducing the GroEL-GroES chaperonin system (Sabater-Mun˜oz et al. 2015). There, we observed that lines evolving with high levels of GroEL were not only less prone to extinction under strong genetic drift than control lines, but also that they were accumulating significantly more indels and replacements between amino acids belonging to different physicochemical categories.
We also find that DnaK-mediated mutational buffering has left a trace in DnaK clients during the divergence of 85 differ-ent gamma-proteobacterial species over much longer evolu-tionary time scales than those explored in our laboratory evolution experiment. We find that clients that depend more on DnaK for folding tend to evolve faster than less in-teracting clients. Similar chaperone-mediated accelerations of protein evolution have been observed in GroEL clients (Bogumil and Dagan 2010; Williams and Fares 2010) and Hsp90 clients (Lachowiec et al. 2013; Pechmann and Frydman 2014). However, we notice that DnaK clients evolve slower than proteins not known to be DnaK interactors (Calloni et al. 2012). This is likely the result of important phys-icochemical differences between clients and nonclients.
For example, clients are prone to aggregation and misfolding (Calloni et al. 2012), which may make them intrinsically less robust to destabilizing mutations.
Despite the great differences in the mechanism of chaper-one action between the three major chaperchaper-one families—cha-peronins, Hsp90 chaperones and Hsp70 chaperones—(Young et al. 2004;Hartl et al. 2011;Bogumil and Dagan 2012;Kim et al. 2013), at least some of their members seem to have qualitatively comparable effects on protein evolution. But pro-tein chaperones are not the only chaperones that can increase the mutational robustness of their substrates: A recent study has found that some RNA chaperones can buffer deleterious mutations inE. coliand therefore affect RNA evolution (Rudan et al. 2015). These chaperones, which are completely unre-lated to protein chaperones, are RNA-binding proteins that facilitate the proper folding of RNA molecules. Elucidating to what extent the buffering mechanisms of all these chaperones differ is an important future direction of enquiry.
Thanks to their fostering of mutational robustness, chaper-ones can facilitate evolutionary innovations (Rutherford 2003), even though we do not study such innovations here. The in-crease in the mutational robustness of a protein caused by chaperone interactions reduces the efficiency of purifying se-lection in purging mutations in the protein. Thanks to chap-erone-mediated buffering, many such mutations are neutral and can persist in a population. Importantly, these cryptic ge-netic variants may include preadaptive mutations that can generate evolutionary innovations in new environments (Tokuriki and Tawfik 2009;Wyganowski et al. 2013). To illu-minate if and how DnaK can increase the ability to evolve functional innovations of its client proteome will also be an interesting subject for future work.
In summary, we analyzed the evolution of proteins that are subject to DnaK-assisted folding on short, intermediate, and long evolutionary time scales through a combination of exper-imental and comparative approaches. Most of our evidence indicates that the bacterial chaperone DnaK can buffer muta-tions in its client proteins, and that these proteins therefore evolve faster than in the absence of DnaK-mediated folding. This is, to our knowledge, the first demonstration that a member of the Hsp70 family can buffer the effect of muta-tions, with long-term consequences on protein evolution (Bogumil and Dagan 2012). Through its role in protein folding, an individual chaperone such as DnaK can have a dispropor-tionate effect on proteome evolution, and thus on genome evolution.
Materials and Methods
Bacterial Strains and Plasmids
We obtainedE. coliK-12 substr. MG1655mutS::FRT from Ivan Matic (Universite´ Paris Descartes, INSERM U1001, Paris, France) through Jesu´s Bla´zquez (Centro Nacional de
Biotecnologı´a, CSIC, Madrid, Spain) (Sabater-Mun˜oz et al. 2015). In this E. colistrain, the gene encoding the protein MutS has been deleted. This protein is a component of the mismatch repair system that recognizes and binds mispaired nucleotides so that the mispairing can be corrected by two further repair proteins, MutL and MutH. The strain MG1655
mutShas a predicted mutation rate that is 1000-fold higher than the wild type (Turrientes et al. 2013), which ensures that a sufficient number of mutations occur during the mutation accumulation experiment. We transformed this strain with the plasmid pKJE7 (Takara, Cat. #3340), which contains an operon encoding DnaK, and its co-chaperones DnaJ and GrpE under the regulation of a single promoter inducible by
L-arabinose (Nishihara et al. 1998). We generated a control
strain by transforming the samemutSstrain with a plasmid that lacks the operondnaK–dnaJ–grpEbut is otherwise iden-tical to pKJE7. We refer to this plasmid as pKJE7-DEL(dnaK–
dnaJ–grpE). This control plasmid was derived from the plasmid pKJE7 by removal of the operondnaK–dnaJ–grpE with a re-striction digest usingBamHI andSpeI, followed by religation, after obtaining permission for plasmid modification from Takara.
Evolution Experiment
We evolved 68 clonal lines of the hypermutableE. colimutS
strain containing pKJE7 (DnaK+lines) and 16 lines containing the control plasmid pKJE7-DEL(dnaK–dnaJ–grpE) (DnaK lines) by daily passaging them through single-cell bottlenecks on solid LB medium (agar plates; Pronadisa #1551 and #1800) supplemented with 20 mg/ml of chloramphenicol (Sigma-Aldrich #C0378) (fig. 1). Except for 8 DnaK+lines and 8
DnaK
lines, all the remaining lines were evolved in the pres-ence of 0.2% (w/v) ofL-arabinose (Sigma-Aldrich #A3256),
which induces the expression of DnaK/DnaJ/GrpE from the plasmid pKJE7 but not from the control plasmid pKJE7-DEL(dnaK–dnaJ–grpE). We passaged both the DnaK
and DnaK+lines during 85 days or ~1,870 generations
(conserva-tively assuming ~22 generations per daily growth cycle), except for those lines that went extinct before reaching the end of the experiment. We evolved half of the DnaK+and
DnaK
lines under mild heat-stress (42C) whereas the
other half remained at 37C.
Verification of DnaK Overexpression
We grew the ancestral and evolved strains (DnaK+and DnaK–, at 37C and 42C) from glycerol stocks in liquid LB medium
supplemented with 20mg/ml of chloramphenicol in the pres-ence or abspres-ence of the inducerL-arabinose (0.2%). After 24 h
of growth, we pelleted cells by centrifugation at 12,000 rpm. We resuspended the pelleted cells in 100ml lysis buffer (con-taining 200 mM Tris–HCl pH 6.8, 10 mM DTT, 5% SDS, 50% glycerol). To prepare a crude extract, we first boiled resus-pended cells at 95C for 15 min. After the removal of cell
debris by centrifugation, we quantified soluble proteins using the Bradford method (Bradford 1976). We loaded 1mg of total protein for each sample in SDS–PAGE gels (12.5% re-solving gel). In addition, we loaded onto all gels samples from the ancestral DnaK
and DnaK+strains grown in the presence of inducer at 37
C, as controls to facilitate inter-gel compar-isons. We detected DnaK protein by Western blotting using as primary antibody a mouse monoclonal antibody specific toE. coliDnaK (Abcam #ab69617) at a 1:10,000 dilution, and as secondary antibody a goat polyclonal (alkaline phosphatase-conjugated) antibody specific to mouse IgG1 (Abcam #ab97237). We scanned membranes after colorimetric detec-tion of conjugated antibodies with the BCIPÕ/NBT-Purple liquid substrate system (Sigma-Aldrich #BP3679), and used ImageJ to quantify the intensity of DnaK bands on the Western blots (Schneider et al. 2012). We used the control samples to normalize abundances, which allow the compari-son of DnaK levels across experiments.
We examined the change in DnaK levels along a daily cycle of growth for a DnaK+line evolved at 42C (line #2, supple-mentary fig. S2,Supplementary Materialonline) that showed a lowed DnaK level after ~1,870 generations of mutation ac-cumulation. After 24 h of exponential growth at 42
C in liquid LB medium supplemented with chloramphenicol, we diluted the culture to OD ~0.3, and induced DnaK expression by adding 10 mM ofL-arabinose. We allowed the culture to
grow for another 24 h in the presence of this expression in-ducer. Each hour, 1 ml of culture was removed and the DnaK level following the protocol described earlier was measured.
Whole-Genome Resequencing
We sequenced the genomes of 2 DnaK
and 6 DnaK+lines after 85 single-cell bottlenecks. All of these lines evolved in the presence of L-arabinose in the medium, although only
DnaK+cells are able to overexpress DnaK. Half of the se-quenced DnaK
and DnaK+lines evolved at 37C, whereas
the other lines evolved at 42C. We used the genome
se-quence of the ancestralmutS strain from which both the DnaK+and DnaK
lines were derived from our previous study (Sabater-Mun˜oz et al. 2015).
Specifically, for the evolved lines we performed paired-end Illumina whole-genome sequencing. For DNA extraction, we used the QIAmp DNA mini kit (Qiagen, Venlo [Pays Bas], Germany) in a QiaCube automatic DNA extractor using bac-terial pellets obtained from ~10 ml cultures. We constructed multiplexed DNAseq libraries from each clonal evolution line using the TrueSeq DNA polymerase chain reaction-free HT sample preparation kit (Illumina). We performed paired-end sequencing on an Illumina HiSeq2000 platform, using a 2100 cycles configuration.
We converted sequencing reads from Illumina quality scores into Sanger quality scores. Subsequently, we used the breseq v 0.24rc4 (version 4) pipeline (Deatherage and Barrick
2014) for aligning the Illumina reads to ourE. coli parental genome and for identifying single nucleotide polymorphisms and indels using bowtie2 (Langmead and Salzberg 2012). We performed individual runs of breseq, with junction prediction disabled but otherwise default parameters for each of the evolved lines. We deposited the data from this project at the NCBI Sequence Read Archive under the accession SRP074414.
Sequence Data
We obtained the complete genomes ofE. coliK-12 MG1655 (NC_000913) and S. enterica serovar Typhimurium LT2 (NC_003197) from GenBank Genomes (ftp://ftp.ncbi.nih. gov/genomes/Bacteria/). We also used a data set from
Williams and Fares (2010)that consists of 1092 multiple se-quence alignments of conserved orthologous proteins from 85 gamma-proteobacterial genomes.
DnaK Dependency
We obtained information about DnaK clients from Calloni et al. (2012). This study used quantitative proteomics to iden-tify 674 DnaK interactors or client proteins. For 668 of these proteins, the investigators calculated a relative enrichment factor that indicates the fraction of cellular protein bound to DnaK at 37C. We used this measure as a proxy for DnaK
dependency. We excluded from our analyses the transposases InsC, InsH and InsL of the insertion sequences IS2, IS5 and IS186, respectively. In the genome ofE. coliK-12 MG1655 there are 6 copies ofinsC, 11 ofinsHand 3 ofinsL.
GroEL Dependency
We obtained information about 253 GroEL clients from
Kerner et al. (2005)and Fujiwara et al. (2010). Our set of GroEL clients is the union of the slightly different GroEL inter-actomes characterized in these two studies. We excluded from our analyses the transposase insH of the insertion se-quences IS5 and 3 clients reported byKerner et al. (2005), which are encoded on plasmids (SwissProt Accession Numbers: P00810, P29368 and Q9339).
Orthology
We identified 3159 one-to-one orthologs in E. coli and S. enterica genomes as reciprocal best hits (Tatusov et al. 1997) using the Basic Local Alignment Search Tool (BLAST, i.e., BLASTP with anE-value cut-off of 1010
). We identified 631 and 242S. entericaorthologs to DnaK and GroEL clients, respectively. We aligned each pair of orthologous proteins with the Needleman–Wunsch dynamic programming algo-rithm, using the Needle program from the EMBOSS package (Rice et al. 2000). We translated the resulting alignments into codon-based nucleotide alignments with PAL2NAL (Suyama et al. 2006).
Evolutionary Rates
We estimated the rate of nonsynonymous substitutions (dN)
using the program codeml from the package PAML 4.7 (one-ratio model M0) (Yang 2007). We calculated protein distances for the gamma-proteobacterial alignments fromWilliams and Fares (2010), using PROTDIST from the PHYLIP package (Felsenstein 2005) and the Jones, Taylor and Thornton (JTT) substitution matrix (Jones et al. 1992). We calculated an av-erage distance for each cluster of orthologous proteins as the mean of all pairwise distances.
Codon Usage Bias
We computed the Codon Adaptation Index (CAI) using the program CAI from the EMBOSS package (Rice et al. 2000). We calculated Codon Usage Bias (CUB) for each pair ofE. coli—S. entericaorthologs as the mean of the CAI values for each pair of orthologs. We used CUB as a proxy for gene expression.
Protein–Protein Interactions
We obtained the number of protein–protein interactions (PPI) for eachE. coliK-12 protein fromRajagopala et al. (2014). The binary interactions considered for this study are a combination of the following: (1) literature curated interactions supported by multiple studies or methods and (2) interactions identified by yeast two-hybrid (Y2H) screening. We removed interac-tions involving DnaK or DnaJ.
Essentiality
We obtained data about gene dispensability forE. coliK-12 in rich media fromBaba et al. (2006).
Gene Expression
We obtained gene expression data forE. coliK-12 MG1655 grown in rich media (LB) at 37C from Chen and Zhang (2013), where gene expression levels are measured as number of RNA-seq reads per gene length.
Statistical Tests
We carried out all statistical analyses and plotted data with R (R Development Core Team 2016) using the packages “base”, “pcor”, “ggplot2”, “dplyr” and “gridExtra”.
Supplementary Material
Supplementary tables S1–S4, figures S1–S3, and supplemen-tary information sections 1.1–1.3 are available at Genome Biology and Evolution online (http://www.gbe.oxfordjour nals.org/).
Acknowledgments
The authors thank Xiaoshu Chen and Jianzhi Zhang for kindly providing us with the gene expression data. This work was supported by the Forschungskredit program of the University of Zurich (grant FK-14-076 to J.A.), the Swiss National Science Foundation (grant 31003A_146137 to A.W.), the University Priority Research Program in Evolutionary Biology at the University of Zurich (to A.W.), the Science Foundation Ireland (grant 12/IP/1673 to M.A.F.), and the Spanish Ministerio de Economı´a y Competitividad (grant BFU2012-36346 to M.A.F.). We posted an earlier version of this paper in bioRxiv (doi: http://dx.doi.org/10.1101/040600) on 22 February 2016.
Literature Cited
Baba T, et al. 2006. Construction ofEscherichia coliK-12 in-frame, single-gene knockout mutants: the Keio collection. Mol Syst Biol. 2: 2006.0008.
Barrick JE, Lenski RE. 2013. Genome dynamics during experimental evo-lution. Nat Rev Genet. 14:827–839.
Bershtein S, Mu W, Serohijos AWR, Zhou J, Shakhnovich EI. 2013. Protein quality control acts on folding intermediates to shape the effects of mutations on organismal fitness. Mol Cell 49:133–144.
Bogumil D, Dagan T. 2010. Chaperonin-dependent accelerated substitu-tion rates in prokaryotes. Genome Biol Evol. 2:602–608.
Bogumil D, Dagan T. 2012. Cumulative impact of chaperone-mediated folding on genome evolution. Biochemistry 51:9941–9953. Bradford MM. 1976. A rapid and sensitive method for the quantitation of
microgram quantities of protein utilizing the principle of protein-dye binding. Anal Biochem. 72:248–254.
Bukau B, Walker GC. 1989. Cellular defects caused by deletion of the Escherichia coli dnaKgene indicate roles for heat shock protein in normal metabolism. J Bacteriol. 171:2337–2346.
Burga A, Casanueva MO, Lehner B. 2011. Predicting mutation outcome from early stochastic variation in genetic interaction partners. Nature 480:250–253.
Calloni G, et al. 2012. DnaK functions as a central hub in theE. coli chaperone network. Cell Rep. 1:251–264.
Chen X, Zhang J. 2013. No gene-specific optimization of mutation rate in Escherichia coli. Mol Biol Evol. 30:1559–1562.
Cowen LE, Lindquist S. 2005. Hsp90 potentiates the rapid evolution of new traits: drug resistance in diverse fungi. Science 309:2185–2189. de Visser JAGM, et al. 2003. Perspective: evolution and detection of
ge-netic robustness. Evolution 57:1959–1972.
Deatherage DE, Barrick JE. 2014. Identification of mutations in laboratory-evolved microbes from next-generation sequencing data using breseq. Methods Mol Biol. 1151:165–188.
Drummond DA, Bloom JD, Adami C, Wilke CO, Arnold FH. 2005. Why highly expressed proteins evolve slowly. Proc Natl Acad Sci U S A. 102:14338–14343.
Ellis J. 1987 Proteins as molecular chaperones. Nature 328:378–379. Eyre-Walker A, Keightley PD. 2007. The distribution of fitness effects of
new mutations. Nat Rev Genet. 8:610–618.
Fares MA. 2015. The origins of mutational robustness. Trends Genet. 31:373–381.
Fares MA, Ruiz-Gonza´lez MX, Moya A, Elena SF, Barrio E. 2002. Endosymbiotic bacteria: GroEL buffers against deleterious mutations. Nature 417:398.
Felsenstein J. 2005. PHYLIP (Phylogeny Inference Package) version 3.6. Distributed by the author. Department of Genome Sciences, University of Washington, Seattle.
Fujiwara K, Ishihama Y, Nakahigashi K, Soga T, Taguchi H. 2010. A sys-tematic survey of in vivo obligate chaperonin-dependent substrates. EMBO J. 29:1552–1564.
Hartl FU, Bracher A, Hayer-Hartl M. 2011. Molecular chaperones in protein folding and proteostasis. Nature 475:324–332.
Hartl FU, Hayer-Hartl M. 2009. Converging concepts of protein folding in vitro and in vivo. Nat Struct Mol Biol. 16:574–581.
Hoffmann HJ, Lyman SK, Lu C, Petit MA, Echols H. 1992. Activity of the Hsp70 chaperone complex–DnaK, DnaJ, and GrpE–in initiating phage lambda DNA replication by sequestering and releasing lambda P pro-tein. Proc Natl Acad Sci U S A. 89:12108–12111.
Jones DT, Taylor WR, Thornton JM. 1992. The rapid generation of muta-tion data matrices from protein sequences. Comput Appl Biosci. 8:275–282.
Kerner MJ, et al. 2005. Proteome-wide analysis of chaperonin-dependent protein folding inEscherichia coli.Cell 122:209–220.
Kim YE, Hipp MS, Bracher A, Hayer-Hartl M, Hartl FU. 2013. Molecular chaperone functions in protein folding and proteostasis. Annu Rev Biochem. 82:323–355.
Lachowiec J, et al. 2013. The protein chaperone HSP90 can facilitate the divergence of gene duplicates. Genetics 193:1269–1277.
Langmead B, Salzberg SL. 2012. Fast gapped-read alignment with Bowtie 2. Nat Methods 9:357–359.
Maisnier-Patin S, et al. 2005. Genomic buffering mitigates the effects of deleterious mutations in bacteria. Nat Genet. 37: 1376–1379. Masel J, Siegal ML. 2009. Robustness: mechanisms and consequences.
Trends Genet. 25:395–403.
Nishihara K, Kanemori M, Kitagawa M, Yanagi H, Yura T. 1998. Chaperone coexpression plasmids: differential and synergistic roles of DnaK-DnaJ-GrpE and GroEL-GroES in assisting folding of an aller-gen of Japanese cedar pollen, Cryj2, inEscherichia coli.Appl Environ Microbiol. 64:1694–1699.
Pa´l C, Papp B, Hurst LD. 2001. Highly expressed genes in yeast evolve slowly. Genetics 158:927–931.
Pechmann S, Frydman J. 2014. Interplay between chaperones and protein disorder promotes the evolution of protein networks. PLoS Comput Biol. 10:e1003674.
Pedersen KS, Kristensen TN, Loeschcke V. 2005. Effects of inbreeding and rate of inbreeding inDrosophila melanogaster– Hsp70 expression and fitness. J Evol Biol. 18:756–762.
Powers ET, Balch WE. 2013. Diversity in the origins of proteostasis net-works – a driver for protein function in evolution. Nat Rev Mol Cell Biol. 14:237–248.
Queitsch C, Sangster T. a, Lindquist S. 2002. Hsp90 as a capacitor of phenotypic variation. Nature 417:618–624.
R Development Core Team. 2016. R: a language and environment for statistical computing. Vienna, Austria: R foundation for statistical computing.
Rajagopala SV, et al. 2014. The binary protein-protein interaction land-scape ofEscherichia coli.Nat Biotechnol. 32:285–290.
Rice P, Longden I, Bleasby A. 2000. EMBOSS: the european molecular biology open software suite. Trends Genet. 16:276–277.
Rohner N, et al. 2013. Cryptic variation in morphological evolution: HSP90 as a capacitor for loss of eyes in cavefish. Science 342: 1372–1375.
Rudan M, Schneider D, Warnecke T, Krisko A. 2015. RNA chaperones buffer deleterious mutations inE. coli.Elife 4:1–16.
Rutherford SL. 2003. Between genotype and phenotype: protein chaper-ones and evolvability. Nat Rev Genet. 4:263–274.
Rutherford SL, Lindquist S. 1998. Hsp90 as a capacitor for morphological evolution. Nature 396:336–342.
Sabater-Mun˜oz B, et al. 2015. Fitness trade-offs determine the role of the molecular chaperonin GroEL in buffering mutations. Mol Biol Evol. 32:2681–2693.
Schneider C. a, Rasband WS, Eliceiri KW. 2012. NIH Image to ImageJ: 25 years of image analysis. Nat Methods 9:671–675.
Straus D, Walter W Gross C., a 1990. DnaK, DnaJ, and GrpE heat shock proteins negatively regulate heat shock gene expression by controlling the synthesis and stability of sigma 32. Genes Dev. 4:2202–2209.
Suyama M, Torrents D, Bork P. 2006. PAL2NAL: robust conversion of protein sequence alignments into the corresponding codon align-ments. Nucleic Acids Res. 34:W609–W612.
Tatusov RL, Koonin E, Lipman DJ. 1997. A genomic perspective on protein families. Science 278:631–637.
Tokuriki N, Stricher F, Serrano L, Tawfik DS. 2008. How protein stability and new functions trade off. PLoS Comput Biol. 4:e1000002. Tokuriki N, Tawfik DS. 2009. Chaperonin overexpression promotes genetic
variation and enzyme evolution. Nature 459:668–673.
Turrientes M-C, et al. 2013. Normal mutation rate variants arise in a mutator (Mut S)Escherichia colipopulation. PLoS One 8:e72963. Wagner A. 2005. Robustness and evolvability in living systems. Princeton
(NJ): Princeton University Press.
Warnecke T. 2012. Loss of the DnaK-DnaJ-GrpE chaperone system among the Aquificales. Mol Biol Evol. 29:3485–3495.
Warnecke T, Hurst LD. 2010. GroEL dependency affects codon usage– support for a critical role of misfolding in gene evolution. Mol Syst Biol. 6:340.
Williams TA, Fares MA. 2010. The effect of chaperonin buffering on pro-tein evolution. Genome Biol Evol. 2:609–619.
Wyganowski KT, Kaltenbach M, Tokuriki N. 2013. GroEL/ES buffering and compensatory mutations promote protein evolution by stabilizing fold-ing intermediates. J Mol Biol. 425:3403–3414.
Yang Z. 2007. PAML 4: phylogenetic analysis by maximum likelihood. Mol Biol Evol. 24:1586–1591.
Young JC, Agashe VR, Siegers K, Hartl FU. 2004. Pathways of chaperone-mediated protein folding in the cytosol. Nat Rev Mol Cell Biol. 5:781–791.
Zhang J, Yang J-R. 2015. Determinants of the rate of protein sequence evolution. Nat Rev Genet. 16:409–420.
Associate editor:Bill Martin