ABSTRACT
Piezoelectric principles are widely used to harvest energy in the process of vibrating piezoelectric mass. Different design configurations were studied in the research papers listed. A novel dynamic method of Lead Zirconate Titanate Sensor (PZT) to obtain d33 suitable for the MEMS applications is designed, simulated and analysed results were compared with the fabricated sensor. The Lead Zirconate Titanate Square Plate (PZTSP) fixed at the bottom, which is acted upon by the application of pressure to validate direct piezoelectric effect. This model develops piezoelectric voltage in dynamic mode by suitably opening and closing the pressure inlet optimized time constant for one second. A prototype model is validated, which can be used for the pressure sensing and indicating applications.
General Terms
Microelectromechanical Systems
Keywords
NANO, Piezoelectric, Sensor, PZTSP, MEMS, PZT
1.
INTRODUCTION
Design and development of piezoelectric material sensors are posed to imply high temperature and high power applications. Barium Titanate and Lead Zirconate Titanate are widely used as the piezoelectric material. Piezoelectric material common applications are Power generators, pulse generators and actuators. In this paper software design, 3-D modeling and simulation were carried out for a tiny PZTSP of thickness 0.5mm, to analyze the prototype model. The findings of last two decades are taken as guidance to focus on principle of unique modeling. Simulation and principle of dynamic analysis by vibrating the PZT device were used for the application of power generation as mentioned by various authors.
Erdem et al. [1] used thermally actuated omni directional propelled actuator arrays in the application of walking micro robot. Characterization of piezoelectric validated d33 mode modeling and energy harvesting well explained by Park et al. [2]. Bi-morph and triple-morph thick film PMN-PZT for an electric cantilever proving the concept of electric harvesting devices micro power generator was analyzed and compared by Kim et al.[3] and dynamic characteristics to optimize the device response time developed by Jian-Hui et al.[4]. Howells presented the application of piezoelectric elements to convert mechanical motion into electrical power, from the heel of a
Energy harvesting optimization of piezoelectric power generation devices model using Topology derivative, MEMS-based thick-film piezoelectric cantilevers, frequency improvement in designing flexibility of 1μW ASIC and standalone systems were compared between several vibration-powered piezoelectric generators by Zheng et al., Liua et al., Marzencki et al. and Lefeuvre et al.[6-9] respectively. Chen et al. proposed an analytical modeling of vibration-induced piezoelectric cantilever bimorph micro power generator [10].
Jeon et al. [11] validated a model using thin film PZT transducer capable of generating 20 times higher voltage of d33 mode than that of the d31 mode. Piezoelectric transformer model was characterized for the design parameters by Seo et al. [12]. Chen et al. evaluated the concept of continuous high driving power of piezoelectric material and the effect of temperature change [13]. Keawboonchuay proposed a design, modeling, and implementation of a 30-kW piezoelectric pulse generator [14]. A novel thick-film piezoelectric micro generator, using screen printed piezoelectric material was evaluated by White et al. [15].
The application of dynamic vibration absorbers, multi-frequency harmonic excitations and the usage of the anti-resonance mode rather than the conventional anti-resonance mode and the measurement of losses in piezoelectric model have been studied by Sun et al. [16]. Loss Mechanisms using anti-resonance mode rather than the conventional anti-resonance mode was analyzed by Uchino [17]. Algureo has studied the degradation of d33 piezoelectric coefficient of PZT ceramics subjected to compressive stress along the poling direction [18]. Characterization of piezoelectric d33 mode piezoelectric MEMS energy harvester was analyzed by Park with the introduction of seed layer thin film of PbTiO3 in between ZrO2 and PZT to improve the piezoelectric property [19]. Berlin Court [20] discussed about the various ceramics properties and compared their characteristic features. The procedure for designing ultrasonic probe element for piezoceramic transducer for the measurement of electrical impedance and loss has been studied in detail by Fattah [21]. The Finite-element method to optimize the deflection of a single piezoelectric circular bimorph actuator was studied by Morris [22].
Design and Modeling of MEMS based Nano Displacement
PZT Sensing Element
P.A. Manoharan
DRDO, Combat Vehicles
Research & Development Estt.
Chennai, Tamil Nadu, India
D. Nedumaran
Central Instrumentation & Service Lab,
University of Madras, Guindy,
2. ANALYTICAL METHOD
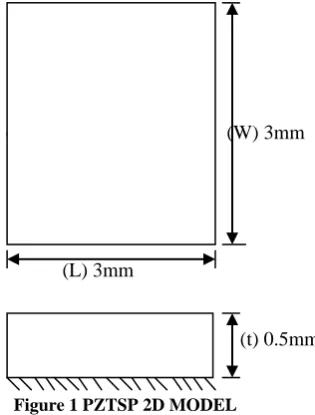
In the present study, design and simulation of PZTSP‟s dynamic mode 2D model is shown in figure 1. The system requires the response time of 1 second. Hardware setup of pressure inlet to act a pneumatic valve opening and closing with a time delay of 1 Hz to capture and display the charge accumulated. The system and the device response were the criteria to select the pressure inlet valve to open and close.
Piezoelectric sensor generates analog voltage in response to the applied pressure. The application of mechanical stress to piezoelectric material will results in development of an electric field is called Direct Piezoelectric Effect. To focus on dynamic analysis assuming that (a). direct piezoelectric effect is linear, (b). the weak hysteresis effect is ignored, (c). the influence of temperature is neglected and (d). the energy release is provided in the whole PZTSP model. The average energy in a representative volume element will be the functions of macroscopic electromechanical fields and actuating internal fields.
An-isotropic piezoelectric material properties of piezoelectric charge constants dij and elastic stiffness cij in finite element analysis matrix form are given equations (1) and (2).
15
15
31 31 33
0 0 0 0 0
0 0 0 0 0 /
0 0 0
d
d d C N
d d d
(1)
11 12 13
12 22 13
13 13 33
44
55
66
( )
0 0 0
0 0 0
0 0 0
0 0 0 0 0
0 0 0 0 0
0 0 0 0 0
E
Pascals
c c c c c c c c c c c c c
(2)
The shear stress acting on the model c55 and c66 computed using the matrix equation (3).
11 12 13
12 22 13
13 13 33
44
44
11 12
0 0 0
0 0 0
0 0 0
0 0 0 0 0
0 0 0 0 0
0 0 0 0 0 2( )
E
c c c
c c c
c c c
c c c c c
(3)
Piezoelectric charge constants in terms of axis direction (d33) to represent the displacement. The first subscript 3 represents the poling direction and the second subscript 3 the stress or mechanical deformation in the Z-axis. The piezoelectric matrix can also be given as a piezoelectric strain matrix „d’, converted to the piezoelectric stress matrix „e’ using the elasticity(stiffness) matrix „c’ as represented in equation(4).
e = c dT (4)
Where
31 31 33 15 15 0 0 0 0 0 0 / 0 0 0 0
0 0 0
T
d d d
d C N
d d
(5)
The Piezoelectric stress matrix „e‟ is given in equation (6)
11 31 12 31 13 33
12 31 11 31 13 33
13 31 13 31 13 33
44 15 44 15
0
0
0
0
0
0
0
0
0
0
0
0
0
c d
c d
c d
c d
c d
c d
c d
c d
c d
e
c d
c d
(6)
3.
M
ODEL MATERIAL AND ITS PROPERTYPiezoelectric material falls in the category of PZT-5H, square plate of 3mm x 3mm having 0.5mm thickness was used for the analysis. The model was fixed at the bottom, pressure load of 0 to 5bar was applied on the top of the square plate. Model acts as the parallel plate capacitance, which in turn behaves and deploys the unique properties of PZT. The proposed model was analytically verified and the analytical results are compared with the simulated values. The designed model was in realistic with the fabricated device. The constitutive equation of the piezoelectricity involves combination of electrical and mechanical quantities. Approximation this interaction can be described by linear relations between two electrical and mechanical variables given in the equations (7) and (8) as referred in [20] pp. 339 - 380.
Table 1 PZTSP PROPERTIES
No Parameter Value
1 Piezoelectric Coupling Co-efficient: kp
k33
0.63 0.73 2 Piezoelectric Charge Constants:
d33 ( x 10-12 C/N) d31 ( x 10-12 C/N)
650 -285
3 Piezoelectric Voltage Constants: g33 ( x 10-3 V-m/N)
g31 ( x 10-3 V-m/N)
20 -9
4 Density, ρ(kg/m3) 7500
5 Mechanical Quality Factor, Qm 65
6 Elastic Constants, compliance short circuit: sE
11 ( x 10-12 m2/N) sE
33 ( x 10-12 m2/N)
15 21 7 Frequency Constant (Hz-m or kHz - mm)
Np (Planar Mode Disk) Nt (Thickness Mode Disk)
1950 2000
8 Relative permeability 1400
The following notations are used to quantify the piezoelectric parameters; s - Elastic compliance (m2N-1), c-elastic stiffness (Nm-2), ε0- Permittivity of free space (Fm-1), εr - relative permeability of PZT(Fm-1), d- piezoelectric- strain constant(CN-1 or mv-1), e - piezoelectric – stress constant(Cm -2
or NV-1m-1) and g-Piezoelectric voltage- strain constant(m2C-1 or VmN-1).
4.
A
NALYTICAL MODELThe analytical 2-D model of PZTSP is shown in the figure 1. The mechanical behaviour of the same medium at zero electric field strength is defined the stress (T) applied and the strain (s).
( (W) 3mm
(L) 3mm
[image:3.595.104.262.490.698.2](t) 0.5mm
Figure 1 PZTSP 2D MODEL
The elastic compliance of the short circuited piezoelectric elastic stiffness (N/m2) computed values are given in equation (9)
E
1.27205 8.0122 8.4670 0 0 0 8.0122 1.2720 8.4670 0 0 0 8.4670 8.4670 1.7143 0 0 0 11
c = X 10
0 0 0 2.2988 0 0
0 0 0 0 2.2988 0
0 0 0 0 0 2.3474
(N/m
2) (9)
Computed values of piezoelectric permittivity (F/m2) value at constant strain is given in the equation (10)
1704.4 0 0
0 1704.4 0
0 0 1433.6
S
x 10-12(Farads/m2) (10)
Piezoelectric dielectric to stress constant value at constant strain is given in equation (11).
0 0 6.6228
0 0 6.6228
0 0 23.2403
0 17.0345 0
17.0345 0 0
0 0 0
S e
(Coulomb/m2) (11)
The computed values of piezoelectric elastic compliance (m2/N) at constant stress, piezoelectric charge to strain constant (m/V or coulomb/N) and permittivity at constant stress are given in equations (12), (13) and (14) respectively.
11
1.65 0.478 0.845 0 0 0
0.478 1.65 0.845 0 0 0 0.845 0.845 2.07 0 0 0
10
0 0 0 4.35 0 0
0 0 0 0 4.35 0
0 0 0 0 0 4.26
E
s X
(12) 10
0 0 2.74
0 0 2.74
0 0 5.93
10 0 7.41 0
7.41 0 0
0 0 0
T
d X
C/N (13)
3130 0 0
0 3130 0
0 0 3400
T
X 0 (14)
Where as 0 = 8.854 x 10⁻¹² F/m
The direct piezoelectric voltage output is given by equations (15) and (16). The charge (Q) values and Electrical energy generated were calculated using equations (17) and (18).
33 3
g F T V
A
(15)
V g 33 P T 3 (16)
Q C V pz (17)
Power generated in Watts = (Energy generated) x (No of cycles). The representations F (force in Newton), (thickness of the PZTSP in meters), Q (the charge in coulomb), V (Voltage in volt) and Cpz (Capacitance of PZTSP) are the terms used for analytical calculations. The displacement of PSTSP d33 value accounted for the application of pressure in terms of piezoelectric voltage constant is given by the equation (19).
33 3 0 33
T
d
K
g
(19)
33 pz
W L
C e
t
(20)
Equation (20) represents piezoelectric capacitance Cpz in terms of piezoelectric stress/electric field at constant strain or charge density/strain at constant electric field (coulomb/meter). Displacement Δt in terms of elastic compliance at constant charge density (m2/Newton) is given by the equation (21).
33 3
D t
S T t
(21)
Total energy (WD) is the summation of mechanical deformation energy (Wm) and PZTSP‟s stored electrical energy (We). The derived equations in terms of strain constant are given by the equations (22)-(24). Switching of an elementary mono-domain postulated to whole crystallite and gets approximated for the application of pressure on the PZTSP sensor. Then the local energy release density is averaged over the surface of the polarized plates.
2 33 33 3
(1 )
2
D m
Vol
W k S T (22)
2 33 33 3 2
D e
Vol
W k S T (23)
33 3
2 D D
Vol
W S T (24)
33
D
s
- elastic compliance at constant charge density, Superscripts D denotes the (open circuit) parameters held constant, first subscripts represents open circuit compliance stress along the z axis , and the second subscript represents accompanying strain along z axis . The following notations used to quantify i.e. Δt – Piezoelectric displacement, T - Stress (Nm-2), S –Strain constant, E- Electric field strength (Vm-1).5.
S
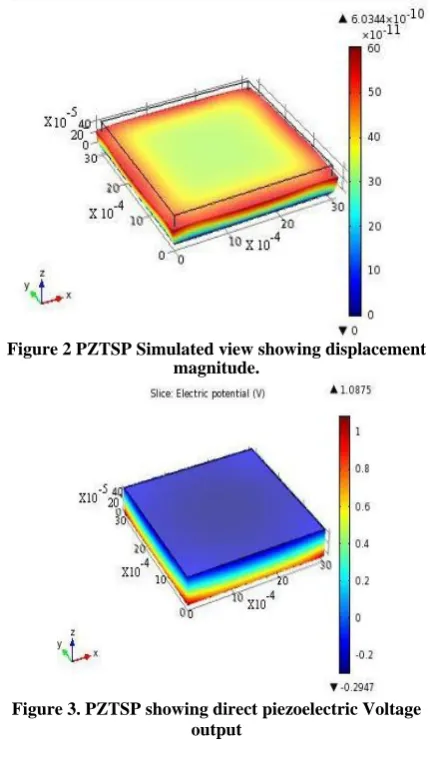
IMULATION [image:4.595.320.537.81.460.2]Comsol version 4.2.0.150 multi physics analysis. PARDISO solver, nested-dissection, multi-threaded pre-algorithm and physics-controlled mesh were used for this simulation. Displacement of 0.6344nm was obtained for the input pressure of 1bar is shown in figure 2.
Figure 2 PZTSP Simulated view showing displacement magnitude.
Figure 3. PZTSP showing direct piezoelectric Voltage output
[image:4.595.328.523.238.424.2]Software model shows the displacement simulation in figure 2 and figure 3. Static Analysis coupled electro-elastic equations of Ostergaard & Pawlak‟s is used. Inertial and damping effects are ignored except static acceleration effects such as gravity, displacements and electric potentials were obtained. Simulated value of 1.0875V for the pressure input of 1 bar is shown in figure 3. PZTSP was simulated to different loading conditions from 1 to 5 bar pressure, the values of displacement and the voltage output are shown in table 2.
TABLE 2 PZTSP SIMULATED OUTPUT VOLTAGE AND DISPLACEMENT
Sl. No.
Input Pressure P(kPa)
Displacement ΔZ(m)
Output Voltage(V)
1 100 6.0344 X 10⁻¹⁰ 1.0875
2 200 1.2069 X 10⁻⁹ 2.175
3 300 1.8103 X 10⁻⁹ 3.2625
4 400 2.414 X 10⁻⁹ 4.35
[image:4.595.319.538.592.762.2]6.
PZTSP FABRICATION AND TESTING
The processes involved in the preparation of PZT material are explained in steps a to c as outlined below as an Appendix. followed by the process of slicing to the required dimension, poling and testing followed in steps from d to h.Figure 4. PZTSP Fabricated Sensor model
[image:5.595.317.550.70.201.2]The device was suitably soldered as shown in figure 4 to obtain bonding and connectivity of populated conductive area. The finite square structures have to be truncated by suitable mounting so that the model region can be confined to a finite region and to cater the specified and desired mathematical boundary.
Figure 5. PZTSP Compression test to evaluate the piezoelectric displacement constant d33
The experimental setup shown in figure 5 has spring loaded mechanism calibrated to employ the stress over surface of the PZTSP, which in turn gives the displacement of direct piezoelectric output measured using multimeter. The experimental d33 set up shows the locking lever and screw type graduated scale to mark the desired pressure applicable for the model parameter testing.
Figure 6 Sensor test to evaluate the displacement and capacitance value during the vibration
[image:5.595.134.207.139.228.2]PZTSP dynamic analysis test setup in Figure 6 shows the measurement of capacitance (Cpz) and the displacement (d33) by vibrating the sensor samples at the rate of 50 Hz. The maximum device operating frequency becomes 20% of the resonance frequency.
Figure 7 PZTSP Sensor 3-D view to account the output termination.
[image:5.595.316.550.276.420.2]Figure 7&8 shows the sensor mounting to illustrate the layers and soldering termination, packaging of PZTSP, and a TO8 connector with end cap is laser welded.
Figure 8 packaging and end assembly of PZTSP and TO8 Connector
The failure analysis was carried out for one of the sample by cutting the sealed end, in which the soldered end was broken during package handling. TO8 connector was placed with a suitable layer of preformed fiber reinforced plastic (FRP) square plate of 6mm thickness using non-conductive super glue. PZTS is fixed over the FRP layer by non-conductive super glue as shown in figure 7. The curing temperature of around 40ºC for 12 hours. The polarized ends are terminated to the connector. The device is ruggedized and suitable for shock and vibration to the desired level.
[image:5.595.117.213.321.416.2] [image:5.595.82.254.530.649.2] [image:5.595.331.522.572.733.2]Figure 9 shows the block diagram of the test set up, which has a nitrogen cylinder attached with analog pressure gauges. The pressure valve to open and close for the periodic time interval of 1 second. A moisture filter was introduced to filter the moisture and dust and a control valve to sensor input and another control valve open the nitrogen gas to the atmosphere ensures the leakage of the test setup. The dynamic pressure of 1 bar to 5 bar was in steps of 1 bar was applied and the corresponding voltage output was measured.
7.
TEST SETUP
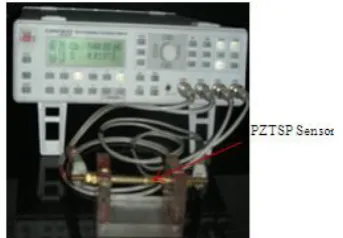
[image:6.595.94.240.241.404.2]The Direct piezoelectric effect of output voltage was tested and measured using WEISS Integrated pressure sensor programming and testing unit, model KWP-64 as shown in figure 10. The voltage output values are given in the table 3.
[image:6.595.54.277.476.653.2]Figure 10. The software programmable Pressure sensor test rig with test bed instrumentation
TABLE 3 PZTSP DEVICES PIEZOELECTRIC DIRECT OUTPUT
Sl. No Input Pressure
Output Voltage(V)
1 100 0.92822
2 200 1.97576
3 300 2.80042
4 400 3.47068
5 500 3.94252
The test set up has the automated pressure controller input unit, sensor mounts, temperature control chamber and provision for the measurement the output instrumentation as shown in figure 11.
Figure 11. PZTSP sensor assembly mounted on the test rig to evaluate piezoelectric voltage output
PZTSP was tested for the 0.5 M Pa input. The Output Voltage of 3.9425V was measured the device was manufactured on 28/5/11 and tested on 08/09/11. The characteristic of PZTSP linear output voltage 0 to 300 kPa was observed. The voltage output for the pressure input of 100 to 500 kPa is represented in table 3.
8.
RESULTS
The sensor output was analyzed and the output of 4.2V would have been the output as on 28/05/11. Since the device has the aging effect which is accounted for 0.176V. The aging effect is the inherent property of the PZT accounted as the post poled value.
A truth table was created and the results were matched with PZTSP post poling. The input pressure of 500 kPa gives the output voltage of 4.2V, 5.4375 and 5.0V for the actual, simulated and analytical models respectively as shown in figure 12. The model is validated and it is found that the actual PZTSP‟s output voltage is 16.00% lesser than the analytical model.
[image:6.595.327.531.558.724.2]The simulation model output voltage is 8.75% more than the analytical model. The designed sensor gives the desired output analytical values. It is possible to bring down the error of actual PZTSP by suitably mounting the device metallization 1hour at the temperature of 100°C with silver epoxy. Further, the simulation error can be reduced by suitably changing the mesh type and size.
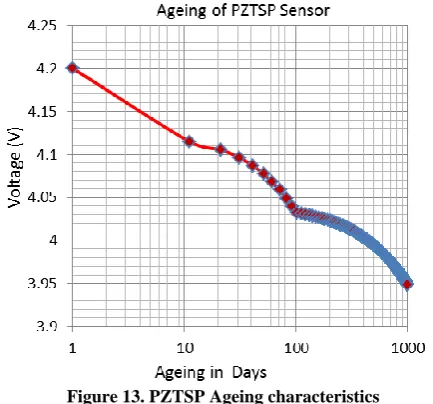
[image:7.595.55.272.186.388.2]Aging rate in hour decade is shown as the graph in figure 13. The measured value of 3.9425V is well agreed with ageing rate of PZTSP specified.
Figure 13. PZTSP Ageing characteristics
The desired performance of the PZTSP sensor adheres the designed direct piezoelectric voltage values to the closer extent. As compared to other existing models of energy harvesting using vibration principle as cited in [20], dynamic analysis of a single cantilever structure with a silicon inertial mass from a vibration with an acceleration of 0.39g at its resonant frequency of 528 Hz. for the volume of the 1 × 0.8 × 0.010 mm3,delivers the AC voltage of 2.43V. This simple model gives the DC output of 4.2V for the volume of 3 x 3 x 0.5 mm3 at the device actuating frequency of 1 Hz. It works in the dynamic mode, which doesn‟t require any vibrating mechanism to deduce the energy free from creep and easy to fabricate being a single sensing element.
9. CONCLUSION
(a) ApplicationsThis proto type model is suitable for the MEMS based sensor applications. This PZTSP device can be directly applied to a tiny portable digital pressure indicator. This can also be used as the SMART energy scavenger by tapping source of energy from the stored point in a closed loop system of the compressor unit without energy loss.
(b) Novelty and Design Implications
According to the previous reports, the piezoelectric models are being used for the conversion of electrical energy by vibrating the cantilever beam or fixing over the vibrating element. In the present dynamic model, the device is in static position and the input pressure is regulated to obtain a displacement of 0.6344 nm for the pressure input of 1 bar. This PZTSP model is ruggedized, stress free and increases the sensor life. This method is very easy to fabricate, requires only capturing charge during dynamic mode for the time
EMI compared to non PZT sensing element models used for energy harvesting.
(c) Future Implementation and Approach
Dynamic mode bottom fixed modeling can be implied instead of cantilever modeling for energy harvesting. PZTSP is suitable for smart sensor, MEMS, self powering of the Robotic Arm and Bio-medical sensing applications. Robotic Arm Future development work requires a sensitive charge amplifier interface to PZTSP sensor.
APPENDIX
PZTSP fabrication procedure:
(a) Binder mixing: The appropriate amount of chemical grade raw materials of Pb304, ZrO2, TiO2, SrCO3 and Nb2O5 were weighed, compounded and mixed with de-ionized water in wet ball milling together to form an injection mould feedstock i. The raw materials were mixed using biding solution in the proper stoichiometric ratio. ii. The mixture of raw materials was poured in to the ball mill for 96 hours hard pellets were grounded and the paste form of PZT was obtained. iii. PZT in paste form collected and centrifuged to collect the PZT powder. iv. The product was dried to 150°C for 12 hours. v. The PZT powder was put into the Jar mill for dry grinding for 3 hours to get the soft powder.
(b) Calcination: i. Calcination process was carried out at 1060°C for 4 hours and then the dried samples were hand hammered to get powder form. ii. Dry grinding was carried out by Jar mill to collect soft media. iii. Media, powdered mixed with water and heated for 15-20 hours at 150°C for 12 hours, the particle size of 0.9 micron was checked. iv. Granulation in two stages were carried out for the required size 36/60/85µm. v. The powder was heated at 800°C for 2.5 hours in the ceramic cups.
(c) Mixing: The sample with binder solution was mixed, solution was added with hot water, PVA & 6% binder solution and binder to powder in the ratio of 1:10 was mixed. The sewing operation was carried out to get the fine powder.
(d) Molding: The sewed material for the required shape by compression process using model pattern and the product was obtained.
(e) Binder Burnout: Pre heating the mold for 2 hours at 150°C and to remove the binder from the preheated mold product was further kept for 4 hours at 800°C.
(f) Sintering: A high temperature sintering process was used to densify the ceramic i. the product was passed on to sintering furnace for 4 hours at 1300°C and thus the volume reduces to grain size of 38µm.ii. Lapping with powder and water, the required size and thickness was obtained. iii. Inspection of dimensional tolerance. iv. Cleaning with hot water and ultrasonic cleaning with cold water. v. The final product of PZTSP of 3mm x3mm x 0.5mm (thickness) obtained.
field. PZTSP poled with polarity terminated is shown in the fig. 4. which has the positive electrode on top and the negative end termination at the bottom from the same axis point.
(h) Testing: The testing of samples were carried out. The termination of polarity was made and the final product of sensor was obtained. This model has the charge collected through the silver electrode quoted over the PZTSP for the thickness of 0.5µm. The positive and negative electrode acts as the representative nodes to collect the charge during the application of pressure on the PZTSP. The most difficult aspect of this model is to mount sensor over the FRP layer in the Z-axis plane. Since it has the soldered end termination accounts the depth of approximately 3mm.
10. ACKNOWLEDGMENTS
The authors are very grateful to the great persons for the moral support, guidance and their facility to complete this work viz. i. S S Dhamy, MD, Sparkler ceramics PVT. Ltd., Pune for fabrication support, ii. DR. K Natarajan, Head (MEMS), BEL, Bangalore Packaging and test facility, iii) Dr K Vijayaraju, PD (NP-MASS), Bangalore, software utilization and iv. Dr. Enakshi Bhattacharya Professor and Head (Micro Electronics and MEMS Lab), IITM, testing and library facilities.
11. REFERENCES
[1] Erdem E. Y , Chen Y , Mohebbi M , Suh J.W, Gregory T. A. Kovacs, B Darling., and Bohringer K. F., “Thermally Actuated Omni directional Walking Microrobot”, JMEMS, Vol. 19, pp 433-442, 2010. [2] Park J. C, Park J. Y, and Lee Y , “Modeling and
Characterization of Piezoelectric d33-Mode MEMS Energy Harvester”, JMEMS, Vol. 19, pp 1215-1222, 2010.
[3] Kim I, H Joo, Jeong S, Kim M. Song and J., “Micro Power Generation of a PMN-PZT Triple-morph Cantilever for Electric Harvesting Devices”, J Korean Phy Soc, Vol. 56, pp 370-373, 2010.
[4] Jian-Hui L, Xiao-Ming W, Hao C, Xi .L, R. Tian-Ling and Li-Tiana L, “Analyses of vibration-based piezoelectric power generator in discontinuous operation mode”, Sensor Actuat A-Phys, 152, pp 48–52, 2009.
[5] Howells C. A, “Piezoelectric energy harvesting”, Energ Conver Manage,50, pp 1847–1850, 2009.
[6] Zheng B, Chang C and Gea H. C , “Topology optimization of energy harvesting devices using piezoelectric materials” Struct Multidisc Optim, 38, pp 17–23, 2009.
[7] Liu J, Fang H, Xu Z, Mao X, Shen X, Chen D, Liao H and Cai B, “A MEMS-based piezoelectric power generator array for vibration energy harvesting”, Microelectr J, 39, pp 802–806, 2008.
[8] Marzencki M, Ammar Y and Basrou S, “Design, fabrication and characterization of a piezoelectric microbgenerator including a power management circuit”,
DTIPof MEMS and MOEMS, pp 25-27, 2007.
[9] Lefeuvre E, Badel A, Richard C, Petit L and Guyomar D, “A comparison between several vibration-powered piezoelectric generators for standalone systems”, Sensor Actuat A-Phys, 126, pp 405 – 416, 2006.
[10] Chen S, Wang G and Chien M, “Analytical modeling of piezoelectric vibration-induced micro power generator”, Mechatronics 16, 379–387, 2006.
[11] Jeon Y.B, Sood R, Jeongc J. h and Kim S.G, “MEMS
power generator with transverse mode thin film PZT”, Sensor Actuat A-Phys, 122, pp 16–22, 2005.
[12] Seo J, H Joo , Jung H , “Optimal design of piezoelectric transformer for high efficiency and high power density”, Sensor Actuat A-Phys, 121, pp 520–526, 2005.
[13] Chen W.P, Chong C.P , Chan H.L.W, Liu P.C.K, “Degradation in lead zirconate titanate piezoelectric ceramics by high power resonant driving”, Mater Sci Eng, B99, pp 203-/206, 2003.
[14] Keawboonchuay C and Engel T. G, “Design, Modeling, and Implementation of a 30-kW Piezoelectric Pulse Generator”, IEEE transactions on Plasma science, Vol. 30, pp 679-686, 2002.
[15] White N. M, Glynne-Jones P.and Beeby S. P “A novel thick-film piezoelectric micro-generator”, Smart Mater. Struct. 10, pp 850–852, 2001.
[16] Sun H.L, Zhang P.Q, Chen H.B, Zhang K and Gong X.L, “Application of dynamic vibration absorbers in structural vibration control under multi-frequency harmonic excitations”, Appl Acoust 69, pp 1361–136, 2008.
[17] Uchino Kand Hirose S “Loss mechanism in piezoelectric: How to measure the different losses separately”, IEEE transactions on Ultrasonics, electrics and frequency control, Vol 48, pp 307-319, 2001. [18] Alguero M, Cheng B.L, Guiu F, Reece M.J, Poole M
and Alford N, “Degradation of the d33 piezoelectric coefficient for PZT Ceramics under static compressive loading”, Journal of the European ceramic society 21, pp 1437-1440, 2001.
[19] Park J. C, Park J. Y and Lee Y “Modeling and Characterization of Piezoelectric d33-Mode MEMS Energy Harvester”, JMEMS, VOL. 19, pp 1215 – 1222, 2010.
[20] Berlincourt D, Krueger H.H.A and Near C, “Properties of piezoelectric ceramics”, Morgan electro ceramics Technical publication, TP-226, pp 1-11, 2010.
[21] Fattah A. M. A, Ali M.G.S, ELsyed N. Z and Ali,G. A “Piezoceramic Materials for Ultrasonic Probes”, J. Solids, Vol. 28, pp 295-313, 2005.
[22] Morris C. J and Forster F. K “ Optimization of a circular piezoelectric bimorph for a micro pump driver” J. Micromech. Microeng, Vol. 10, pp 459-65, 2000. [23] Moulson A J and Herbert J M, “Electro ceramics -
Materials, properties Applications”, Book published by John Wiley & Sons Ltd., chapter 6, pp 339-410, 2003. [24] Engineering Fundamentals, web “Piezoelectricity: