Combined Electromechanical Analysis for a Very-Low-Frequency
Complex Structure T-Type Transmitting Antenna
Yalong Yan, Chao Liu*, Yinghui Dong, and Huaning Wu
Abstract—A combined analysis method for determining the structural and electrical performance of very-low-frequency (VLF) T-type transmitting antennas with a complex structure is proposed. By using the finite element method for analyzing the antenna’s structural performance and the moment method for determining the antenna’s electrical performance, the structural entity model of the antenna is transformed into an electrical model by extracting the position and displacement information of the antenna curtain, thereby determining the electrical performance index of the transmitting antenna. An actual VLF T-type transmitting antenna is analyzed using this method. A comparison between the calculated results and measured data shows that this method is effective and feasible. In addition, by optimizing the sag of the antenna’s curtain, it is demonstrated that the radiation efficiency of the transmitting antenna can be further improved using this method, and the radiation patterns of the initial state and optimized antenna stay almost the same. This method provides guidance for the synthesis design of other VLF transmitting antennas with complex structures.
1. INTRODUCTION
Very-low-frequency (VLF) radio waves are the main type of submarine communication and possess the characteristics of stable propagation and strong penetration of sea water. The transmitting antennas used for transmitting VLF radio waves are large and complex. When these types of antennas were designed in the past, the mechanical structure design and electromagnetic design were conducted separately. The mechanical structure design engineers might ignore the electrical properties of the antenna to meet the stiffness requirements of the antenna, and the electrical design engineers might ignore the construction cost and safety requirements to improve the antenna’s electrical performance [1]. As our understanding of the structural and electrical characteristic of the antenna has been improved, antenna designers began to analyze and design antennas by incorporating the structural and electrical properties of antennas. The main areas of interest at present include large reflector antennas [2, 3], large deployable astromesh antennas [4], ring truss deployable antennas [5], etc., and recent research has mainly focused on the influence of the antenna surface [6], structural errors [7, 8], structural form [9], and other factors on the electrical performance of the antenna. However, there are few combined electromechanical analysis studies on VLF T-type transmitting antennas.
To improve the electrical performance of T-type transmitting antennas, a common approach is the addition of one or several symmetrical or asymmetrical, horizontal, and terminal open-top capacitance wires (antenna curtain) on the top of the vertical antenna array, which improves the antenna’s radiation efficiency [10]. The radiation efficiency of an antenna changes with the change in the sag of the antenna curtain. A common approach for the design of VLF T-type transmitting antenna curtains consists of analyzing only the antenna’s electrical performance by changing the length or number of the top capacitance wires using electromagnetic analysis software [11–13]. The relationship between the sag
Received 21 October 2017, Accepted 23 November 2017, Scheduled 7 December 2017 * Corresponding author: Chao Liu ([email protected]).
and the radiation efficiency of the antenna has not been investigated systematically while taking into account the material strength and safety.
In this study, we propose a finite element structural model of a VLF T-type transmitting antenna first. The antenna curtain is optimized to develop a new antenna model, and using a new method, the entity model of the antenna curtain is imported into the electromagnetic analysis software FEKO. Subsequently, the electrical performance parameters are calculated and compared with the measured data to verify the effectiveness of the proposed analysis method.
2. COMBINED ELECTROMECHANICAL ANALYSIS METHOD
The structural model of the antenna is developed and analyzed using the finite element analysis software ANSYS, which provides the displacement relationship formula between any point and node points in the model. The matrix form of the displacement array of any point in the model is [14]:
{f}= [N]{δe} (1) where{δe}is the node displacement array of the model, and [N] is the shape function matrix, which is a function of the position coordinate.
From the shape function matrix, the strain array of any point in the model is:
{ε}= [B]{δe} (2) where [B] is the strain matrix of the model.
From the constitutive Equation (2), the stress array at any point in the model is:
{σ}= [D] [B]{δe} (3) where [D] is the elastic matrix, which is related to the model materials.
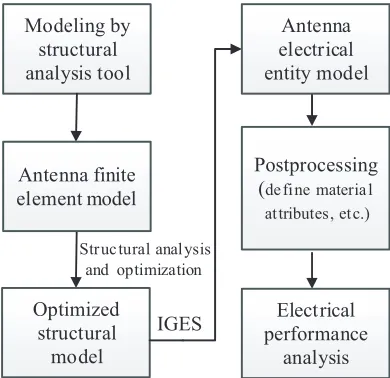
Based on Equations (2) and (3), a force analysis of the established model can be conducted, and the position information of each node can be obtained based on Equation (1) after the model is subjected to its own weight. After the structural model of the antenna has been developed, the ANSYS parametric design language (APDL) is used to optimize the specific indices of the model. After the optimization model has been generated, the correspondence and locations of the nodes in the model can be derived and converted into an initial graphics exchange specification (IGES) format. This format can be read by the FEKO software, which is based on the moment method and the electrical model of the antenna can be developed in FEKO. Note that the format of the model that FEKO can read is the entity model of the antenna; the mesh information and material properties are not included in the structural
Modeling by structural analysis tool
Optimized structural model Antenna finite element model
Postprocessing (de fi ne materia l at tributes, et c.)
Electrical performance
analysis Antenna electrical entity model
IGES Str uc tural anal ysis
and optimization
entity model and, therefore, the material attributes, feed measures, and mesh generation have to be reconfigured in FEKO. The flowchart of the combined electrical and structural analysis method of the VLF T-type transmitting antenna is shown in Figure 1. Compared with the traditional method of compiling the data structure of heterogeneous systems in order to import the antenna’s structural model into FEKO or HFSS software, the proposed method does not have to take the mesh mismatch problem into account [15, 16], which is more convenient.
3. ANTENNA STRUCTURAL AND ELECTRICAL MODELING METHOD
3.1. Antenna Structural Modeling and Optimization
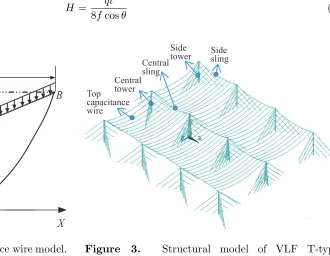
The VLF T-type transmitting antenna investigated in this paper consists of an antenna curtain, side towers, and center towers. The antenna curtain is composed of top capacitance wires and slings of a multi-suspension structure, and the uniformly distributed load on the top capacitance wire is divided into two forms: (1) uniform distribution along the chord of the cable curve, where the shape of the cable is a parabola; (2) uniform distribution along the arc of the cable curve, where the shape of the cable is a catenary, such as the shape of the cable under its own weight. Theoretical analyses have shown that the smaller the sag of the cable is, the smaller the difference between the parabola and the catenary is. When the load is uniformly distributed along the chord wire, the error between the parabola and catenary equations is less than 2% [17]. Although the catenary equation is more accurate for modeling the top capacitance wire, the calculation process is quite complex; therefore, the parabolic equation is used to numerically model the structure of the antenna curtain and its shape is similar to a catenary. A model of the single top capacitance wire is shown in Figure 2.
When the load (own weight) is uniformly distributed along the chord of the curve, the curve equation for the initial state of the top capacitance wire is [18]:
y= 4f x(l−x)
l2 +
h
lx (4)
wheref is the sag of the top capacitance wire,lthe span length of the top capacitance wire, andh the elevation difference at the two ends of the top capacitance wire.
The horizontal tension of the top capacitance wire is as follows:
H = ql
8fcosθ (5)
l
X Y
A
B
O h
f q
θ
Figure 2. Single top capacitance wire model.
Top capacitance wire
Central tower
Central sling
Side
tower Sidesling
whereqrepresents the load applied to the top capacitance wire, andθis the angle between the horizontal direction and the two ends of the top capacitance wire.
The approximate length of the cable is:
S =l
1 +1 2 h l 2 +8 3 f l 2 (6)
The approximately maximum tension of the cable is:
T =H
1 + 16f
2
l2 +
h2
l2 +
8f h
l2 (7)
After setting up the single capacitance wire model, the antenna curtain can be composed of multiple top capacitance wires to enhance the radiation capability of the antenna. During the modeling process, the material, the elastic modulus, the linear expansion of the sling and the top capacitance wire are set up first; because the cable unit can only sustain tension, the Link 10 element in ANSYS is used to simulate the cable element [19]. Because of the large size of the tower structure and the antenna curtain, separate models are developed and subsequently, the final model is developed by combining the separate models. The structure of the antenna curtain is modeled by defining the node-generating unit. The final finite element model of the antenna is shown in Figure 3. After the model has been developed, the sag of the antenna curtain has to be optimized to improve the radiation efficiency of the antenna on the premise of ensuring safety.
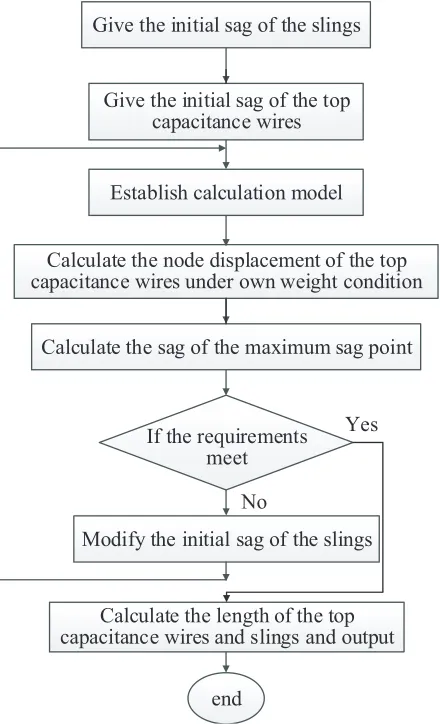
The optimization procedure for determining the shape of the antenna curtain is shown in Figure 4. The optimization program in ANSYS uses its own database and the main contents are as follows:
- Design variables (DV), control variables (SV), and objective functions (OBJ)
- Analysis file name, optimization and control method, number of iterations and completion date, etc.
The maximum sag point of the top capacitance wires should be determined on the same plane when the sag of the wire is optimized. The purpose is to ensure the synchronous movement of the wires to avoid collisions under windy conditions. A zero-order optimization algorithm in ANSYS is used to optimize the sag of the top capacitance wires, which provides the optimal wire length combination. Note that when a zero optimization algorithm is used, the objective function is automatically set to ensure that the parameters are minimized.
Prior to the optimization analysis, the safety factors of the top capacitance wires and slings must be considered. The formula for calculating the maximum tension at the lowest point of the sag between the wires and the earth wires of the antenna curtain is as follows [20]:
Tmax≤ Tp
Kc (8)
whereTp is the maximum breaking force between the wires and the earth wires, andKc is the designed safety factor of the wires. The safety factor of the antenna should be no less than 2.5 [17]. Because the antenna consists of flexible cables, the stress relaxation of the antenna should be considered; the safety factor is multiplied by a reduction factor of 0.95. According to the material characteristics of the top capacitance wire and sling, the maximum breaking force is 137.5 kN and 1181 kN respectively; according to Equation (8), the maximum tension of the top capacitance wire and sling at the lowest point of the sag should be less than 57.89 kN and 497.26 kN, respectively.
Considering the above factors and taking into account the length of the top capacitance wires and the slings of the antenna curtain as design variables, the relationship between the maximum tension and the sag as the control variable and the sag of the top capacitance wires or the sling as the objective function, the following optimized model is established:
DV S (9)
SV1 T =h
1 + 16f
2
l2 +
h2
l2 +
8f h
l2 <57.89 kN (10)
SV2 T =h
1 + 16f
2
l2 +
h2
l2 +
8f h
Give the initial sag of the slings
Give the initial sag of the top capacitance wires
Establish calculation model
Calculate the node displacement of the top capacitance wires under own weight condition
Calculate the sag of the maximum sag point
Modify the initial sag of the slings
Calculate the length of the top capacitance wires and slings and output
end
If the requirements meet
Yes
No
Figure 4. Flowchart for determining the shape of the antenna curtain.
OBJ f =
3
8(S∗l−0.5h
2−l2) (12)
where
S — length of the top capacitance wire or sling (m);
T — approximate maximum tension of the top capacitance wire or sling (N);
h — elevation difference between the two ends of the top capacitance wire or sling (m); f — sag of the top capacitance wire or sling (m);
l— span of the top capacitance wire or sling (m).
The length of the top capacitance wire or sling can be calculated by the optimization model for minimum sag; thus a theoretical antenna state with the highest radiation efficiency can be obtained. The basic antenna curtain model for electrical analysis can be obtained as a result.
3.2. Antenna Electrical Modeling
2S
a
Insulator
Sling
High voltage feed line
Transmitter
Down lead line Top capacitance
wire
Figure 5. Electrical performance model of a single antenna curtain.
Figure 6. Projection of the T-type single antenna curtain.
of multiple groups of single antenna curtains. The insulators are replaced by disconnecting the wires between the groups of the antenna curtains.
The grounding grid used to reduce the loss resistance of the antenna is buried deeply and has a radial structure. It diverges to the periphery with the feeding point of the intermediate antenna curtain as the starting point. Due to the long wavelength of the VLF band, the mesh length of the antenna should not be too short; therefore, the segment size is set to no less than 0.001λ.
4. EXAMPLE OF COMBINED ANALYSIS OF ANTENNA PERFORMANCE
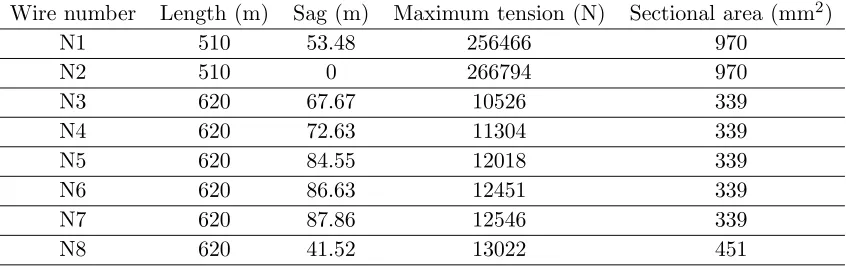
Using a complex structure VLF T-type transmitting antenna as an example, the structure of a single antenna curtain is shown in Figure 6, which consists of 11 top capacitance wires and 3 slings. N1 is the central sling, N2 represents the side slings, N3–N7 are the central top capacitance wires of the antenna curtain, and N8 represent the side top capacitance wires of the antenna curtain; the spacing of the top capacitance wire is 50 meters. The T-type antenna curtain consists of three single groups of curtains of the same size, which are supported by 12 masts. The material of the sling and top capacitance wires consists of aluminum clad steel strands with an elastic modulus of 78.9 GPa and a linear expansion coefficient of 2.02e-5 (1/K) [20]. The parameters of the slings and top capacitance wires in the initial state are derived by calculating the force of the designed antenna array and are shown in Table 1.
Using the minimum sag of the antenna curtain as the optimization target, the length and sag optimization results of the slings and top capacitance wires are obtained after optimization and iteration.
Table 1. The parameters of the sling and top capacitance wire in the initial state.
Wire number Length (m) Sag (m) Maximum tension (N) Sectional area (mm2)
N1 510 53.48 256466 970
N2 510 0 266794 970
N3 620 67.67 10526 339
N4 620 72.63 11304 339
N5 620 84.55 12018 339
N6 620 86.63 12451 339
N7 620 87.86 12546 339
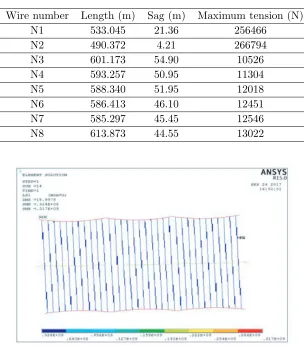
Table 2. The parameters of the sling and top capacitance wire after optimization.
Wire number Length (m) Sag (m) Maximum tension (N) N1 533.045 21.36 256466
N2 490.372 4.21 266794
N3 601.173 54.90 10526
N4 593.257 50.95 11304
N5 588.340 51.95 12018
N6 586.413 46.10 12451
N7 585.297 45.45 12546
N8 613.873 44.55 13022
Figure 7. Stress distribution diagram of the antenna curtain in the initial state.
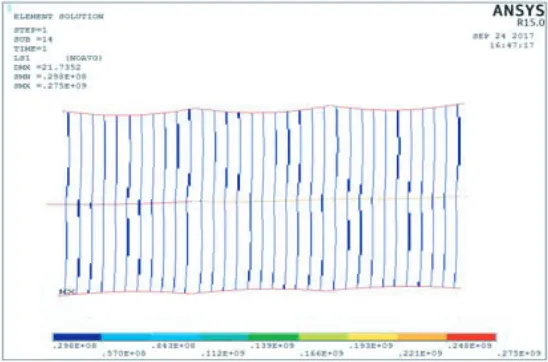
The stress distributions before and after optimization of the antenna curtain are shown in Figure 7 and Figure 8. The parameters of the sling and top capacitance wire after optimization are shown in Table 2. The results in Table 2 indicate that the maximum tension of the top capacitance wires and slings is consistent with the strength requirement of the material. A comparison of the data in Table 1 and Table 2 shows that the average sag of the original antenna curtain is 73.47 m and the average sag of the optimized antenna curtain is 48.98 m, representing a decrease in the average sag of 24.49 m after optimization.
Next the initial and optimized models of the antenna curtain are imported into FEKO; the height of the down lead wires is set to 200 m, the excitation voltage of the feed point is set to 1 V, and the simulation frequency range is 15–30 kHz. A conventional ground is used for the ground type of the antenna field with a conductivity of σ=0.025 S/m and a dielectric constant of εr = 4. The radial grounding grid is composed of 48 copper wires. The radius of the grounding grid is 1000 m and the buried depth is 0.3 m. The mesh size of the antenna is 15 m. The antenna electrical model is shown in Figure 9; Figure 9(a) is the initial state of the antenna and Figure 9(b) is the antenna electrical model after optimization.
the actual antenna, the test data of an actual VLF T-type transmitting antenna is compared with the simulation data in Figure 10(d), the test method is that under the situation of single group feeding, the field strength was tested at 15 kHz, 18.5 kHz, 19.5 kHz, 20.5 kHz, 25 kHz and 30 kHz, and the actual
Figure 8. Stress distribution diagram of the antenna curtain after optimization.
(a) (b)
Figure 9. (a) The initial electrical model of the antenna (main view). (b) The electrical model of the antenna after optimization (main view).
15 20 25 30
0.2 0.25 0.3 0.35 0.4 0.45 0.5 0.55 0.6 0.65
Frequenc y (kHz )
In
pu
t re
si
st
an
ce
(Ω
)
ant enna in initial st ate ant enna after optimi za tion
15 20 25 30
-180 -160 -140 -120 -100 -80 -60
Frequenc y (kHz)
Input
reacta
nc
e
(Ω
)
antenna in initial st ate antenna after optimization
15 20 25 30 0.05
0.1 0.15 0.2 0.25 0.3 0.35 0.4
Frequec ny (kHz )
radi
at
ion re
si
st
an
ce
(Ω
)
antenna in initial st at e antenna after optimi za tion
15 20 25 30
0. 25 0. 3 0. 35 0. 4 0. 45 0. 5 0. 55 0. 6 0. 65
Freque ncy (kHz )
Ra
di
at
io
n e
ffi
ci
en
cy
ant enna in initial st at e ant enna afte r optimi za tion m eas ured dat a of ac tual antenn a
(c) (d)
Figure 10. Comparison of the electrical performance of a VLF T-type transmitting antenna; (a) the input resistance of the antenna curtain in the initial state and after optimization; (b) the input reactance of the antenna curtain in the initial state and after optimization; (c) the radiation resistance of the antenna curtain in the initial state and after optimization; (d) the radiation efficiency of the antenna curtain in the initial state, after optimization and the measured data.
Optimized antenna Initial state antenna
Optimized antenna Initial state antenna
(a) (b)
radiation efficiency can be calculated as:
η = Pr
Pin (13)
Pr = E
2
zd2
90 (14)
wherePris the radiation power of the actual antenna,Pin the output power of the antenna which can be read in the antenna’s engine room, Ez the vertical electric field strength measured, and dthe distance between the antenna and test location.
It is observed that the average radiation efficiency of the optimized antenna is increased by 4.3% compared with the measured data, indicating that the proposed method improves the antenna radiation efficiency compared with the traditional separate structural and electrical analysis method.
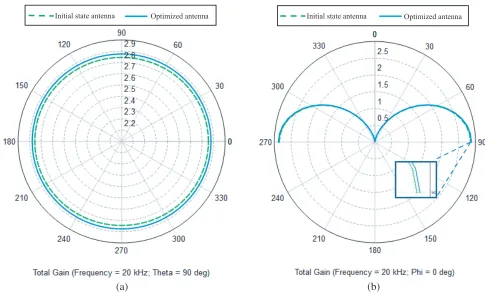
Besides, the radiation patterns of the initial state antenna and optimized antenna at 20 kHz are shown in Figure 11, from which we can observe that the radiation patterns between the antenna in initial state and after optimization stay almost the same. The reason of this phenomenon is that the VLF T-type transmitting antenna is an electrically small antenna (ESA) in VLF. Compared to its wavelength, its own size could be regarded as an electric short dipole, although the efficient height of the antenna would change with the changing of the antenna curtain’s sag, the amount of height variation is extremely small compared to the wavelength. So the change of the antenna curtain’s sag has little influence on the antenna radiation pattern.
5. CONCLUSION
A combined structural and electrical analysis method for VLF T-type transmitting antennas is proposed. Through the optimization of the antenna curtain, the average sag of the antenna curtain is improved while ensuring safety and material strength, and the effective height of the transmitting antenna is increased. A relatively convenient combined electrical and structural analysis strategy is proposed. Specifically, the antenna’s finite element entity model is imported into FEKO, and related post-processing operations are performed to obtain the electrical performance of the antenna. The results indicate that the proposed analysis method is effective and feasible and improves the antenna’s radiation efficiency, but has little influence on the antenna’s radiation pattern. Compared with the measured data, the antenna’s average radiation efficiency is improved by 4.3% by using the proposed method. In addition, this method provides guidance for the combined structural and electrical analysis of other types of VLF transmitting antennas, such as VLF umbrella antennas and VLF valley antennas.
REFERENCES
1. Duan, B., “Review of multidisciplinary optimization of antenna structures in China,” Electronics Machinery Engineering, Vol. 79, No. 3, 1–6, 1999.
2. Bahadori, K. and Y. Rahmat, “Characterization of effects of periodic and aperiodic surface distortions on membrane reflector antennas,” IEEE Transactions on Antennas and Propagation, Vol. 53, No. 9, 2782–2791, 2005.
3. Boag, A. and C. Letrou, “Fast radiation pattern evaluation for lens and reflector antennas,” IEEE Transactions on Antennas and Propagation, Vol. 51, No. 5, 1063–1068, 2003.
4. Gui, Y., Z. Yi, B. Duan, et al., “A novel contoured beam synthesis method for astromesh reflectors based on integrated electromagnetic-structural design,” IEEE Antennas and Wireless Propagation Letters, Vol. 16, 181–185, 2017.
5. Misawa, M., “Stiffness design of deployable satellite antennas in deployed configuration,” Journal Spacecraft and Rockets, Vol. 35, No. 3, 380–386, 1998.
6. Mobrem, M., “Methods of analyzing surface accuracy of large antenna structure to manufacturing tolerances,” AIAA 2003-1453, 1–10, 2003.
8. Zong, Y., “Effects of periodic geometric error of astro mesh reflector surface on radiation pattern and its elimination method,”ACTA Electronica Sinica, Vol. 42, No. 5, 963–970, 2014.
9. Bahadori, K. and Y. Rahmat-samii, “Characterization of effects of periodic and aperiodic surface distortions on membrane reflector antennas,” IEEE Transactions on Antennas and Propagation, Vol. 53, No. 9, 2782–2791, 2005.
10. Dong, Y., C. Liu, G. Dai, and Y. Yan, “Study of VLF transmit antenna impedance characteristic based on top-load configuration,”Chinese Journal of Radio Science, Vol. 29, No. 4, 763–768, 2014. 11. Eric, C. B. and A. R. Michael, “Dual-frequency distortion predictions for the cutler VLF array,”
IEEE Transactions on Aerospace and Electronic Systems, Vol. 39, No. 3, 1016–1035, 2003.
12. Michael, B. C., “Submarine communications,” IEEE Communications Magazine, Vol. 19, No. 6, 16–25, 1981.
13. Timothy, W. C., S. I. Umran, and F. B. Timothy, “Terminal impedance and antenna current distribution of a VLF electric dipole in the inner magnetosphere,”IEEE Transactions on Antennas and Propagation, Vol. 56, No. 8, 2454–2468, 2008.
14. Taylor, R. L.,The Finite Element Method: Its Basis& Fundamental, 549–550, 7th Edition, World Book Publishing Housing, Beijing, 2015.
15. Clarke, S. and U. Jakobus, “Dielectric material modeling in the MOM-based code FEKO,” IEEE Transactions on Antennas and Propagation, Vol. 47, No. 5, 140–147, 2005.
16. Tanaka, H., “Design optimization studies for large-scale contoured beam deployable satellite antennas,”Acta Astronautica, Vol. 58, 443–451, 2006.
17. Zhang, Y. and L. Zheng, “Simulation research on electrical performance of VLF umbrella antennas on complex earth,”China CIO News, Vol. 11, 15–16, 2012.
18. Martings, C. and E. Higashi, “A parametric analysis of steel catenary risers: Fatigue behavior near the top,”Proceedings of the 10th International Offshore and Polar Engineering Conference, 54–59, Seattle, USA, 2000.
19. Song, Z., H. Liang, J. Chen, et al., “Form finding and wind load analysis of T-type antenna structure,” Spatial Structures, Vol. 18, No. 1, 66–70, 2012.