O R I G I N A L R E S E A R C H
New nonlinear multivariable model shows
the relationship between central corneal thickness
and HRTII topographic parameters in glaucoma
patients
Dimitrios Kourkoutas1,2 Gerasimos Georgopoulos1 Antonios Maragos1
Ioannis Apostolakis1 George Tsekouras4 Irene S Karanasiou3
Dimitrios Papaconstantinou1 Evaggelos Iliakis1
Michael Moschos1 1Department of Ophthalmology,
Medical School, Athens University, Athens, Greece; 2Department
of Ophthalmology, 417 Hellenic Army Shared Fund Hospital, Athens, Greece; 3Microwave and Fibre Optics
Laboratory, School of Electrical and Computer Engineering, National Technical University of Athens, Athens, Greece; 4Department of Electrical
Engineering and Computer Science, Hellenic Naval Academy, Piraeus, Greece
Correspondence: Dimitrios Kourkoutas Department of Ophthalmology, 417 Hellenic Army Shared Fund Hospital, 10-12 M Petraki Street,
11521, Athens, Greece Tel +30 210 728 8001 Ext. 433 Email [email protected]
Purpose: In this paper a new nonlinear multivariable regression method is presented in order to investigate the relationship between the central corneal thickness (CCT) and the Heidelberg Retina Tomograph (HRTII) optic nerve head (ONH) topographic measurements, in patients with established glaucoma.
Methods: Forty nine eyes of 49 patients with glaucoma were included in this study. Inclusion
criteria were patients with (a) HRT II ONH imaging of good quality (SD 30 μm), (b) reliable
Humphrey visual fi eld tests (30-2 program), and (c) bilateral CCT measurements with ultrasonic contact pachymetry. Patients were classifi ed as glaucomatous based on visual fi eld and/or ONH damage. The relationship between CCT and topographic parameters was analyzed by using the new nonlinear multivariable regression model.
Results: In the entire group, CCT was 549.78 ± 33.08 μm (range: 484–636 μm); intraocular
pressure (IOP) was 16.4 ± 2.67 mmHg (range: 11–23 mmHg); MD was −3.80 ± 4.97 dB (range:
4.04 – [−20.4] dB); refraction was −0.78 ± 2.46 D (range: −6.0 D to +3.0 D). The new nonlinear
multivariable regression model we used indicated that CCT was signifi cantly related (R2= 0.227,
p 0.01) with rim volume nasally and type of diagnosis.
Conclusions: By using the new nonlinear multivariable regression model, in patients with established glaucoma, our data showed that there is a statistically signifi cant correlation between CCT and HRTII ONH structural measurements, in glaucoma patients.
Keywords: central corneal thickness, glaucoma, optic nerve head, HRT
Introduction
Central corneal thickness (CCT) has been implicated as a risk factor for the development of primary open-angle glaucoma (POAG) and the development of glaucomatous visual fi eld (VF) defects among ocular hypertensive patients1,2 and patients with preperimetric
glaucomatous optic neuropathy.3 CCT has also been associated with VF progression
in patients with POAG.4
However, it has been reported that clinically detectable glaucomatous structural alteration of the ONH may precede the development of reproducible white on white5–9 and blue on yellow8–10 VF defects by up to several years. Correspondingly,
an investigation by Herndon and colleagues11 found that CCT was the most consistent
predictor of the degree of glaucomatous optic nerve head (ONH) structural damage. Most recently, Hewitt and colleagues12 reported that, in glaucomatous eyes, thinner
CCT was related to increased severity of optic disc cupping. In this study, the corrected vertical cup-to-disc ratio (VCDR) was used as the structural marker of glaucoma severity and was calculated by using a modifi ed 60 D lens.13 The same results were
Clinical Ophthalmology downloaded from https://www.dovepress.com/ by 118.70.13.36 on 21-Aug-2020
Kourkoutas et al
found by Jonas and colleagues by evaluating ONH color
stereophotographs.14 Although such quantitative ONH
evaluations have been developed, most of them are complex and time consuming. The advent of computerized instruments such as the Heidelberg Retina Tomograph (HRT; Heidelberg Engineering, GmbH, Dossenheim, Germany) have introduced rapid, quantitative three dimensional analysis of the ONH and retinal nerve fi ber layer (RNFL). The HRT provides rapid, objective and reproducible15–17 measurements of numerous
ONH and RNFL stereometric parameters.
Additionally, due to the continuity of the cornea, sclera and optic disc lamina, CCT may represent a factor that refl ects the biomechanics of the ONH even though we do not know the exact relationship between ONH susceptibility and CCT. Several researchers have turned to numerical modeling to understand the biomechanical environment within the ONH.18–20 The most interesting prediction they made was that
the biomechanics of the corneoscleral shell affect cellular deformation in the ONH quite profoundly. Therefore, it seems reasonable that there should be a relationship between the CCT and biomechanical properties of the cornea and those of the sclera and ONH. We may therefore consider the possibility that CCT may be extrapolated to topographic characteristics and parameters of the optic disc itself.
The purpose of this study was to investigate the associa-tion between the CCT and the quantitative ONH topographic parameters as measured by the HRTII in patients with established glaucoma using a new nonlinear multivariable regression model.21–23
Patients and methods
The study population consisted of patients with documented open angle glaucoma – according to patients’ charts – being followed at the outpatient clinics of the Glaucoma Unit at the University of Athens. Caucasian patients with open angle glaucoma were consecutively recruited between August and December 2005 without knowing the sever-ity of VF defects and ONH damage. Glaucoma diagnoses included were POAG, pseudoexfoliative glaucoma (PXF), pigmentary glaucoma (PG), and normal tension glaucoma (NTG). Informed consent was obtained from all patients after the examination procedure was fully explained. The study protocol was designed according to the Declaration of Helsinki and approved by our Institutional Review Board.
Patients were included if they were aged 35–80 years, had best-corrected visual acuity (BCVA) better than 20/40, open anterior chamber angle, spherical refractive errors
+6.00 and −6.00 D and cylinder 3.00 D, previous
experience of full threshold perimetry, reliable Humphrey fi eld analyzer (HFA) VFs (fi xation losses, false positives,
and false negatives 25%) and good image quality with
the HRT (SD 30 μm). One eye from each patient was
randomly selected to be included in the study.
The exclusion criteria included neurological disease, history of ocular trauma, history of stroke or diabetic retinopathy, corneal opacifi cation of any etiology, use of contact lenses, previous corneal laser or surgery, less than six months post-cataract or post-glaucoma surgery, any history of disease or use of medication that may affect VF reliability, and a suspicion or actual defect in the VF of the eye being tested that is explained by the patient’s ocular status or history, other than glaucoma.
All patients underwent complete ophthalmologic examination, CCT, automated VF test, and ONH tomography. The complete ophthalmologic examination included BCVA, slit-lamp biomicroscopy, Goldmann applanation tonometry (GAT), gonioscopy, and dilated indirect ophthalmoscopy for optic disc and RNFL evaluations.
VF tests were performed with the HFA (Model 740, Humphrey-Zeiss, Dublin, CA, USA) using the full threshold 30-2 program.
ONH tomography was performed using the HRT (soft-ware version 2.01). CCT was measured with an ultrasonic pachymeter (Echoscan US-1800, Nidek Co., Japan).
CCT was measured with an ultrasonic pachymeter. The pachymeter probe was placed on the centre of the cornea and the mean of fi ve readings was automatically calculated for each eye.
GAT was performed on a slit lamp (Haag- Streit, Köniz, Switzerland) with a calibrated tonometer. Before each reading, the measuring drum was reset to approximately 10 mmHg, and the mean of three consecutive readings was recorded. It should be noted that the IOP used in this study was under treatment and was not corrected for CCT.
All measurements were taken during the same visit in the following order: VF test, ONH tomography, CCT, and GAT.
For the purpose of this study, the diagnosis of glaucoma was confi rmed by a glaucoma specialist using the following information:24
1. Existence of VF defects
a. Abnormal glaucoma hemifi eld test, confi rmed in two consecutive tests
b. Three abnormal points confi rmed on two consecutive tests, with p 5% of being normal, one of which should have p 1%, all being contiguous with the blind spot
Clinical Ophthalmology downloaded from https://www.dovepress.com/ by 118.70.13.36 on 21-Aug-2020
Relationship between CCT and HRTII parameters
c. Corrected pattern standard deviation 5% if the VF is otherwise normal, confi rmed on two consecutive tests and/or
2. Existence of glaucomatous optic disc abnormalities.
Statistical methods
A new nonlinear multivariable regression model was developed to determine the relationship between CCT and HRTII ONH topographic measurements.21–23 All the HRTII
global parameters, 36 sectoral parameters, Moorfields regression analysis (MRA) as well as independent parameters (age, VF mean defect [MD], refraction, IOP, and diagnosis) were used with this model.
The specifi c logistic model used in the present study has not been applied before in the ophthalmology literature and we describe it briefl y. It is mentioned that the physical systems are rarely linear and this approximation usually leads to no representative models. The proposed model has been already applied for the quantitative solution of different nonlinear physical and engineering problems, such as data mining,21 statistical indices, load and energy forecasting,22,23
estimation of the settlements during the construction of a tunnel, etc. Its basic advantages (against previous models) are the capability to use of more than one independent variables and the identifi cation of the nonlinear relationships between them.
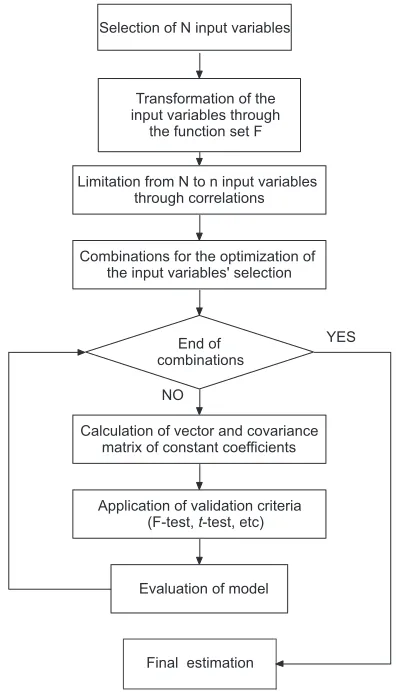
In summary, this method performs an extensive search in order to select the most appropriate functions and weight-ing factors to be used in the model, followweight-ing the basic steps as described by Tsekouras and colleagues (Figure 1; Appendix):22,23
a) Proper transformation of the model variables b) Use of correlation analysis
c) Model optimization regarding the selection of input variables and the application of the validation criteria. The validation criteria are the F-test, the coeffi cient determination R2 for the regression model, and t-tests.
Results
During the study period, 49 eyes of 49 patients were eligible and were included in the study. 29 patients were females and 20 were males. The mean age of study patients was 61.9 ± 12.01 years (range: 35–79 years). Five patients were diagnosed with NTG, 5 patients with PG, 10 patients with PXF, and 29 patients with POAG. The mean CCT for the whole sample was 549.8 ± 33.08 μm (range: 484–636 μm). Subjects of our study had a mean VF MD of −3.80 ± 4.97 dB (range: −20.40 – 4.04 dB). The mean
IOP was 16.4 ± 2.67 mmHg (range: 11–23 mmHg). The
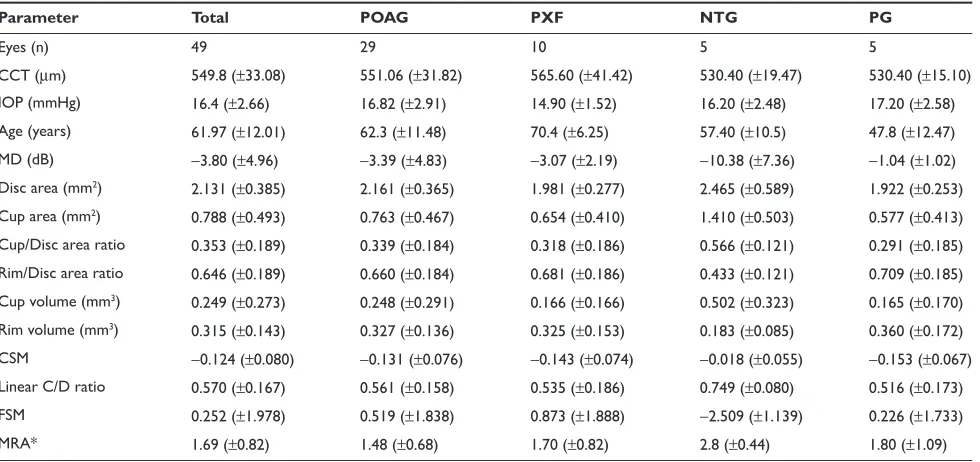
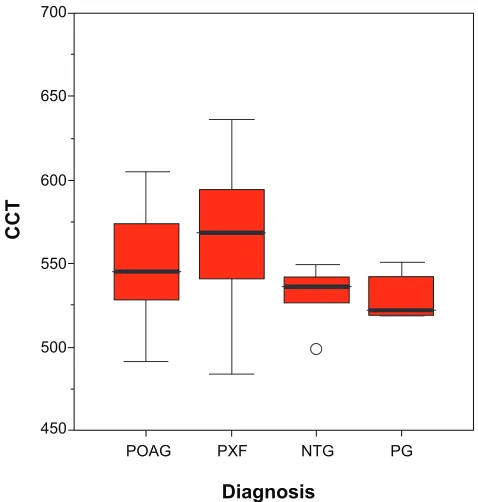
mean spherical equivalent refraction was −0.78 ± 2.46 D (range: −6.0–3.0 D). Descriptive statistics per type of glaucoma (mean ± SD) are presented in Table 1 and Figure 3.
By using the new nonlinear multivariable regression model, the following equation for CCT was statistically signifi cant (p 0.01):
CCT rim volume nas
diagnosis
= + ⋅
− ⋅
548 69 131 78
28 676 0 5 0 5 . . [ ] . [ ] .
. (1)
The respective validation criteria have the following values:
F F
t t
p v v
b p v
= > =
= >
= = =
=
6 762 5 0767
17 8736
1 2 1
1 2
0 01 48 2 0 0001
. .
.
. . . . .11
2 2 1
3
46 0 05 46
4 2601
2 6022 2 0129
1 8516
=
= =
=
= > =
= − ⇒ . . . . . . t t t t
b p v
b b33 1 8516 2 1 1 6787
0 227
0 05 46 2 = > = = = = . . . . . t R p v NO
Transformation of the input variables through
the function set F
Combinations for the optimization of the input variables' selection
Calculation of vector and covariance matrix of constant coefficients
YES
Evaluation of model
Final estimation Limitation from N to n input variables
through correlations Selection of N input variables
End of combinations
Application of validation criteria (F-test, t-test, etc)
Figure 1 Developed nonlinear multivariable regression model.
Clinical Ophthalmology downloaded from https://www.dovepress.com/ by 118.70.13.36 on 21-Aug-2020
Kourkoutas et al
Table 1 Descriptive statistics per type of glaucoma (mean ± SD)
Parameter Total POAG PXF NTG PG
Eyes (n) 49 29 10 5 5
CCT (μm) 549.8 (±33.08) 551.06 (±31.82) 565.60 (±41.42) 530.40 (±19.47) 530.40 (±15.10) IOP (mmHg) 16.4 (±2.66) 16.82 (±2.91) 14.90 (±1.52) 16.20 (±2.48) 17.20 (±2.58) Age (years) 61.97 (±12.01) 62.3 (±11.48) 70.4 (±6.25) 57.40 (±10.5) 47.8 (±12.47) MD (dB) −3.80 (±4.96) −3.39 (±4.83) −3.07 (±2.19) −10.38 (±7.36) −1.04 (±1.02) Disc area (mm2) 2.131 (±0.385) 2.161 (±0.365) 1.981 (±0.277) 2.465 (±0.589) 1.922 (±0.253)
Cup area (mm2) 0.788 (±0.493) 0.763 (±0.467) 0.654 (±0.410) 1.410 (±0.503) 0.577 (±0.413)
Cup/Disc area ratio 0.353 (±0.189) 0.339 (±0.184) 0.318 (±0.186) 0.566 (±0.121) 0.291 (±0.185) Rim/Disc area ratio 0.646 (±0.189) 0.660 (±0.184) 0.681 (±0.186) 0.433 (±0.121) 0.709 (±0.185) Cup volume (mm3) 0.249 (±0.273) 0.248 (±0.291) 0.166 (±0.166) 0.502 (±0.323) 0.165 (±0.170)
Rim volume (mm3) 0.315 (±0.143) 0.327 (±0.136) 0.325 (±0.153) 0.183 (±0.085) 0.360 (±0.172)
CSM −0.124 (±0.080) −0.131 (±0.076) −0.143 (±0.074) −0.018 (±0.055) −0.153 (±0.067) Linear C/D ratio 0.570 (±0.167) 0.561 (±0.158) 0.535 (±0.186) 0.749 (±0.080) 0.516 (±0.173) FSM 0.252 (±1.978) 0.519 (±1.838) 0.873 (±1.888) −2.509 (±1.139) 0.226 (±1.733) MRA* 1.69 (±0.82) 1.48 (±0.68) 1.70 (±0.82) 2.8 (±0.44) 1.80 (±1.09)
Notes: *The values of Moorfi elds regression analysis can be within normal limits, borderline, outside normal limits, which are represented by the arithmetic values 1 to 3, respectively.
Abbreviations: CCT, central corneal thickness; CSM, cup shape measure; IOP, intraocular pressure; FSM, Frederick S Mikelberg discriminant function; MD, mean defect; MRA, Moorfi elds regression analysis; NTG, normal tension glaucoma; PG, pigmentary glaucoma; POAG, primary open-angle glaucoma; PXF, pseudoexfoliative glaucoma.
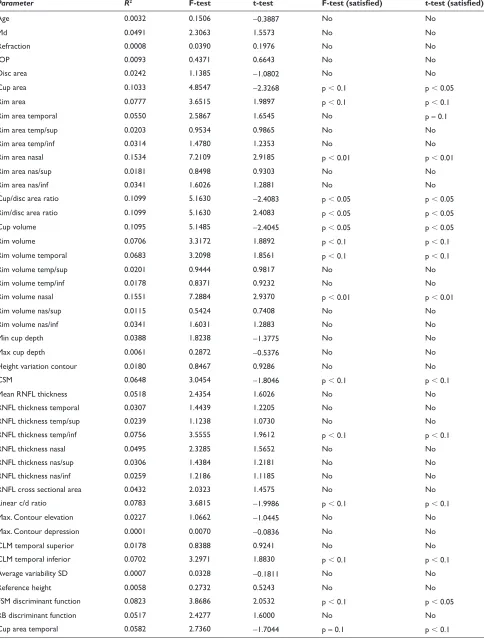
The results of simple linear monovariable regression model between each input variable and CCT using the R2
criterion are presented in Table 2.
Discussion
The present study showed a statistically significant association between CCT and certain HRTII quantitative ONH topographic parameters, in patients with established glaucoma.
From the application of the nonlinear multivariable regression model the respective equation (1) had a quite satisfactory coeffi cient determination (R2 = 0.227) using
the variables rim volume nasally and type of diagnosis, with p 0.01.
The CCT was positively correlated to rim volume nasally and negatively correlated to the type of diagnosis. It is noted that the dependence of CCT on the nasal rim volume is quite strong, because the respective t-test is also satisfi ed with
p 0.0001.
This model therefore indicates that a larger CCT is strongly related with a larger rim volume in the nasal sector of the optic disc. It is well documented in the literature that glaucomatous neuroretinal rim loss takes place in a sequence of sectors that correlates with the progression of visual fi eld defects and the morphology of the lamina cribrosa.25
Generally, it begins in the inferotemporal disc region and then
progresses to the superotemporal, and the temporal sectors. Usually, rim remnants are present in the nasal sector until the advanced glaucoma stages. While the importance of the superotemporal and inferotemporal disc sectors for glaucoma diagnosis has already been shown in previous studies,26–28 the
importance of the nasal optic disc sector has not been clearly demonstrated yet.
Our developed model also includes the variable diagnosis. The values of diagnosis in the current study can be PXF, POAG, PG, NTG, which are represented by the arithmetic values 1 to 4 respectively. This variable is omitted in the cases of different models for each kind of glaucoma diagnosis. Our model therefore confi rms the observation that mean CCT differs within glaucoma subgroups (Table 1; Figure 3). It is reported in the literature that the mean CCT in NTG is lower than in POAG.29,30
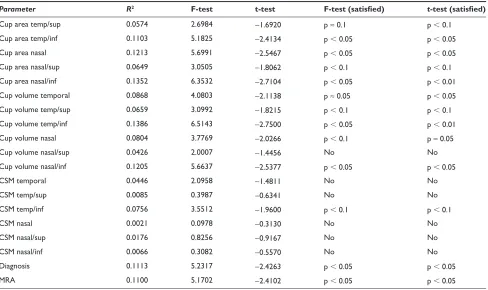
The results of simple linear monovariable regression model between each input variable and CCT are presented in Table 2. There was a statistically signifi cant correlation (p 0.05) between certain HRTII ONH parameters and CCT in our group of eyes, with R2 ranging from 0.0804 to 0.1213.
In a recent study, CCT was inversely correlated to optic disc area in patients with POAG.31 The current study found no
relationship between CCT and optic disc size. In the present study, CCT was positively correlated to rim area nasal, rim/ disc area ratio, rim volume nasal, and Frederick S Mikelberg
Clinical Ophthalmology downloaded from https://www.dovepress.com/ by 118.70.13.36 on 21-Aug-2020
Relationship between CCT and HRTII parameters
discriminant function. The CCT was also negatively correlated to cup area, cup/disc area ratio, cup volume, cup area temporal/inferior, cup area nasal, cup area nasal/inferior, cup volume temporal, cup volume temporal/inferior, cup volume nasal, cup volume nasal/inferior, type of diagnosis, and MRA. The MRA values can be within “normal limits”, “borderline”, “outside normal limits”, which are represented by the arithmetic values 1 to 3 respectively.
Therefore, by using the HRTII ONH structural measure-ments, we confi rm the results of Herndon and colleagues11
who examined consecutive patients with POAG at the fi rst presentation to a glaucoma specialist and fi rst found that CCT was a consistent predictor of the degree of glaucoma-tous damage. Hewitt and colleagues12 also reported that, in
glaucomatous eyes, thinner CCT was related to increased corrected VCDR, by using a modifi ed 60 D lens.13 The same
results were found by Jonas and colleagues, by evaluating ONH color stereophotographs.14 The limitation of these
studies is that the assessment of ONH was necessarily subjective and thus potentially prone to greater error. The advent of HRT, with good reproducibility15–17 as well as
high sensitivity and specifi city32,33 in glaucoma diagnosis,
provides us with objective ONH structural measurements for investigating quantitative associations. However, it should be noted that this technique is based on the contour line drawn by the operator and the capacity of the system to set a reference plane 50 μm below the retinal surface height
between 350° and 356°. The reference plane is theoretically located within the papillomacular bundle, which is the least involved part in glaucomatous damage.34 Nevertheless, the
position of this plane can change from one patient to another and may subsequently affect the analysis of ONH structural measurements.
In a parallel manner, the results of the present study suggest that patients who are followed in a glaucoma unit and suffer from open angle glaucoma have more advanced glaucomatous optic nerve damage if the cornea is relatively thin than if the cornea is relatively thick.
Interestingly, CCT was not correlated to the uncorrected applanation IOP at the time of study enrolment (Eq. 1; Table 2). It should be noted that although IOP was measured, it was not considered to be a major outcome factor because all the subjects were receiving treatment prior to study recruitment. This result is inconsistent with previous stud-ies that showed the CCT was larger in subjects with ocular hypertension compared to normotensive subjects.35–42 It is
therefore well documented in the literature that applanation IOP is infl uenced by CCT. Nonetheless, a study such as this, where patients have commenced medical and/or surgi-cal treatment many years prior to enrolment without taking into account the CCT factor, may fail to disclose a relevant relationship between CCT and IOP. The management of each patient aims to reduce glaucoma progression through lower-ing IOP to individualized levels (target IOP). Therefore, the
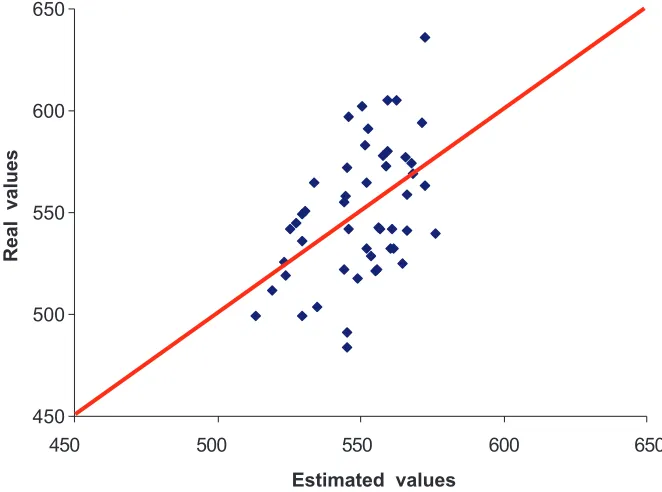
450 500 550 600 650
450 500 550 600 650
Estimated values
Real values
Figure 2 Actual and estimated values of the central corneal thickness using the nonlinear multivariable regression model for the data set of 49 eyes measured.
Clinical Ophthalmology downloaded from https://www.dovepress.com/ by 118.70.13.36 on 21-Aug-2020
Kourkoutas et al
Table 2 R2 criterion between the experimental and the predicted values of CCT for simple linear regression model of one input variable
Parameter R2 F-test t-test F-test (satisfi ed) t-test (satisfi ed)
Age 0.0032 0.1506 −0.3887 No No
Md 0.0491 2.3063 1.5573 No No
Refraction 0.0008 0.0390 0.1976 No No
IOP 0.0093 0.4371 0.6643 No No
Disc area 0.0242 1.1385 −1.0802 No No
Cup area 0.1033 4.8547 −2.3268 p 0.1 p 0.05
Rim area 0.0777 3.6515 1.9897 p 0.1 p 0.1
Rim area temporal 0.0550 2.5867 1.6545 No p ≈ 0.1
Rim area temp/sup 0.0203 0.9534 0.9865 No No
Rim area temp/inf 0.0314 1.4780 1.2353 No No
Rim area nasal 0.1534 7.2109 2.9185 p 0.01 p 0.01
Rim area nas/sup 0.0181 0.8498 0.9303 No No
Rim area nas/inf 0.0341 1.6026 1.2881 No No
Cup/disc area ratio 0.1099 5.1630 −2.4083 p 0.05 p 0.05
Rim/disc area ratio 0.1099 5.1630 2.4083 p 0.05 p 0.05
Cup volume 0.1095 5.1485 −2.4045 p 0.05 p 0.05
Rim volume 0.0706 3.3172 1.8892 p 0.1 p 0.1
Rim volume temporal 0.0683 3.2098 1.8561 p 0.1 p 0.1
Rim volume temp/sup 0.0201 0.9444 0.9817 No No
Rim volume temp/inf 0.0178 0.8371 0.9232 No No
Rim volume nasal 0.1551 7.2884 2.9370 p 0.01 p 0.01
Rim volume nas/sup 0.0115 0.5424 0.7408 No No
Rim volume nas/inf 0.0341 1.6031 1.2883 No No
Min cup depth 0.0388 1.8238 −1.3775 No No
Max cup depth 0.0061 0.2872 −0.5376 No No
Height variation contour 0.0180 0.8467 0.9286 No No
CSM 0.0648 3.0454 −1.8046 p 0.1 p 0.1
Mean RNFL thickness 0.0518 2.4354 1.6026 No No
RNFL thickness temporal 0.0307 1.4439 1.2205 No No
RNFL thickness temp/sup 0.0239 1.1238 1.0730 No No
RNFL thickness temp/inf 0.0756 3.5555 1.9612 p 0.1 p 0.1
RNFL thickness nasal 0.0495 2.3285 1.5652 No No
RNFL thickness nas/sup 0.0306 1.4384 1.2181 No No
RNFL thickness nas/inf 0.0259 1.2186 1.1185 No No
RNFL cross sectional area 0.0432 2.0323 1.4575 No No
Linear c/d ratio 0.0783 3.6815 −1.9986 p 0.1 p 0.1
Max. Contour elevation 0.0227 1.0662 −1.0445 No No
Max. Contour depression 0.0001 0.0070 −0.0836 No No
CLM temporal superior 0.0178 0.8388 0.9241 No No
CLM temporal inferior 0.0702 3.2971 1.8830 p 0.1 p 0.1
Average variability SD 0.0007 0.0328 −0.1811 No No
Reference height 0.0058 0.2732 0.5243 No No
FSM discriminant function 0.0823 3.8686 2.0532 p 0.1 p 0.05
RB discriminant function 0.0517 2.4277 1.6000 No No
Cup area temporal 0.0582 2.7360 −1.7044 p ≈ 0.1 p 0.1
(Continued)
Clinical Ophthalmology downloaded from https://www.dovepress.com/ by 118.70.13.36 on 21-Aug-2020
Relationship between CCT and HRTII parameters
Table 2 (Continued)
Parameter R2 F-test t-test F-test (satisfi ed) t-test (satisfi ed)
Cup area temp/sup 0.0574 2.6984 −1.6920 p ≈ 0.1 p 0.1
Cup area temp/inf 0.1103 5.1825 −2.4134 p 0.05 p 0.05
Cup area nasal 0.1213 5.6991 −2.5467 p 0.05 p 0.05
Cup area nasal/sup 0.0649 3.0505 −1.8062 p 0.1 p 0.1
Cup area nasal/inf 0.1352 6.3532 −2.7104 p 0.05 p 0.01
Cup volume temporal 0.0868 4.0803 −2.1138 p ≈ 0.05 p 0.05
Cup volume temp/sup 0.0659 3.0992 −1.8215 p 0.1 p 0.1
Cup volume temp/inf 0.1386 6.5143 −2.7500 p 0.05 p 0.01
Cup volume nasal 0.0804 3.7769 −2.0266 p 0.1 p ≈ 0.05
Cup volume nasal/sup 0.0426 2.0007 −1.4456 No No
Cup volume nasal/inf 0.1205 5.6637 −2.5377 p 0.05 p 0.05
CSM temporal 0.0446 2.0958 −1.4811 No No
CSM temp/sup 0.0085 0.3987 −0.6341 No No
CSM temp/inf 0.0756 3.5512 −1.9600 p 0.1 p 0.1
CSM nasal 0.0021 0.0978 −0.3130 No No
CSM nasal/sup 0.0176 0.8256 −0.9167 No No
CSM nasal/inf 0.0066 0.3082 −0.5570 No No
Diagnosis 0.1113 5.2317 −2.4263 p 0.05 p 0.05
MRA 0.1100 5.1702 −2.4102 p 0.05 p 0.05
Notes: *The last two variables (diagnosis, MRA) are linguistic ones, so it was necessary to modify them. †The values of diagnosis can be PXF, POAG, PG, NTG, which are represented by the arithmetic values 1 to 4, respectively. This variable is omitted in the cases of different models for each kind of glaucoma diagnosis. ‡The MRA values can be within normal limits, borderline, outside normal limits, which are represented by the arithmetic values 1 to 3, respectively.
Abbreviations: CCT, central corneal thickness; CSM, cup shape measure; CLM, contour line modulation; IOP, intraocular pressure; FSM, Frederick S Mikelberg discriminant function; MD, mean defect; MRA, Moorfi elds regression analysis; NTG, normal tension glaucoma; RB, Renuka Bathija; RNFL, retinal nerve fi ber layer; PG, pigmentary glaucoma; POAG, primary open-angle glaucoma; PXF, pseudoexfoliative glaucoma.
relationship between CCT and IOP may have been affected by the fact that at the time of initial diagnosis, glaucomatous eyes with high pretreatment IOPs, due to high CCT, might have received more aggressive treatment, resulting in lower IOPs despite the presence of thick cornea and vice versa. As a result, there is no dependence between CCT and IOP measurements in our selected group of patients.
If we compare the results of simple linear monovariable regression model between each input variable and CCT using the R2 criterion (which is registered in Table 2) with
the respective results of the proposed model, the new method provides signifi cantly higher R2 values for our selected
group of patients. R2 has been improved by 46% against the
best simple regression model with input parameter cup area nasal, which has R2 equal to 0.1213. This optimal result is
not achieved by just adding new variables during the model fi tting analyses. The best model is justifi ed as the one with the highest R2 that at the same time satisfi es both the following
statements:
• Provides statistically signifi cant p1 values (p1 0.05) for the model F-test.
• Provides statistically signifi cant p2 values (p2 0.05) for the t-test of each one of the included variables.
Our study was limited by the fact that the sample size was relatively small. The sample size and the characteristics of subjects have an infl uence on the results. Thus, although the results of the present study provide information on associations in our selected group of patients, a possible selection bias may account for these associations and a larger population-based study should be performed to confi rm these fi ndings.
In conclusion, this paper presents a nonlinear multivariable regression method, with which the model of equation (1) has been constructed, describing the relationship between CCT and ONH structural parameters in eyes with established glaucoma. Our fi ndings suggest that this relationship is far more complex than can be modeled by simple linear arithmetic formulas. By using the new nonlinear multivariate model in eyes with established glaucoma, our study showed that CCT was significantly associated with the HRTII structural measurement rim volume nasally. The fact that no correlation was found between CCT and IOP possibly
Clinical Ophthalmology downloaded from https://www.dovepress.com/ by 118.70.13.36 on 21-Aug-2020
Kourkoutas et al
POAG PXF NTG PG
Diagnosis
CCT
700
650
600
550
500
450
Figure 3 Distribution of corneal thickness according to diagnosis (POAG, NTG, PXF, PG).
Abbreviations: CCT,central corneal thickness; NTG, normal tension glaucoma; PG, pigmentary glaucoma; POAG, primary open-angle glaucoma; PXF, pseudoexfoliative glaucoma.
refl ects the effect of differing treatment regimes on patients’ eyes. Longitudinal data collection should be performed to confi rm these fi ndings.
Acknowledgments
Presented in part at the 3rd International Congress on Glaucoma Surgery, Toronto, ON, Canada, May 25–28, 2006, and the 1st WSEAS International Conference on Biomedical Electronics and Biomedical Informatics (BEBI ‘08) Rhodes, Greece, August 20–22, 2008.
Disclosure
The authors report no confl icts of interest in this work.
References
1. Gordon MO, Beiser JA, Brandt JD, et al. The Ocular Hypertension Treatment Study: baseline factors that predict the onset of primary open-angle glaucoma. Arch Ophthalmol. 2002;120:714–720. 2. Medeiros FA, Sample PA, Weinreb RN. Corneal thickness measurements
and frequency doubling technology perimetry abnormalities in ocular hypertensive eyes. Ophthalmology. 2003;110:1903–1908.
3. Medeiros FA, Sample PA, Zangwill LM, Bowd C, Aihara M, Weinreb RN. Corneal thickness as a risk factor for visual fi eld loss in patients with preperimetric glaucomatous optic neuropathy. Am J Ophthalmol. 2003;136:805–813.
4. Kim JW, Chen PP. Central corneal pachymetry and visual field progression in patients with open-angle glaucoma. Ophthalmology. 2004;111:2126–2132.
5. Quigley HA, Addicks EM, Green WR. Optic nerve damage in human glaucoma. III. Quantitative correlation of nerve fi ber loss and visual fi eld defect in glaucoma, ischemic neuropathy, papilledema and toxic neuropathy. Arch Ophthalmol. 1982;100:135–146.
6. Tuulonen A, Airaksinen PJ. Initial glaucomatous optic disc and retinal fi ber layer abnormalities and their progression. Am J Ophthalmol. 1991;111:485–490.
7. Sommer A, Katz J, Quigley HA, et al. Clinically detectable nerve fi ber atrophy precedes the onset of glaucomatous fi eld loss. Arch Ophthalmol. 1991;109:77–83.
8. Johnson CA, Sample PA, Cioffi GA, et al. Structure and function evaluation (SAFE): I. criteria for glaucomatous visual fi eld loss using standard 14 automated perimetry (SAP) and short wavelength automated perimetry (SWAP). Am J Ophthalmol. 2002;134(2):177–185. 9. Johnson CA, Sample PA, Zangwill LM, et al. Structure and function
evaluation (SAFE): II. Comparison of optic disk and visual fi eld characteristics. Am J Ophthalmol. 2003;135(2):148–154.
10. Ugurlu S, Hoffman D, Garway-Heath DF, et al. Relationship between structural abnormalities and short-wavelength perimetric defects in eyes at risk of glaucoma. Am J Ophthalmol. 2000;129:592–598. 11. Herndon LW, Weizer JS, Stinnett SS. Central corneal thickness
as a risk factor for advanced glaucoma damage. Arch Ophthalmol. 2004;122:17–21.
12. Hewitt AW, Cooper RL. Relationship between corneal thickness and optic disc damage in glaucoma. Clin Experiment Ophthalmol. 2005;33:158–163.
13. Hasslett RS, Batterbury M, Cuypers M, Cooper RL. Interobserver agreement in clinical optic disc measurement using a modifi ed 60 D lens. Eye. 1997;11:692–697.
14. Jonas JB, Stroux A, Velten I, Juenemann A, Martus P, Budde WM. Central corneal thickness correlated with glaucoma damage and rate of progression. Invest Ophthalmol Vis Sci. 2005;46(4):1269–1274. 15. Sihota R, Gulati V, Agarwal HC, et al. Variables affecting test-retest
variability of Heidelberg Retina Tomograph II stereometric parameters.
J Glaucoma. 2002;11:321–328.
16. Verdonck N, Zeyen T, Van Malderen L, et al. Short-term intra-individual variability in Heidelberg Retina Tomograph II. Bull Soc Belge Ophtalmol. 2002;(286):51–57.
17. Strouthidis NG, White ET, Owen VMF, Ho TA, Hammond CJ, and Garway-Heath DF. Factors affecting the test-retest variability of Heidelberg retina tomograph and Heidelberg retina tomograph II measurements. Br J Ophthalmol. 2005;89:1427–1432.
18. Sigal IA, Flanagan JG, Ethier CR. Factors infl uencing optic nerve head biomechanics. Invest Ophthalmol Vis Sci. 2005;46:4189–4199. 19. Sigal IA, Flanagan JG, Tertinegg I, Ethier CR. Finite element
modeling of optic nerve head biomechanics. Invest Ophthalmol Vis Sci. 2004;45:4378–4387.
20. Sigal IA, Flanagan JG, Tertinegg I, Ethier CR. Reconstruction of human optic nerve heads for fi nite element modeling. Technol Health Care. 2005;13:313–329.
21. Hand D, Manilla H, Smyth P. Principles of Data Mining. Cambridge, MA: The MIT Press; 2001. p. 368–371.
22. Tsekouras GJ, Elias CN, Kavatza S, Contaxis GC. A hybrid non-linear regression midterm energy forecasting method using data mining. 2003 IEEE Bologna Power Tech Conference, June 23–26th, Bologna, Italy. 23. Tsekouras GJ, Dialynas EN, Hatziargyriou ND, Kavatza S. A non-linear
multivariable regression model for midterm energy forecasting of power systems. Electr PowerSystRes. 2007;77(12):1560–1568.
24. European Glaucoma Society. Terminology and Guidelines for
Glaucoma. Savona: Editrice Dogma; 2003. p. 24–32.
25. Jonas JB, Fernandez MC, Stürmer J. Pattern of glaucomatous neuroretinal rim loss. Ophthalmology. 1993;100(1):63–68.
26. Pederson JE, Anderson DR. The mode of progressive disc cupping in ocular hypertension and glaucoma. Arch Ophthalmol. 1980;98:490–495. 27. Caprioli J, Miller JM, Sears M. Quantitative evaluation of the optic
nerve head in patients with unilateral visual fi eld loss from primary open-angle glaucoma. Ophthalmology. 1987;94:1484–1487.
Clinical Ophthalmology downloaded from https://www.dovepress.com/ by 118.70.13.36 on 21-Aug-2020
Relationship between CCT and HRTII parameters
28. Garway-Heath DF, Hitchings RA. Quantitative evaluation of the optic nerve head in early glaucoma. Br J Ophthalmol. 1998;82:352–361. 29. Copt RP, Thomas R, Mermoud A. Corneal thickness in ocular
hypertension, primary open angle glaucoma and normal tension glaucoma. Arch Ophthalmol. 1999;117:14–16.
30. Emara BY, Tingey DP, Probst LE, Motolko MA. Central corneal thickness in low-tension glaucoma. Can J Ophthalmol. 1999;319–324. 31. Pakravan M, Parsa A, Sanagou M, Parsa CF. Central corneal thickness
and correlation to optic disc size: a potential link for susceptibility to glaucoma. Br J Ophthalmol. 2007;91(1):26–28.
32. Uchida H, Brigatti L, Caprioli J, et al. Detection of structural damage from glaucoma with confocal laser image analysis. Invest Ophthalmol Vis Sci. 1996;37:2393–2401.
33. Wollstein G, Garway-Heath DF, Hitchings RA, et al. Identifi cation of early glaucoma cases with the scanning laser ophthalmoscope.
Ophthalmology. 1998;105:1557–1563.
34. Iester M, Mikelberg FS, Swindale NV, Drance SM. ROC curve analysis of Heidelberg Retina Tomograph optic disc shape measures in glaucoma. Can J Ophthalmol. 1997;32:382–388.
35. Argus WA. Ocular hypertension and central corneal thickness.
Ophthalmology. 1995;102:1810–1812.
36. Bron AM, Creuzot-Garcher C, Goudeau-Boutillon S, d’Athis P. Falsely elevated intraocular pressure due to increased central corneal thickness.
Graefes Arch Clin Exp Ophthalmol. 1999;237:220–224.
37. Copt RP, Thomas R, Mermoud A. Corneal thickness in ocular hypertension, primary open-angle glaucoma, and normal tension glaucoma. Arch Ophthalmol. 1999;117:14–16.
38. Herndon LW, Choudhri SA, Cox T, Damji KF, Shields MB, Allingham RR. Central corneal thickness in normal, glaucomatous, and ocular hypertensive eyes. Arch Ophthalmol. 1997;115:1137–1141. 39. Herman DC, Hodge DO, Bourne WM. Increased corneal thickness
in 17 patients with ocular hypertension. Arch Ophthalmol. 2001;119: 334–336.
40. Whitacre MM, Stein R. Sources of error with use of Goldmanntype tonometers. Surv Ophthalmol. 1993;38:1–30.
41. Whitacre MM, Stein RA, Hassanein K. The effect of corneal thickness on applanation tonometry. Am J Ophthlmol. 1993;115:592–596. 42. Lleo A, Marcos A, Calatayud M, Alonso L, Rahhal SM,
Sanchis-Gimeno JA. The relationship between central corneal thickness and Goldmann applanation tonometry. Clin Exp Optom. 2003;86:104–108.
Clinical Ophthalmology downloaded from https://www.dovepress.com/ by 118.70.13.36 on 21-Aug-2020
Kourkoutas et al
Appendix
The method assumes that a particular set of variables has been selected through doctor’s knowledge, data preprocessing, and conversion. These variables will be examined for potential incorporation in the model. The selected set of variables can be structured in vectors as:
…
xi xi xi xin x j n
T ij
T
=( 1, 2, , ) =( , =1, ..., ) (1)
where xij is the value of the j-th selected variable for the eye i. There are m1 vectors for training the model and m2 for conducting the fi nal estimation of CCT.
Figure 1 shows the basic steps of the developed method, which has the following main components:
• proper transformation of the model variables, • use of correlation analysis,
• model optimization regarding the selection of input vari-ables and the application of the validation criterions. The nonlinear functions to be used by the method belong to a selected function set F=
{
fk( )
xj :k=1...K}
, where xjis the j-th selected variable. Such functions can be xa
, 1/x,
1n( ),x e−x, while the parameter a belongs to specifi c set Α and should be determined. Based on the selected function set
F the basic vector Xi is defi ned as:
Xi f xi fK xi f xiN fK xiN
T
=(1 1( 1)... ( 1), ... 1( )... ( )) (2)
having dimension w equal to 1 + N ⋅ K, where N is the number of the input variables, which are pre-selected by the user’s knowledge or by simple data mining techniques such as two dimensional scatter-plot analysis etc. Any linear combination of terms contained in vector Xi forms a basis for a candidate
estimation model. The number of all possible combinations is 2N⋅K, since the constant term always exists.
In order to reduce the number of candidate combinations, a correlation analysis is performed using the following basic steps:
• The correlation index between f xk( j) and y is computed
and the term f xk( j) is retained for further processing, if
the index is greater than a pre-specifi ed value cor1.
• For all terms being retained, a cross correlation analysis is performed. If the correlation index between any two terms f xk
( )
j −f xk'( )
j' , for k≠ ′k and j≠ ′jsimultane-ously, is smaller than a pre-specifi ed value cor2, both
terms are retained, otherwise only the term with the largest correlation with respect to output y is retained. Therefore, all functions that have information overlap are deduced through this cross correlation analysis and form the set Fc.
• The function having the smaller absolute correlation index with the variable y is removed and this process is repeated until the set Fc is empty.
The above analysis results in a reduced subset of w1 variables
Xij, which form the vector Xt t−. Any linear combination of any of the w1 variables included in the vector
Xt t− (2 1 w
such combinations) is a candidate estimation model. All these combinations should be examined in order to determine the one leading to the best estimation.
If Xt is one of the combinations having dimension w2, the nonlinear multivariable regression model has the
following form:
yt b X
T t
= ⋅ (3)
where b b b bw
T
=
(
1, 2,..., 2)
is the unknown vector of constantcoeffi cients, yt is the output variable to be estimated and yt
is the respective real one. The estimated vector b and the respective covariance matrix cov
( )
b are given by:
b XP X X Y
T
P P
T
=
(
⋅)
−1⋅ ⋅ (4)cov b v XP X
T P
( )
=σ2⋅(
⋅)
−1 (5)where σv t
t m
e m w
2 2 1 2 1 1 =∑ − = ( ),
Y y y ym T
=( , ,...,1 2 1) is the vector
of the real output values, XP X X X
T
m
=
(
1, 2, ..., 1)
is the matrixof the input variables. The procedure for the mathematical solution of this problem is presented by Tsekouras and colleagues.20
If the vector Xt *
of the selected variables is known for the eye t, the mean value and the covariance of the central corneal thickness are given by:
yt*=bT⋅Xt* (6)
σy tT t
t* X b X
* cov *
2 = ⋅
( )
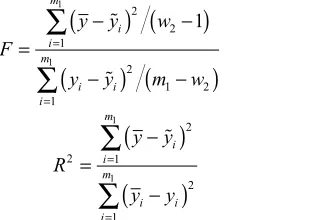
⋅ (7)The validation criterions are the F-test and the coeffi cient determination R2 for the regression model and t-tests for the
bj parameters, which are given by:
F
y y w y y m w
i i m i i i m = −
(
)
(
−)
−(
)
(
−)
= =∑
∑
2 2 1 2 1 2 1 1 1 1 (8) R y y y y i i m i i i m 2 2 1 2 1 1 1 = −(
)
−(
)
= =∑
∑
(9)Clinical Ophthalmology downloaded from https://www.dovepress.com/ by 118.70.13.36 on 21-Aug-2020
Relationship between CCT and HRTII parameters
t j b b
m w
j
j j ( )
,
cov( )
2− 2 − = (10)
Therefore, the main steps of the developed regression method are the following:
1. The N input variables are selected using simple data mining techniques, such as scatter-plot analysis between each possible input variable and the forecasting one. Alternatively the user’s knowledge can be used. 2. Based on the selected variables and function set F, the
basic vector Xi is determined.
3. Based on correlation analysis, a reduced subset of terms of the basic vector Xi is selected to form the vector
Xt t−.
4. Any combination of the terms in Xt t− is a vector
Xi,
candidate to be examined as a basis for the estimation model.
5. For each vector Xi the three validation criterions are
calculated (F-test, R2, t-test).
6. The F-test will be successful, if the F-value by eq. (8) is greater than the respective value of the Snedecor probability distribution for given probability p1, with
v2= m1 – 1, v1= w2 – 1. The t-test will be successful, if the t-value for each bj parameter by eq. (10) is greater than (or at least equal to) the respective value of the Student probability distribution for given probability
p2, with v1= m1 – w2. The Xi is a successful vector, if
both of the F-test and t-test for all bj are successful. 7. The vector Xi with the overall minimum value of R
2 is
selected.
Clinical Ophthalmology downloaded from https://www.dovepress.com/ by 118.70.13.36 on 21-Aug-2020
Clinical Ophthalmology downloaded from https://www.dovepress.com/ by 118.70.13.36 on 21-Aug-2020