Theses and Dissertations
2017
Stilbenes: Therapeutic Interventions Targeting
Amyloid β Protein Aggregation In Alzheimer’s
Disease
Yiying Wang
University of South Carolina
Follow this and additional works at:https://scholarcommons.sc.edu/etd Part of theChemical Engineering Commons
This Open Access Dissertation is brought to you by Scholar Commons. It has been accepted for inclusion in Theses and Dissertations by an authorized administrator of Scholar Commons. For more information, please [email protected].
Recommended Citation
STILBENES: THERAPEUTIC INTERVENTIONS TARGETING AMYLOID β
PROTEIN AGGREGATION IN ALZHEIMER’S DISEASE
by
Yiying Wang
Bachelor of Science
Dalian University of Technology, 2012
Submitted in Partial Fulfilment of the Requirements
For the Degree of Doctor of Philosophy in
Chemical Engineering
College of Engineering and Computing
University of South Carolina
2017
Accepted by:
Melissa A. Moss, Major Professor
Michael Matthews, Committee Member
Mark Uline, Committee Member
James Chapman, Committee Member
John Weidner, Committee Member
ABSTRACT
Alzheimer’s disease (AD) is the most common form of dementia and accounts for
60-80 % of all dementia cases. In the United States, AD is ranked as the 6th leading cause
of death and it is the only one among the top 10 that cannot be prevented, treated or even
slowed. All FDA approved drugs focus on attenuating the symptoms for a limited time by
regulating neurotransmitters without any intervention with the underlying disease process.
A major player in the initiation and development of this debilitating disorder is the
misfolding and subsequent aggregating of amyloid-β (Aβ) peptide. This aggregation
process converts non-toxic functional Aβ peptides into a spectrum of neurotoxic Aβ
aggregated species, such as, oligomers, soluble aggregates and fibrils. These aggregated
forms are believed to be the source of inflammation and oxidative stress that cause neuron
death and the loss of synaptic functions. Therefore, small molecules that could intervene
with the aggregation of Aβ peptides may present an effective AD therapeutic prevention
and treatment.
The work presented here examined the intervening effects of eight stilbenes, such
as resveratrol and piceatannol, on multiple mechanistic steps of Aβ aggregation. Results
identified trans-piceatannol and cis-piceatannol as the most potent compounds that could
affect distinct aggregation pathways, specifically, modifying the conformation of Aβ
aggregates, as well as, reducing soluble aggregate growth rate. The pronounced change in
Aβ aggregate conformation might be related to a change in cytotoxicity. Their superior
conformation induced by trans-piceatannol substantially reduced the Aβ aggregates
binding to lipid bilayers, which plays a vital role in the induction of neurotoxicity. Other
stilbenes, including resveratrol, also altered the morphology of Aβ aggregates but they
exhibited only moderate interfering effects on Aβ aggregation pathways. Together, this
study provides insight into the effective interventions of piceatannol on Aβ aggregation
and proposes this natural compound as a novel promising small molecule for the prevention
TABLE OF CONTENTS
ABSTRACT ... iii
LIST OF FIGURES ... viii
LIST OF ABBREVIATIONS ... x
CHAPTER 1 BACKGROUND AND SIGNIFICANCE ... 1
1.1 Alzheimer’s Disease ... 1
1.2 Amyloid-b Protein Aggregation ... 2
1.3 Aβ Aggregation Mechanistic Steps ... 4
1.4 Aβ Aggregation and Lipid Membranes ... 5
1.5 Stilbenes as Potential Therapeutic Agents for AD ... 6
1.6 Specific Aims ... 8
CHAPTER 2 MATERIALS AND METHODS ... 11
2.1 Materials ... 11
2.2 Preparation of Aβ40 Monomer ... 12
2.3 Aβ40 Monomer Aggregation ... 13
2.4 Preparation of Aβ40 Fibril ... 17
2.5 ThT Competition Assay ... 18
2.7 Transmission Electron Microscopy ... 18
2.8 Preparation of Aβ42 Oligomer ... 19
2.9 Aβ42 Oligomer Size Analysis by SDS-PAGE with Western Blot ... 19
2.10 Aβ42 Oligomer Conformation Analysis with ANS Fluorescence ... 20
2.11 Preparation of Aβ40 Soluble Aggregate ... 21
2.12 Aβ40 Soluble Aggregate Association Monitored by DLS ... 22
2.13 Aβ40 Soluble Aggregate Elongation Monitored by QCM ... 22
CHAPTER 3 EFFCT OF RESVERATROL AND DERIVATIVES ON MODULATING AMYLOID-b AGGREGATION AND ALTERING THE MORPHOLOGY OF AGGREGATES ... 29
3.1 Introduction ... 29
3.2 Materials and Methods ... 31
3.3 Results ... 32
3.4 Discussion ... 37
CHAPTER 4 EFFECT OF PICEATANNOL AND DERIVATIVES ON MODULATING AMYLOID-b AGGREGATES AND ALTERING THE MORPHOLOGY OF AGGREGATES ... 51
4.1 Introduction ... 51
4.2 Materials and Methods ... 53
4.3 Results ... 54
4.4 Discussion ... 57
5.2 Materials and Methods ... 70
5.3 Results ... 71
5.4 Discussion ... 73
CHAPTER 6 CONCLUSION ... 81
CHAPTER 7 FUTURE WORK ... 84
LIST OF FIGURES
Figure 1.1 Mechanistic steps of Aβ aggregation……….9
Figure 1.2 Stilbenes structures………10
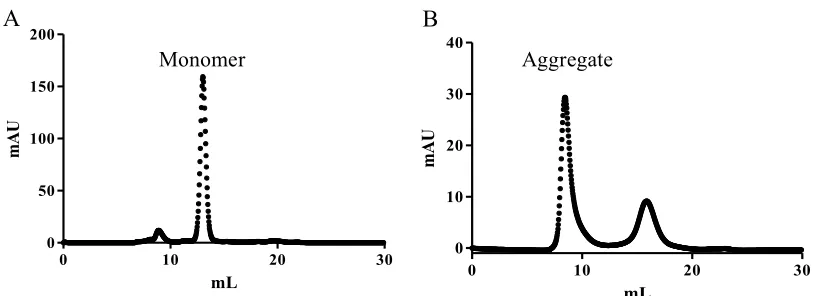
Figure 2.1 FPLC-SEC purification profile for Aβ40 monomer and Aβ40 soluble
aggregate………....26
Figure 2.2 DLS configuration and schematic representation of a speckle pattern………...27
Figure 2.3 Aβ40 soluble aggregate elongation monitored by QCM……….28
Figure 3.1 Structure of resveratrol and derivatives……….42
Figure 3.2 Effect of resveratrol and derivatives on ThT fluorescence with Aβ40 fibrils…..43
Figure 3.3 Effect of resveratrol and derivatives on Aβ40 monomer aggregation………….44
Figure 3.4 Effect of resveratrol and derivatives on pre-formed Aβ40 fibrils………45
Figure 3.5 Effect of PIC on Aβ40 monomer aggregation monitored via DLS………..46
Figure 3.6 Effect of resveratrol and derivatives on Aβ40 fibril structure……….47
Figure 3.7 Effect of resveratrol and derivatives on Aβ42 oligomer size distribution and
surface hydrophobicity……….………..48
Figure 3.8 Effect of resveratrol and derivatives on Aβ40 soluble aggregate association…..49
Figure 3.9 Effect of resveratrol and derivatives on Aβ40 soluble aggregate elongation…...50
Figure 4.1 Structure of piceatannol and derivatives………62
Figure 4.2 Effect of piceatannol and derivatives on Aβ40 monomer aggregation…………63
Figure 4.3 Effect of piceatannol and derivatives on Aβ40 aggregate structure……….64
Figure 4.4 Effect of piceatannol and derivatives on Aβ42 oligomer size distribution……..65
Figure 4.6 Effect of piceatannol and derivatives on Aβ40 soluble aggregate elongation…67
Figure 5.1 Structure of POPC and DPPC………..…77
Figure 5.2 SPBs formation on a SiO2 covered crystal monitored by QCM………..78
Figure 5.3 Control Aβ40 aggregate and PIC-modified Aβ40 aggregate have distinct
conformations………79
Figure 5.4 Effect of piceatannol on Aβ aggregate binding onto SPBs with various
LIST OF ABBREVIATIONS
Aβ……….Amyloid-β protein
Aβ40………..40 amino acid isoform of Aβ
Aβ42………..42 amino acid isoform of Aβ
AD……… Alzheimer’s disease
ANS………..……8-anilino-1-naphtalenesulfonic acid
APP……….………Amyloid Precursor Protein
BSA………bovine serum albumin
DDP……….………3,3’-dithioproponic acid
DLS……….dynamic light scattering
DMSO……….….…………dimethyl sulfoxide
DPPC………1,2-dipalmitoyl-sn-glycero-3-phosphocholine
EDC………..……N-(2-dimethylamino-propyl)-N’-ethylcarbodiimide hydrochloride
FDA………Food and Drug Adimistration
FPLC………..………fast protein liquid chromatography
IRPT………isorhapontigenin
LMV………large multilamellar vesicle
LOC………...rabbit-anti-amyloid fibrils antibody
NFT………..neurofibrillary tangle
NHS………..N-hydroxy succinimide
OXR………oxyresveratrol
PBS………...phosphate buffered saline
PBST………..phosphate buffered saline with tween
PIC………...piceatannol
PID………...piceid
POPC………1-palmitoyl-2-oleoyl-sn-glycero-3-phosphocholine
QCM………..quartz crystal microbalance
RES………...resveratrol
RPT………..rhapontigenin
SDS………...sodium dodecyl sulfate
SDS-PAGE………SDS-polyacrylamide gel electrophoresis
SEC………..size exclusion chromatography
SUV………small unilamellar vesicle
TEM……….transmission electron microscopy
CHAPTER 1
BACKGROUND AND SIGNIFICANCE
1.1 Alzheimer’s Disease
Alzheimer’s disease (AD), accounting for 60-80 % of all dementia cases, has
gained worldwide attention. In 2012, the month of September was designated as World
Alzheimer’s Month, and September 21st was named World Alzheimer’s Day for the
purpose of raising awareness and spreading knowledge of AD. AD is a progressive, chronic
neurodegenerative disorder, which mainly affects people older than 65. Thus, age is a
major risk factor for AD. However, the cause of AD is complex and believed to be a
combination of multiple risk factors, such as, diet, family history, apolipoprotein E
(APOE)-ε4 gene inheritance, social and cognitive engagement, and traumatic brain injury
[1]. The mild AD symptoms include short-term memory loss, depression, mood swings
and difficulty in problems solving. Severe AD patients show symptoms such as temporal
and spatial confusion, visual problems and even loss of the ability to walk or swallow.
Eventually, AD causes death. Patients who are older than 65 usually only live for another
4 to 8 years after their diagnosis [2].
In the United States, this disease is ranked as the 6th leading cause of death and it is
the only one among the top 10 that cannot be prevented, treated or even slowed [3]. All
five FDA approved drugs focus on attenuating the symptoms for a limited time by
regulating neurotransmitters without any intervention with the underlying disease process.
(heart disease 14%, stroke 23%, HIV 52%), deaths caused by AD have increased by 71%
[2]. It has recently been labeled the “twenty-first century plague” [4] with 5.4 million
Americans suffering from AD in 2016 and 40 million worldwide. It is predicted the number
of patients will increase to 13.8 million in the US and 150 million globally by 2050 if no
more effective treatment can be developed to intervene [2]. With such a high mortality,
prevalence and incidence, AD is becoming an increasingly heavy burden for society and it
is urgent to pursue effective new therapeutic methods which slow the pathological progress
or even stop the development of the disease.
1.2 Amyloid-b Protein Aggregation
Physiologically, AD is characterized by the extracellular deposition of neuritic
plaques, which are constituted of amyloid-β (Aβ) peptide aggregated fibrils and the
intracellular accumulation of neurofibrillary tangles (NFTs), which are composed of
hyperphosphorylated tau proteins in human brain tissues. While plaques and tangles
coexist in AD brains, plaques are specific for AD since NFTs can occur by themselves and
cause other types of dementias, such as frontotemporal dementia and chronic traumatic
encephalopathy. Some studies suggested that NFTs formation is a downstream event of Aβ
aggregation [5], and NFTs have been observed to disperse after the removal of Aβ plaques
[6]. These observations provide support for the amyloid cascade hypothesis (postulated by
Hardy and colleagues in 1992 [7]), which established a causal link between Aβ aggregation
and the disease. It remains as the leading hypothesis for the pathology of AD. Over the past
twenty-five years, a few slight modifications were made, but the concept of this hypothesis
Aβ peptide mainly exists in two isoforms: Aβ40, 40 amino acids in length, is the
most common isoform (90%); and Aβ42, with an additional two hydrophobic amino acids
at the C-terminus based on Aβ40, has higher aggregation propensity due to its greater
hydrophobicity. Aβ peptides are derived from the proteolytic cleavages of a
transmembrane glycoprotein, amyloid precursor protein (APP), by enzyme β-secretase at
the N-terminus of APP and enzyme γ-secretase at the C-terminus of APP. The location of
C-terminal γ-secretase cutting sites determines the type of Aβ peptide (Aβ40 or Aβ42). Aβ
peptide is present ubiquitously and formed during normal cellular metabolism [9]. It is
non-toxic and some studies even suggest that it contributes to memory improvement at
physiological, low picomolar concentrations [10]. Aβ peptide levels are normally regulated
at a balance between production and clearance. Perturbations to this balance, such as Aβ
overexpression and the failure of amyloid degrading enzymes, lead to the accumulation of
excess Aβ peptide to initiate a sequence of self-aggregation that causes deleterious events
and disease.
To understand the Aβ aggregation process, we can describe it as a phenomenon of
searching for minimum on a free energy surface [11]. Aβ peptides, under normal
physiological conditions, exist in an intrinsically disordered state which is referred to as
the “native unfolded state”. This state is stable under physiological conditions because it
reflects a local free energy minimum. The transition from native forms to aggregated forms
requires Aβ peptides to overcome a high kinetic barrier. From the perspective of biological
evolution, this energy barrier might be the result of the development of complex molecular
machineries aimed at preventing the formation of toxic aggregates [12]. However, the
from physiological conditions to misfolding conditions. Under these conditions, Aβ
peptides may overcome the energy barrier and enter an aggregation-prone state, which has
an even lower free energy than the native state. After entering this state, Aβ peptide
intermolecular interactions are favored over intramolecular interactions and their
hydrophobic cores become exposed to the solvent. These changes cause Aβ peptides to be
loosely packed and have a higher chance to nucleate into oligomeric assemblies, which
initiates a chain reaction of self-aggregation by forming nuclei and recruiting other Aβ
peptides to form larger size aggregates, such as oligomers, soluble aggregates and mature
fibrils. Aβ fibrils, with a rope-like structure, are usually straight, unbranched, 0.1-10 µm
long and 10 nm wide. They have a cross-b structure that stabilizes fibrils since it allows
the formation of a continuous array of hydrogen bonds between side chains [13]. This
secondary b structure, present in various aggregated species, is believed to lead to the
overwhelming impairment of the cell defense mechanisms and cause cell death by
apoptosis or necrosis [12].
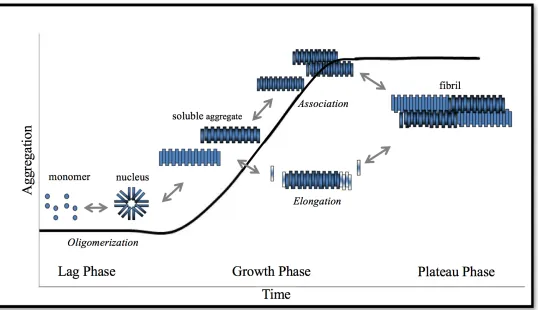
1.3 Aβ Aggregation Mechanistic Steps
Aβ aggregation occurs via a nucleation-dependent, multi-step pathway which can
be characterized as three phases: lag phase, growth phase, and plateau phase. Lag phase is
the time period in which individual Aβ peptides (monomers) form small oligomers to serve
as aggregation nuclei. It is considered the rate limiting step since the free energy barrier
needs to be crossed for the nucleation. Lag phase cannot be readily detected in the bulk
assay because the aggregates concentration is low and these aggregates lack the β-sheet
structure which is commonly used as an indicator for aggregation extent. Once nuclei
Aβ aggregates rapidly grow in size by two parallel mechanisms simultaneously: elongation
via monomer addition, which increases the length of aggregates, and association via
aggregate lateral interaction, which increases the thickness of aggregates [14]. These Aβ
soluble aggregates also undergo a conformational change in which β-sheet structure is
substantially developed, and thus aggregation assays identify growth phase as a significant
signal increase. Eventually, the stable, insoluble Aβ fibrils are formed and various Aβ
species coexist in equilibrium, and this is the plateau phase. In aggregation assays, it is
represented by a constant, stable signal extending from the end of growth phase. Figure 1.1
shows the mechanistic steps of Aβ aggregation.
1.4 Aβ Aggregation and Lipid Membranes
The neurotoxicity mechanism of Aβ aggregates is complex, and there are a variety
of hypotheses that have been proposed, such as, the inflammatory effect of Aβ aggregates
on the cell membrane [15], oxidative stress [16], effect of metals [17], specific and
nonspecific interactions with cellular and lipid membranes [18,19]. Thus, the interaction
of Aβ aggregates with lipid membranes may play a vital role in the induction of
neurotoxicity. The possible changes in the membrane induced by Aβ aggregates include
thinning of the membrane, alterations in fluidity and permeability which results in lipid
oxidation and free radical production, and formation of ion channels which leads to a
dramatic increase in intracellular calcium ions [20].
With the tremendous amount of Aβ research, from both experimental and
computational perspectives, progress has been made to reveal the molecular mechanisms
that may drive Aβ to interact with the cell membrane and cause toxic effects. These
surface of lipid membrane without penetrating and destroy membrane structure or integrity
[15]. 2) Aβ aggregates penetrate into membranes, causing defects within the membrane
which results in functional disorders [12]. 3) Aβ aggregates induce formation of ion
channels on the membranes, which destabilizes cellular ionic homeostasis [18]. There is
abundant evidence for each of these mechanism types. It is proposed that the exact type of
damage caused by Aβ aggregates is highly dependent on both the properties of the
membranes and the attributes of Aβ aggregates. Therefore, Aβ aggregates modified by
compounds could interact with lipid membranes in a novel way, possibly from pathogenic
interaction to non-pathogenic interaction.
1.5 Stilbenes as Potential Therapeutic Agents for AD
Polyphenols are a huge family of naturally occurring and synthetic compounds that
contain hydroxylated aromatic rings. Polyphenols can be found in abundance in everyday
foods, such as gallic acid in tea, ferulic acid in cereal grains, flavonols in various fruits and
resveratrol in grapes. They have been extensively studied recently for their multiple
beneficial effects to human health and have been investigated as potential therapeutic
agents for various diseases, such as cancer, high blood pressure, heart disease and diabetes,
mainly based on their antioxidant and anti-inflammatory properties [21]. Besides,
polyphenols also have properties of interacting with peptides and proteins [22]. Since AD
is a disease caused by Aβ protein misfolding, the interactions between polyphenols and Aβ
protein might play an important role in the intervention of disease progression, and it is the
basis on which this research is developed.
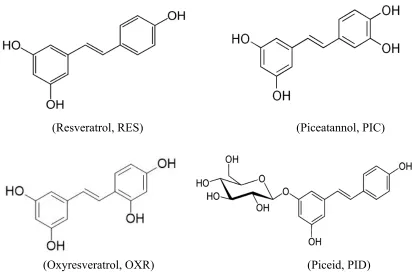
Polyphenols can be categorized into subgroups based on their structures. This
ethene double bond with each carbon atom of the double bond substituted with phenyl
rings, and compounds within the group differ from each other by phenyl ring R groups.
Stilbenes studied in this research are shown in Figure 1.2. Resveratrol is the most common
natural stilbene found in over 70 plants. It is most abundant in grape skins and seeds, which
are used to make wine, and the concentration of resveratrol in red wine is much higher than
that in white wine because the grape skins are present a longer time in the fermentation
process of red wine [23]. The high content of resveratrol in red wine presents resveratrol
as a possible explanation for the “French Paradox” – in spite of having a diet rich in
saturated fats, French people who consumed 2-4 glasses of red wine per day have a low
incidence of cardiovascular diseases. Moreover, epidemiological evidence suggests that
moderate consumption of red wine is associated with a reduced risk of AD [24]. The
scientific community has suggested this association could be a result of various resveratrol
and derivatives’ neuroprotective properties, such as, reducing oxidative stress [25],
inhibiting neuroinflammation [26], promoting neurogenesis and microvessel formation
[27], as well as promoting the clearance of Aβ peptide [28]. Besides resveratrol, other
stilbenes also exhibit beneficial effects for human health, for example, piceatannol has
antidiabetic, neuroprotective and cardioprotective effects [29]; oxyresveratrol has
anti-inflammatory, anti-herpes virus properties [30,31]; rhapontigenin is reported to have
antihyperlipidemic effects [32]; and tetramethoxystilbene has shown effects on the
treatment of breast cancer [33]. Even though there are extensive studies exploring the
therapeutic potential for stilbenes and many of the studies are targeting neurodegenerative
diseases, such as AD, few studies have explicitly investigated the interactions between
inhibitory effects of stilbenes on Aβ fibril formation, but this study lacks the insights of
inspecting stilbenes intervention with other Aβ species, such as oligomers and soluble
aggregates. Also, the technique applied to monitor Aβ aggregation under the effects of
stilbenes has limitations [35]. Thus, this research is aimed at filling this void by evaluating
stilbenes interfering effects with a variety of Aβ aggregated species which might play an
important role in the prevention and treatment of AD.
1.6 Specific Aims
This study evaluated stilbenes capabilities to alter the overall and individual
mechanistic steps of Aβ aggregation related with AD. Since native Aβ aggregates are toxic
and cause the initiation and development of AD, alterations of these Aβ aggregates away
from their native forms might have a beneficial effect on slowing the disease progression.
Stilbenes intervention with Aβ aggregation are described in Chapter 3 (resveratrol and
derivatives) and Chapter 4 (piceatannol and derivatives). In Chapter 5, native Aβ
aggregates interaction with lipid membranes, the location where the neurotoxic cascade of
Aβ may be initiated, was studied and compared with that of the piceatannol modified Aβ
9
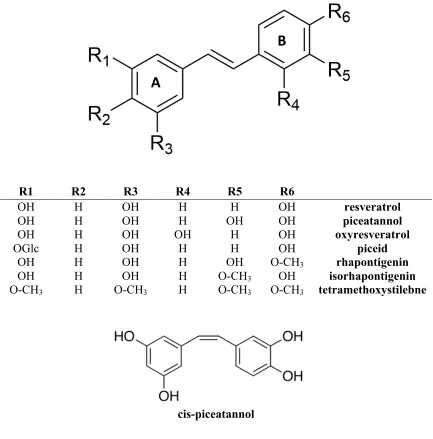
R1 R2 R3 R4 R5 R6
OH H OH H H OH resveratrol
OH H OH H OH OH piceatannol
OH H OH OH H OH oxyresveratrol
OGlc H OH H H OH piceid
OH H OH H OH O-CH3 rhapontigenin
OH H OH H O-CH3 OH isorhapontigenin
O-CH3 H O-CH3 H O-CH3 O-CH3 tetramethoxystilebne
cis-piceatannol
Figure 1.2 Stilbenes structures.
A
CHAPTER 2
MATERIALS AND METHODS
2.1 Materials
Aβ40 and Aβ42 used for this study were purchased either from AnaSpec (San Jose,
CA) or from Peptide 2.0 (Chantilly, VA). Thioflavin T (ThT), sodium chloride (NaCl),
sodium hydroxide (NaOH), phosphate buffered saline (PBS),
1,1,1,3,3,3-Hexafluoro-2-propanol (HFIP), chloroform, bovine serum albumin (BSA), 3,3’-dithioproponic acid
(DDP), N-hydroxy succinimide (NHS),
N-(2-dimethylamino-propyl)-N’-ethylcarbodiimide hydrochloride (EDC) and HEPES were purchased from Sigma-Aldrich
(St. Louis, MO). Rabbit-anti-amyloid fibrils antibody (LOC) was purchased from EMD
Millipore (Billerica, MA). Dimethyl sulfoxide (DMSO) and Tween-20 were purchased
from VWR (Radnor, PA). SuperSignal West Pico enhanced chemiluminescent substrate
(ECL) was purchased from Thermo Fisher Scientific (Waltham, MA). Mouse-anti-Aβ16
antibody (6E10) was purchased from Covance (Princeton, NJ). Horseradish peroxidase
(HRP) conjugated goat-anti-rabbit IgG, Precision Plus WesternC standard, Precision
Protein Strep Tactin-HRP conjugate, and Laemmli buffer were purchased from Bio-Rad
(Hercules, CA). HRP-conjugated sheep-anti-mouse IgG was purchased from GE
Healthcare (Piscataway, NJ). 8-Anilino-1-naphthalenesulphonic acid (ANS) was
Electron Microscopy Science (Hatfield, PA). Triethylene glycol monoamine was
purchased from Molecular Biosciences (Boulder, CO).
2.2 Preparation of Aβ40 Monomer
Lyophilized Aβ40 was stored at -20 ºC, desiccated in 1 mg aliquots. Before use,
Aβ40 was dissolved in 50 mM NaOH to yield an Aβ40 final concentration of 2 mg/mL and
incubated for 10 min. Aβ40 peptide has a theoretical isoelectric point near 5.31 [36], a pH
at which Aβ40 has zero net charge and low solubility that leads Aβ40 to aggregate and
precipitate. The use of NaOH avoids passage through this isoelectric point en route to a
neutral pH and, thus, the isoelectric precipitation of Aβ40 is eliminated. Subsequently, the
solution was injected onto a size-exclusion chromatography (SEC) Superdex 75 HR 10/300
column (GE Healthcare, Piscataway, NJ). SEC is a chromatographic method used to
separate macromolecules, such as proteins, based on their size. The column is packed with
beads of resin which form pore space for small molecules to enter, and therefore larger
molecules pass the column in a shorter route and elute earlier than smaller molecules. 40
mM Tris-HCl (pH 8.0) is used as the SEC running buffer. In order to reduce nonspecific
binding between Aβ40 and the dextran matrix of the column, the column was pretreated
with 2 mg/mL BSA before the injection of Aβ40. Monomeric Aβ40 was eluted in the volume
of 12-15 mL, as shown in Figure 2.1A. The Aβ40 monomer concentrations were determined
by UV spectrophotometry based on Beer-Lambert law (Eq. 2.1).
! = $%&'(/* Eq. 2.1
In the equation, the molar concentration of Aβ40 monomer (c) is calculated from
the UV absorbance at 276 nm wavelength (A276), the cuvette path length (d), which is fixed
for Aβ40 monomer [14]. Purified Aβ40 monomer samples were used immediately or stored
at 4 ˚C for up to 3 days to prevent self-aggregating.
2.3 Aβ40 Monomer Aggregation
SEC-isolated Aβ40 monomer was diluted in 40 mM Tris-HCl to a concentration of
20 µM. A DMSO dissolved compound was added to each monomer solution. A sample
with the addition of DMSO alone was prepared as a control to represent the native
aggregation of Aβ40 monomer without influence of compounds. Aggregation was
promoted by the addition of 150 mM NaCl. Samples were incubated at 25 ºC with
continuous agitation on vortex (500 rpm). At specific time points, along aggregation
process, reaction mixture was taken for analysis either by dot blot or dynamic light
scattering (DLS).
2.3.1 Dot Blot Monitoring
Antibody detection is a widely used method to quantify a particular protein that is
recognizable by the antibody utilized. For Aβ aggregates, there are two classes of
antibodies: sequence specific and conformational specific. Sequence specific antibodies,
such as 6E10 and 4G8, bind to specific regions of Aβ peptide, and thus recognize all Aβ
species regardless of their secondary structures, including monomers, oligomers and larger
aggregates. Conformational specific antibodies, such as A11 and LOC, recognize Aβ
species with certain structural elements, and thus provide information for the development
of secondary structures. In the case of monitoring Aβ aggregation, LOC is a perfect
indicator since it only binds to specific β-sheet structure and has limited affinity to Aβ
4 µL of reaction mixture was applied on a strip of 0.1 µm pore size nitrocellulose
membrane (Bio-Rad, Hercules, CA). The strips were blocked with blocking buffer – 5%
nonfat milk in phosphate buffered saline containing 0.1% Tween 20 (PBST) – overnight at
4 ºC. After blocking, the strips were washed 3 times for 5 min each via shaking in PBST
solution. Then, the strips were incubated with primary antibody LOC in blocking buffer
(1:5000) for 1 h with shaking at 25 ºC. Strips were then washed in PBST and subsequently
incubated with secondary antibody, HRP-conjugated goat-anti-rabbit IgG, in blocking
buffer (1:3000) for 45 min with shaking at 25 ºC. The strips were then washed again, and
chemiluminescence was enhanced with the ECL Chemiluminescence kit. Dot blot images
were acquired via a Bio-Rad ChemiDocTM XRS+ image system, and quantitative analysis
of LOC intensity was performed using Bio-Rad Image LabTM software. Results were
plotted as LOC antibody intensity versus time.
2.3.2 DLS Monitoring
DLS is a noninvasive method that has been used to determine size and shape
properties of macromolecules on a length scale of 1-1000 nm [37]. The general DLS set up
is shown in Figure 2.2A. A beam of light is focused onto a sample. An attenuator is often
used to adjust the laser power. Particles within the sample diffract the light in all directions,
including at a 90 degree angle, at which a detector measures and records real-time light
intensity. These scattered light intensities interfere with each other by destructive and
constructive additions and create a speckle pattern (Figure 2.2B). The speckle pattern
changes with time because there is a constant fluctuation in scattered light intensity caused
by the constant, random Brownian motion of particles in solution. The light intensity
diffusion coefficient. DLS, by obtaining the translational diffusion coefficient of particles
from changes in the speckle pattern, can calculate the hydrodynamic radius (RH, the radius
of a hypothetical hard sphere that has the same diffusivity with the particle under
examination) of the particles using Stokes-Einstein equation (Eq. 2.2), in which kB, T, h
and D are the Boltzmann constant, absolute temperature, solvent viscosity, and diffusivity
respectively.
+, = -./
'012 Eq. 2.2
Rather than directly measuring the intensity fluctuations arising from the Brownian
motion of particles, it is more efficient to use a digital auto correlator to compare the
similarity of light intensity between two time points and fit a correlation function for these
similarities at different time points. The rate of correlation change is informative for the
particle size: the slower the correlation reduces, the large the particles are. Various
algorithms can be used to obtain size information from the correlation function. The
equipment used in this study employs the Cumulant analysis, in which a single particle size
mode is assumed and a single exponential fit is applied to the correlation function. This
analysis calculates both the mean size of particles and the polydispersity that describes the
width of the assumed Gaussian distribution [38].
Applying DLS to monitor Aβ40 aggregation has two main concerns: Aβ40
aggregates have a complex structure and various Aβ40 species form a highly polydisperse
system. With respect to the first concern, the translational diffusion coefficient, in fact,
depends not only on the size of the particle, but also on the surface structures, and these
factors are not taken into consideration in RH calculations using the Stokes-Einstein
and different Aβ40 species exist in distinct conformations. This highly non-spherical shape
affects the diffusion speed to an extent that rotational diffusion must also be considered;
otherwise, the RH calculated will not represent the real size. With respect to the second
concern, Cumulant analysis assumes the sample is a single particle size mode and applies
a single exponential fit to the assumed Gaussian distribution. For protein analysis, percent
polydispersity less than 20% indicates the sample is monodisperse [38]. In order to fit a
Gaussian distribution, percent polydisperse cannot be larger than 57.1%. In contrast to
SEC-isolated soluble aggregates (more in detail in Section 2.9), an Aβ40 aggregation
reaction is highly polydisperse with a size range from as small as a few nanometers to
hundreds of nanometers, which results in difficulty and inaccuracy for the software to
calculate the representative mean RH. From our previous experiments, we observed that as
aggregation progressed, the reading of RH became highly unstable and the majority of the
data acquisitions have higher than 57.1% percent polydispersity. For the above limitations,
we did not use measurements of RH as an indicator of the extent of aggregation, but
alternatively used scattered light intensity whose magnitude is indicative of the overall
solution particles’ size and complex structure development, which is representative of
aggregation extent. A graph of intensity versus time for Aβ40 monomer aggregation has all
the components of a typical aggregation, namely, lag phase, growth phase and plateau
phase. Here, however, the intensity change is a combined result of both size growth and
conformational change.
12 µL of the reaction mixture was loaded into the cuvette located in a DynaPro
MSX DLS instrument (Wyatt Technology Corporation, Santa Barbara, CA). The incident
90 degree angle. Each measurement utilized 20 acquisitions with an acquisition time of 5
s. The average of 20 readings was used as the quantified intensity for that measurement to
minimize the influence of intensity fluctuation. Results were plotted as scattered light
intensity versus time.
2.4 Preparation of Aβ40 Fibril
SEC-isolated Aβ40 monomer was diluted in 40 mM Tris-HCl with addition of NaCl
to yield a solution with final concentrations of 60 µM Aβ40 monomer and 250 mM NaCl.
The reaction mixture was agitated continuously for at least 24 h at 800 rpm and 25 ºC to
obtain stable mature fibril. Then fibril was separated from monomer and other soluble
aggregate via centrifugation (14,000 rpm, 15 min). After the supernatant was removed, the
pellet was resuspended in the same volume of 40 mM Tris-HCl with the reaction mixture
solution in which fibrils were formed. The concentration of fibril was determined using the
original monomeric Aβ40 concentration (60 µM) corrected by measuring and comparing
ThT fluorescence for samples before and after centrifugation. ThT dye is widely used as
an indicator for Aβ monomer aggregation based on its fluorescent properties. After ThT
binds to β-sheet structures in amyloid aggregates, it displays an enhanced fluorescence with
a shifted excitation maximum from 385 to 450 nm and a shifted emission maximum from
445 to 482 nm. The emission spectrum was recorded by an LS-45 luminescence
spectrometer (PerkinElmer Inc., Waltham, MA) with excitation at 450 nm and emission
from 470 to 500 nm, and the integrated area under the emission curve is indicative of the
amount of β-sheet structures in solution. To accurately record the ThT fluorescence
subtracted from each reading. Fibril formed in this fashion was stored at 4 ºC for up to 2
weeks.
2.5 ThT Competition Assay
It has been reported that some aromatic small molecules can disrupt the binding of
ThT to β-sheet structure and cause a decrease in ThT fluorescence [35,39] which results in
an incorrect representation of Aβ aggregation extent in the presence of aromatic
compounds. To evaluate the viability of applying ThT fluorescence measurement for
monitoring Aβ monomer aggregation under the effects of compounds, it is necessary to
conduct a ThT competition assay. Pre-formed fibrils were incubated alone or in the
presence of compounds at 25 ºC for 15 min. Then, ThT fluorescence was measured and a
reduction of fluorescence relative to control indicates that ThT binding sites on fibrils’ β
-sheet structure were disrupted by the compounds, and thus Aβ aggregation extent would
be underestimated if using ThT fluorescence as an indicator.
2.6 Aβ40 Fibril Dissociation
Aβ40 fibril was prepared following the method described in Section 2.4. 20 µM
fibril was mixed with desired concentration of compound in 40 mM Tris-HCl and
incubated at 25 ºC with continuous agitation on vortex (500 rpm). 4 µL of reaction sample
was taken periodically to be examined in dot blot assay in the same manner as described
in Section 2.3.1.
2.7 Transmission Electron Microscopy
Transmission electron microscopy (TEM) is a common technique used to visualize
the morphology of protein aggregates based on a beam of electrons transmitting through
20 µL aliquots of the aggregation reactions at selected time points were placed onto
300-square mesh formvar-carbon supported copper grids (Electron Microscopy Science,
Hatfield, PA) for 3 min to allow samples to adsorb onto the grids. The excess sample
solution was wicked away, and the grid was allowed to air dry for 3 min. This process was
repeated a total of 3 times to ensure that the grids contain a sufficient quantity of samples
for visualization. Then, 20 µL of 2 % uranyl acetate was placed on each grid and wicked
away after 8 min. Uranyl acetate is a negative stain, which stains background so that it
appears dark in images, while the specimen remains unstained and light. The grids were
left under a fume hood overnight to dry. The dried grids were visualized using a JEOL
200CX transmission electron microscope (JEOL, Peabody, MA) at 120kV.
2.8 Preparation of Aβ42 Oligomer
Aβ42 monomer was used for preparation of oligomer because this isoform of Aβ
protein can aggregate into more stable oligomer at lower concentrations compared with
Aβ40. Aβ42 monomer was dissolved in DMSO to yield a 1.5 mM Aβ42 stock solution. This
stock solution was combined with 10 mM DMSO-dissolved compound. The solution was
then diluted in phosphate buffer containing NaCl to yield a solution with final
concentrations of 15 µM Aβ42 monomer, 150 µM compound and 1 µM NaCl. The reaction
mixture was incubated at 25 ºC without agitation for 30 min. Oligomer formed was used
immediately for Western blot (Section 2.8) after the addition of 0.1% Tween 20 or used
for ANS fluorescence measurement (Section 2.9) without the addition of Tween.
2.9 Aβ42 Oligomer Size Analysis by SDS-PAGE with Western Blot
SDS-polyacrylamide gel electrophoresis (PAGE) followed by immunoblotting
based on their size [40]. Aβ42 oligomer solutions formed in the absence (control) or
presence of compounds were mixed with Laemmli buffer (1:1), and 12 µL of each sample
was loaded onto a 4-20 % Tris-HCl gel (Bio-Rad, Hercules, CA). Precision-Plus protein
standard was loaded in parallel to indicate molecular weight. The gel electrophoresis was
carried out at 120 V for 60 min, and proteins on the gel were transferred onto a 0.2 µm
nitrocellulose membrane (Bio-Rad, Hercules, CA) at 14 V for 12 min via semi-dry blot
transfer on a Trans-blot SD semi-dry transfer cell (Bio-Rad, Hercules, CA). The membrane
was then blocked overnight at 4 ºC with blocking buffer (5 % nonfat milk in PBST). After
a PBST wash, the membrane was incubated with primary antibody 6E10 (1:1000) in
blocking buffer for 1 h, shaking at 25 ºC. As a sequence-specific antibody, 6E10 can bind
to the N-terminal region of all Aβ42 species independent of their size and conformation.
The membrane was then washed with PBST and incubated with HRP-conjugated goat
anti-mouse IgG antibody (1:2000) and Precision Protein StrepTactin-HRP conjugate (1:5000)
in blocking buffer for 45 min, shaking at 25 ºC. The Western blot image was acquired via
a Bio-Rad ChemiDocTM XRS+ image system, and quantitative analysis of band density
was performed using Bio-Rad Image LabTM software.
2.10 Aβ42 Oligomer Conformation Analysis with ANS Fluorescence
8-Anilino-1-naphtalenesulfonic acid (ANS) is a fluorescent probe which has been
used to examine the structural properties of Aβ42 oligomer [41,42]. ANS has a blue shifted
emission spectrum and an increased fluorescence intensity when binding to exposed
hydrophobic regions on protein surfaces. Thus, Aβ42 oligomer exhibiting a higher ANS
intensity has higher surface hydrophobicity. 50 mM DMSO dissolved ANS solution was
described in Section 2.6) to yield a final concentration of 1 µΜ Aβ42, 10 µΜ compound,
and 50 µΜ ANS. The ANS emission spectrum was recorded by an LS-45 luminescence
spectrometer with excitation at 350 nm and emission from 400 to 600 nm, and the
integrated area under the emission curve with background subtraction represents the ANS
intensity value of Aβ42 oligomer.
2.11 Preparation of Aβ40 Soluble Aggregate
SEC-isolated Aβ40 monomer was diluted to 100 µM in 40 mM Tris-HCl. With the
addition of 1-10 mM of NaCl and continuous agitation by vortexing (800 rpm), the
aggregation process was initiated and promoted. Aggregation was monitored by measuring
ThT fluorescence. As aggregation progressed, the reaction solution became a
heterogeneous system which was a mixture of unreacted monomers, desired soluble
aggregates, and mature fibrils. The reaction solution was first centrifuged (14,000 rpm, 15
min) to separate monomers and soluble aggregates from fibrils (which precipitated as a
pellet). Soluble aggregates were subsequently separated from monomers by SEC isolation
on a Superdex 75 column, where soluble aggregates eluted in the volume of 8-10 mL, as
shown in Figure 2.1B. The concentrations of SEC-isolated Aβ40 soluble aggregates were
determined from UV absorbance (276 nm), corrected for light scattering, and respective
ThT fluorescence measurements were recorded. The size of soluble aggregates was
measured by DLS. The soluble aggregates obtained in this manner has an average
hydrodynamic radius (RH) of around 100 nm. Aβ40 soluble aggregates were stored at 4 ˚C
for up to 3 days. Upon further use, ThT fluorescence measurements were taken to correct
for changes in concentrations, and DLS measurements were taken to validate the changes
2.12 Aβ40 Soluble Aggregate Association Monitored by DLS
Aβ40 soluble aggregates in a high ionic strength buffer and the absence of monomer
undergo an association process in which they increase their size by lateral interaction with
one another, and this size increase can be monitored by measuring the RH changes via DLS.
The association process was monitored by recording changes in RH instead of light intensity
because the monodisperse property of SEC-purified Aβ40 aggregate allows a consistent and
accurate RH measurement. SEC-isolated Aβ40 soluble aggregate was diluted in 40 mM
Tris-HCl in the absence (positive control) or presence of desired concentration of compounds.
Association was initiated by the addition of 150 mM NaCl. 12 µL of sample was loaded in
DLS cuvette for a continuous measurement of RH. The reaction sample without the addition
of NaCl was served as a negative control to ensure the stability of soluble aggregate.
Results were plotted as changes in RH versus time. The association rate was defined as the
slope of the linear regression of this plot, and a relative association rate was obtained by
normalizing each compound-containing sample’s association rate to that of the positive
control.
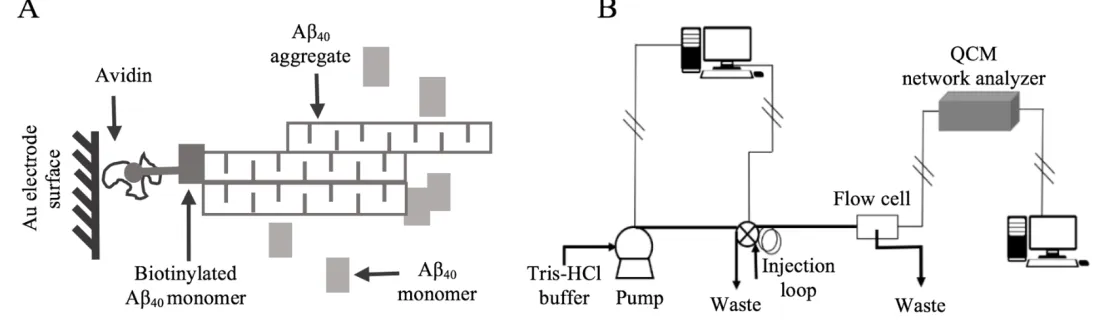
2.13 Aβ40 Soluble Aggregate Elongation Monitored by QCM
The quartz crystal microbalance (QCM) is a sensitive, robust, real-time technique
for the measurement of surface-specific changes in mass with minimal interference from
chemical tags or other artifacts. This technique has been applied widely in the field of
biotechnology, such as the detection of DNA, evaluation of protein interactions, and
quantification of liposome vesicle immobilization [43]. QCM utilizes the piezoelectric
property of quartz crystals, which enables a conversion between electricity and stress
fundamental frequency, it oscillates at a characteristic frequency, and this frequency can
be constantly measured and recorded. Oscillation frequency changes (Δf), as the mass is
deposited on the crystal, in a way that linearly related to the mass change (Δm) through
Sauerbrey’s equation (Eq. 2.3).
Δ4 = 5%678
9 :;<;Δ= Eq. 2.3
Thus, by continuously recording the crystal’s oscillation frequency change, the
real-time mass change corresponding to addition of monomer onto immobilized growing
aggregates can be sensitively measured. In Sauerbrey’s equation, the proportionality
coefficient is a function of the quartz crystal (Inficon, East Syracuse, NY) properties, in
which, fo is the fundamental resonant frequency of the crystal (9 MHz), A is the crystal’s
active surface area (34.19 mm2), ρq is the density of quartz (2.65 g/cm3), and µq is the shear
modulus of quartz, (2.947·1011 g/cm·sec2). One assumption underlying Sauerbrey’s
equation is that viscoelastic effects are negligible, and this assumption can be verified if
the dissipation change (∆D) to frequency change (∆f) ratio is less than 10-5 Hz-1. Dissipation
can be calculated by QTZ software (Resonant Probes, Goslar, Germany) [44]. In this case,
the sample can be considered sufficiently rigid and the effect of viscoelasticity is minimal
to the system.
Using QCM to measure Aβ40 soluble aggregate elongation with Aβ40 monomer
involves two steps: first, soluble aggregate was immobilized on the crystal surface through
amino-coupling chemistry; second, monomer was introduced into the system and
elongated on bound aggregate, as shown in Figure 2.3A.
The first step to immobilize Aβ40 soluble aggregate on the gold sensing electrode
with avidin protein. First, the top gold electrode was exposed to 5 mM DDP for 20 min for
the formation of thiol linkages with the gold surface. Then, the electrode was washed with
DI water and incubated with 300 µL 100 mg/mL NHS and 200 µL 100 mg/mL EDC for
another 20 min. This step activates the crystal to form reactive sites by interactions between
the N-hydroxy group of NHS and the bound carboxyl group. After rinsing with DI water,
the electrode surface was incubated with 0.2 mg/mL avidin in 100 mM HEPES for 1 h to
allow covalent binding of avidin to the crystal by displacing a succinimide group with a
primary amine group in avidin. Finally, the electrode was rinsed with DI water and
incubated with 2.7 M triethylene glycol monoamine to block any remaining active
succinimide sites to minimize the non-specific binding in later use. The
avidin-functionalized crystal was stored in 40 mM Tris-HCl and used within 3 days.
Upon use, the functionalized crystal was placed in a flow cell which was connected
to a high-precision reciprocating piston pump equipped with a switching valve, as shown
in Figure 2.3B. By injecting sample solution into a loop and pumping solution into the flow
cell at a predefined flowrate, the disturbance on crystal’s baseline frequency due to the
addition and removal of solution over the crystal was avoided.
After placing the functionalized crystal in the flow cell, Aβ40 soluble aggregate
immobilization on the crystal surface was completed by following two steps. First, 1000
µL of 5.5 µM biotinylated Aβ40 monomer was introduced into the flow cell to be
immobilized on the avidin-functionalized crystal via avidin-biotin coupling. Then,
unlabeled Aβ40 soluble aggregate was injected into the flow cell and captured by the
To measure elongation, a desired concentration of unlabeled Aβ40 monomer was
introduced into the system, and this process was continuously monitored by measuring the
mass increase. For the purpose of investigating the effects of compounds on elongation,
desired concentration of compound was first injected into the system before monomer
addition to allow free binding on Aβ40 soluble aggregate. A subsequent injection of Aβ40
monomer for elongation on compound-bound soluble aggregates reflects the effect of
compounds on elongation. Results were plotted as changes in mass versus time. The
elongation rate was defined as the slope of the linear regression of this plot, and relative
elongation rate was obtained by normalizing each compound affected elongation rate to
0 10 20 30 0
50 100 150 200
mL
mA
U
Figure 2.1 FPLC-SEC purification profile for Aβ40 monomer and Aβ40 soluble aggregate. Aβ40 monomer was eluted at the volume of 12-15 mL (panel A), and Aβ40
aggregate was eluted at the volume of 8-10 mL (panel B).
0 10 20 30
0 10 20 30 40
mL
mA
U
A B
27
Figure 2.2 DLS configuration and schematic representation of a speckle pattern [38]. (A) A beam of incident light
generated by a laser illuminates the sample in a cell. The incident light’s intensity can be adjusted by an attenuator. Light is scattered in all directions by particles within the sample, and a detector is located at a right-angle to collect the scattered light intensity information. The computer employs the Cummulant analysis method to transfer raw data into
hydrodynamic radius, RH. (B) The bright spots and the dark spots of speckle pattern are a result of scattered light
28
Figure 2.3Aβ40 soluble aggregate elongation monitored by QCM. (A) The avidin biotin chemistry was used to couple
Aβ40 aggregate to the surface and unlabeled Aβ40 monomer was captured by the previous bound aggregate through
CHAPTER 3
EFFECT OF RESVERATROL AND DERIVATIVES ON MODULATING
AMYLOID-β AGGREGATION AND ALTERING THE MORPHOLOGY OF AGGREGATES
3.1 Introduction
Identifying small molecules capable of inhibiting Aβ aggregation is one potential
route in developing an AD prevention, treatment and cure based on the fact that Aβ
aggregate species, not Aβ monomers, cause neurotoxicity. An Aβ fibril model established
by Petkova and colleagues [45] based on solid state nuclear magnetic resonance (NMR)
data illustrated a structure in which each Aβ peptide forms two parallel β-sheets by residues
12-24 and 30-40. Residues between these two β-sheets form a β-turn that bends the peptide
and brings the two β-sheets in contact through sidechain-sidechain interactions, such as the
salt bridge formed between residue D23 and residue K28. Since the core of Aβ fibrils are
residues 12-40, Aβ40 and Aβ42 monomers aggregate into fibrils in almost the same manner.
Aβ42 monomers, however, form more stable oligomers and were thus used to study
oligomerization. Other Aβ aggregation mechanistic steps, soluble aggregate elongation,
soluble aggregate association and fibril formation, were investigated using Aβ40 peptide.
Based on this model, small molecules that can disrupt hydrogen bonding, sidechain
interactions, or hydrophobic interactions of Aβ aggregates are potentially capable to inhibit
or alter aggregation process, and polyphenols is one class of molecules that have shown
hypothesized to play an important role in breaking the hydrophobic interactions since they
can interact with the two phenylalanine residues at position 19 and 20 via p-p stacking
interactions. The hydroxyl groups on the polyphenols were also believed to be important
because they can interfere with hydrogen bonding of the aggregates. In this chapter,
resveratrol (RES), piceatannol (PIC), oxyresveratrol (OXR) and piceid (PID) were
introduced into various mechanistic steps of Aβ aggregation with their effects on each
aggregation step evaluated. As shown in Figure 3.1, all the compounds have two phenyl
rings linked by a two-carbon bridge with 3-4 hydroxyl groups at different positions (RES,
PIC and OXR) or a replacement of a hydroxyl group with a glucoside (PID).
Compared with larger molecules, small molecules have the advantage of
penetrating the blood-brain barrier more easily. In general, to cross this barrier, molecules
need to be lipophilic and smaller than 500 Da in size. RES and its derivatives investigated
in this study have molecular weights ranging from 228 to 390 Da. In addition, within the
ChemAxon database their logP values range from 1.13-3.4. LogP is a quantity to express
partition coefficient between water and octanol, and a LogP less than 5 represents a
lipophilic compound. Therefore, RES and derivatives studied here should potentially be
able to pass through the blood-brain barrier. In fact, resveratrol’s abilities to penetrate the
blood-brain barrier and induce beneficial physiologic responses have been supported by
human clinical trials [46,47]. It is possible that resveratrol’s neuroprotective property is
related to its interaction with Aβ aggregation and thus it was investigated in this chapter.
To further understand the key molecule structures in inhibiting and altering Aβ
3.2 Materials and Methods
3.2.1 Preparation of Resveratrol and Derivatives
RES, PIC, OXR and PID were purchased from TCI America (Portland, OR). RES,
PIC and PID were stored at 4 ºC, and OXR was stored at -20 ºC. All compounds were
dissolved in DMSO at a concentration of 10 mM immediately prior to use to prevent
structural changes induced by storage in solvent.
3.2.2 ThT Competition Assay
As described in Section 2.5, pre-formed fibrils were diluted to 2.5 µM alone
(control) or in the presence of 12.5 µM compounds and incubated at 25 ºC for 15 min. With
the addition of 10 µM ThT, fluorescence was measured and compared to that of control.
3.2.3 Aβ40 Monomer Aggregation
To evaluate the overall inhibitory capabilities of resveratrol and derivatives,
monomer aggregation assays were conducted using dot blot monitoring technique as
described in Section 2.3.1 with the inclusion of 100 µM resveratrol and derivatives.
Furthermore, Aβ40 monomer aggregation under the effect of PIC was monitored using DLS
as described in Section 2.3.2.
3.2.4 Aβ40 Fibril Dissociation
Aβ40 fibril dissociation was performed as described in Section 2.6 with the addition
of 100 µM resveratrol and derivatives.
3.2.5 Transmission Electron Microscopy
TEM was utilized to evaluate the morphological changes of aggregates induced by
aggregation (Section 3.2.3) and Aβ40 fibril dissociation (Section 3.2.4) were prepared and
imaged as described in Section 2.7.
3.2.6 Aβ42 Oligomerization and Characterization
Aβ42 oligomerization was performed as described in Section 2.8 in the absence
(control) or presence of 150 µM resveratrol and derivatives. After 30 min incubation,
oligomers formed were used immediately for size analysis via SDS-PAGE and Western
blot as described in Section 2.9 after the addition of 0.1% Tween 20 or used for
conformation analysis via ANS fluorescence as described in Section 2.10 without the
addition of Tween.
3.2.7 Aβ40 Soluble Aggregate Association
Aβ40 soluble aggregate was prepared as described in Section 2.11. Soluble
aggregate association was performed as described in Section 2.12 with 2 µM soluble
aggregate. Association was initiated by the addition of 150 mM NaCl in the absence
(control) or presence of 50 µM resveratrol and derivatives.
3.2.8 Aβ40 Soluble Aggregate Elongation
Inhibition of Aβ40 soluble aggregate elongation was assessed as descried in Section
2.13. Elongation was initiated by the introduction of 30 µM monomer to 2 µM soluble
aggregate that was in exposure to 300 µM resveratrol and derivatives, or not (control).
3.3 Results
3.3.1 RES, PIC, and OXR Interfere with ThT Binding to Aggregate β-sheet Structure Some aromatic molecules have capabilities to disrupt the binding between ThT and
Aβ aggregates by competing with ThT for the binding sites on Aβ aggregates. Thus, the
that of Aβ aggregates alone. In this case, using ThT fluorescence as the technique for
monitoring Aβ aggregation would underestimate the aggregation extent and could lead to
a false positive for Aβ aggregation inhibition. In order to assess this potential complication,
resveratrol and derivatives’ ability to interfere with ThT fluorescence was investigated, and
results are shown in Figure 3.2. Incubation of Aβ fibrils with RES, PIC and OXR resulted
in a significant reduction of ThT fluorescence, with relative fluorescence values of 70±6
%, 58±1 % and 75±13 %, respectively. PID, on the other hand, does not alter ThT binding
with Aβ aggregates. Since the majority of compounds in this study interfere with ThT
binding, it would be misleading to monitor Aβ aggregation utilizing ThT fluorescence. As
a result, an alternative approach to evaluate Aβ aggregation was employed: dot blot with
immunocytochemistry. In dot blot assay, a conformational specific antibody, LOC, which
only recognizes aggregated not monomeric Aβ species, was utilized for monitoring
aggregation extent.
3.3.2 PIC Reduces LOC Dot Blot Intensity in Aβ Monomer Aggregation
As described in Section 1.3, there are three phases in the Aβ aggregation process:
a rate-limiting lag phase in which aggregation nuclei are formed; a growth phase in which
monomers interact with nuclei causing the sizes of intermediate aggregates to increase
rapidly and β-sheet structures to form; and a plateau phase in which monomers, soluble
aggregates and fibrils exist in equilibrium. When aggregation is monitored with LOC
antibody and dot blot, an aggregation growth curve with these three distinct phases is
observed (Figure 3.3).
Polyphenols can potentially interfere with aggregation in two ways: reducing the
presence of compound to that of control), or extending the time of lag phase, expressed as
relative lag (the ratio of lag time in the presence of compound to that of control). Aβ40
monomer aggregation in the presence of stilbenes was performed, and results are shown in
Figure 3.3. When aggregation growth curves were obtained (Figure 3.3B), the presence of
RES, OXR and PID in the aggregation process did not significantly extend the lag phase
nor reduce the plateau (Figure 3.3C). In contrast, PIC substantially altered aggregation, as
evidenced by a complete absence of LOC intensity as aggregation progresses (Figure 3.3B,
C).
3.3.3 PIC Reduces LOC Dot Blot Intensity of Pre-formed Aβ Fibrils
To additionally explore the possibility that PIC can disrupt Aβ fibrils after
aggregation has occurred, pre-formed Aβ fibrils were incubated alone (control), or with
resveratrol and derivatives. Samples periodically dotted for LOC antibody detection
(Figure 3.4A). In the first 2 h, there were no noticeable variations in LOC intensity,
representing that all samples started with mature Aβ fibrils rich in β-sheet structure.
However, after 5.5 h, fibrils incubated with PIC started to lose their binding affinity with
LOC, as evidenced by a decreased LOC intensity, while no such changes were observed in
other samples. At 26 h, PIC significantly reduced LOC intensity to as low as 3 % of control
(Figure 3.4B). The slow time course for the observed changes in LOC binding suggests
that PIC does not compete with LOC for the same binding sites on Aβ aggregates, but
suggests that PIC may dissociate aggregates.
3.3.4 PIC Induces Aβ Aggregate Conformational Change
The observed PIC-induced changes in LOC intensity may result from the ability of
result from the ability of PIC to disrupt aggregate conformation and thus LOC binding. To
differentiate between these possibilities, a non-conformational dependent technique, DLS,
was used to monitor Aβ aggregation under the effect of PIC. DLS measures the scattered
light intensity change, which correlates with the overall dynamic size and quantity of Aβ
aggregation species. Distinct from growth curves obtained from dot blot, light intensity
increased and then stabilized for the sample incubated with PIC, resulting in a growth curve
with three phases, similar to the control (Figure 3.5A). While PIC was unable to extend the
lag time, it significantly reduced plateau to 55±9 % of control (Figure 3.5B). The
discrepancy between a complete plateau reduction in the conformational dependent method
(LOC) and a partial plateau reduction in this non-conformational dependent method (DLS)
indicates that PIC does not abolish aggregation, but instead induces an aggregate
conformational change that alters LOC binding.
To further explore this hypothesis, TEM was used to visualize aggregates formed
following monomer aggregation in the presence of PIC and other resveratrol derivatives
(Figure 3.6A) as well as pre-formed fibrils incubated with resveratrol and derivatives
(Figure 3.6B). Aβ fibrils exhibit a straight, long and stacked rod-shape morphology. In
TEM images of both Aβ aggregates formed in the presence of PIC and Aβ fibrils incubated
with PIC, fibrils could be identified, providing further support for the hypothesis that PIC
induced a conformational change. Moreover, stilbenes studied in this work all induced
some variations for the morphology of Aβ fibrils from their typical structure, and changes
3.3.5 Effects of RES and Derivatives on AβOligomers Size Distribution and Surface Hydrophobicity
To investigate the step along the aggregation pathway where compounds intervene,
Aβ oligomerization was performed to examine the effect of resveratrol and derivatives in
the earlier stages of aggregation. Since oligomers are small in size and may lack β-sheet
structures, common size-dependent methods (DLS), or β-sheet-dependent methods (ThT
fluorescence and LOC antibody detection) cannot be readily used for evaluating
compounds’ effect on oligomers. Thus, SDS-PAGE with Western blot probed by sequence
specific 6E10 antibody was utilized for analyzing oligomers’ size distribution (Figure
3.7A). Resveratrol and derivatives failed to alter the quantity of both smaller oligomers
(25-100 kDa, closed bars) and larger oligomers (100-250 kDa, open bars).
To further probe oligomer conformational changes, stilbenes’ capability in altering
Aβ oligomer conformation was assessed using ANS fluorescence (Figure 3.7C). ANS is
commonly used as a probe to study proteins’ conformational changes. This dye increases
fluorescence when bound to hydrophobic regions on the protein surface. Thus, differences
in ANS fluorescence indicate conformation differences. Oligomers formed in the presence
of PIC exhibited the most substantial reduction in ANS fluorescence to as low as 53±6 %
of control, indicating a reduced surface hydrophobicity of oligomers and conformational
change. RES was also able to reduce ANS fluorescence to 76±5 % of control. In contrast,
the other two compounds exhibited no significant effects. The observation of surface
hydrophobicity change for oligomers formed in the presence of PIC provides further
support for the ability of PIC to alter Aβ aggregates’ conformations. Further, these changes
3.3.6 RES and Derivatives Selectively Inhibit Mechanistic-Specific Growth of Aβ
Soluble Aggregates
To determine whether stilbenes can intervene at intermediate stages of aggregation,
Aβ soluble aggregates were isolated and stimulated to grow in size by two mechanisms:
association, in which Aβ soluble aggregates increase in thickness via lateral interaction,
and elongation, in which Aβ soluble aggregates increase in length via monomer addition.
Aβ soluble aggregate association was initiated by addition of physiological salt to isolated
intermediates and evaluated by measuring changes in Aβ aggregates’ hydrodynamic radius
using DLS (Figure 3.8). PIC inhibited association with a decreased association rate as low
as 9±0.5 % of control. In contrast, PID promoted association with an increased association
rate as high as 143±6 % of control. Aβ soluble aggregate elongation was initiated by the
introduction of monomer across a quartz crystal surface onto which Aβ isolated
intermediates were immobilized. Elongation was evaluated by measuring changes in the
deposited mass on crystal (Figure 3.9). PIC again showed inhibition in elongation (53±4
%), but the inhibition effect was similar to that induced by OXR (64±9 %) and PID (45±7
%). In contrast, RES promoted elongation by increasing the elongation rate to 140±16 %
of control. These results indicate that different stilbenes all intervene with intermediate
stages of Aβ aggregation but they affect different mechanistic steps of soluble aggregates
growth distinctly.
3.4 Discussion
Stilbenes investigated in this study are natural small molecules widely found in
food and drinks, such as grapes and red wine. Their antioxidant, anti-inflammatory nature
![Figure 2.2 DLS configuration and schematic representation of a speckle pattern [38]. (A) A beam of incident light generated by a laser illuminates the sample in a cell](https://thumb-us.123doks.com/thumbv2/123dok_us/8393972.1385590/40.792.139.634.148.366/figure-configuration-schematic-representation-speckle-incident-generated-illuminates.webp)