Joint Sentence–Document Model for Manifesto Text Analysis
Shivashankar Subramanian Trevor Cohn Timothy Baldwin Julian Brooke
School of Computing and Information Systems University of Melbourne
[email protected],{t.cohn, tbaldwin, julian.brooke}@unimelb.edu.au
Abstract
Election manifestos document the inten-tions, motives, and views of political par-ties. They are often used for analysing party policies and positions on various is-sues, as well as for quantifying a party’s position on the left–right spectrum. In this paper we propose a model for auto-matically predicting both types of anal-ysis from manifestos, based on a joint sentence–document approach which per-forms both sentence-level thematic classi-fication and document-level position quan-tification. Our method handles text in multiple languages, via the use of mul-tilingual vector-space embeddings. We empirically show that the proposed joint model performs better than state-of-art ap-proaches for the document-level task and provides comparable performance for the sentence level task, using manifestos from thirteen countries, written in six different languages.
1 Introduction
Election manifestos are a core artifact in political text analysis. One of the widely used datasets by political scientists is the Comparative Manifesto Project (CMP) dataset, initiated byVolkens et al. (2011), that collects party manifestos from elec-tions in many countries around the world. The goal of the project is to provide a large data collec-tion to support political studies on electoral pro-cesses. A sub-part of the manifestos has been manually annotated at the sentence-level with one of over fifty fine-grained political themes, divided into 7 coarse-grained topics (see Table5). These are important because it can be seen as party posi-tions on fine-grained policy themes and also the
coded text can be used for various downstream tasks (Lowe et al.,2011). While manual annota-tions are very useful for political analyses, they come with two major drawbacks. First, it is very time-consuming and labor-intensive to manually annotate each sentence with the correct category from a complex annotation scheme. Secondly, coder preferences towards particular categories might lead to annotation inconsistencies and af-fect comparability between manifestos annotated by different coders (Mikhaylov et al.,2012). In or-der to overcome these challenges, fine and coarse-level manifesto sentence classification was ad-dressed using supervised machine learning tech-niques (Verberne et al., 2014; Zirn et al., 2016). Nonetheless, manually-coded manifestos remain the crucial data source for studies in computational political science (Lowe et al.,2011;Nanni et al., 2016).
Other than the sentence-level labels, the mani-festo text also has document-level signals, which quantify its position on the left–right spectrum (Slapin and Proksch, 2008). Though sentence-level classification and document-sentence-level quantifica-tion tasks are inter-dependent, existing work han-dles them separately. We instead propose a joint approach to model the two tasks together. Overall, the contributions of this work are as follows:
• we empirically study the utility of multi-lingual embeddings for cross-multi-lingual mani-festo text analysis — at the sentence (for 57-class 57-classification) and document-levels (for RILE score regression)
• we evaluate the effectiveness of modelling the sentence- and document-level tasks to-gether
document-level regression task.
2 Related Work
The recent adoption of NLP methods has led to significant advances in the field of Compu-tational Social Science (Lazer et al., 2009), in-cluding political science (Grimmer and Stew-art, 2013). Some popular tasks addressed with political text include: party position analysis (Biessmann, 2016); political leaning categoriza-tion (Akoglu, 2014; Zhou et al., 2011); stance classification (Sridhar et al., 2014); identifying keywords, themes & topics (Karan et al., 2016; Ding et al., 2011); emotion analysis (Rheault, 2016); and sentiment analysis (Bakliwal et al., 2013). The source data includes manifestos, po-litical speeches, news articles, floor debates and social media posts.
With the increasing availability of large-scale datasets and computational resources, large-scale comparative political text analysis has gained the attention of political scientists (Lucas et al.,2015). For example, rather than analyzing the political manifestos of a particular party during an election, mining different manifestos across countries over time can provide deeper comparative insights into political change.
Existing classification models, except (Glavaˇs et al.,2017), utilize discrete representation of text (i.e., bag of words). Also, most of the work an-alyzes manifesto text at the country level. Re-cent work has demonstrated the utility of neural embeddings for multi-lingual coarse-level topic classification (7 major categories) over manifesto text (Glavaˇs et al., 2017). The authors show that multi-lingual embeddings are more effective in the cross-lingual setting, where labeled data is used from multiple languages. In this work, we focus on cross-lingual fine-grained thematic classifica-tion (57 categories in total), where we have labeled data for all the languages.
For the document-level quantification task, much work has used label count aggregation of manually-annotated sentences as features (Lowe et al., 2011; Benoit and D¨aubler, 2014), while other work has used dictionary- based supervised methods, or unsupervised factor analysis based techniques (Hjorth et al., 2015; Bruinsma and Gemenis, 2017). The latter method uses discrete word representations and deals with mono-lingual text only. InGlavas et al.(2017), the authors
lever-age neural embeddings for cross-lingual EU par-liament speech text quantification with two pivot texts for extreme left and right positions. They represent the documents using word embeddings averaged with TF-IDF scores as weights. All these approaches model the sentence and document-level tasks separately.
3 Manifesto Text Analysis
In the CMP, trained annotators manually label manifesto sentences according to the 57 fine-grained political categories (shown in Table 5), which are grouped into seven policy areas: Exter-nal Relations, Freedom and Democracy, Political System, Economy, Welfare and Quality of Life, Fabric of Society, and Social Groups. Political parties either write their promises as a bulleted list of individual sentences, or structured as para-graphs (an example is given in Figure4), provid-ing more information on topic coherence. Also the length of documents, measured as the num-ber of sentences, varies greatly between mani-festos. The typical length (in sentences) over man-ifestos (948 in total) from 13 countries — Aus-tria, Australia, Denmark, Finland, France, Ger-many, Italy, Ireland, New Zealand, South Africa, Switzerland, United Kingdom and United States — is 516.7±667. Variance in the number of sen-tences across documents in conjunction with class imbalance makes automated thematic classifica-tion a challenging task.
While annotating, a sentence is split into multi-ple segments if it discusses unrelated topics or dif-ferent aspects of a larger policy, e.g. (as indicated by the different colors, and associated integer la-bels):
We need to address our close ties with our neighbours (107) as well as the unique challenges facing small business owners in this time of economic hard-ship. (402)
Such examples are not common, however.1 Also the segmentation was shown to be inconsistent and to have no effect on quantifying the propor-tion of sentences discussing various topics and document-level regression tasks (D¨aubler et al., 2012). Hence, consistent with previous work
1InD¨aubler et al.(2012), based on a sample of 15
(Biessmann, 2016;Glavaˇs et al., 2017), we con-sider the sentence-level classification to be a multi-class single-label problem. We use the seg-mented text when available (especially for evalua-tion), and complete sentences otherwise.
A manifesto as a whole can be positioned on the left–right spectrum based on the proportion of topics discussed. We use the RILE score, which is defined as the difference between the count of sentences discussing left- and right-leaning topics (Budge and Laver,1992):
RILE=X
r2R
perr X
l2L
perl (1)
where R and L denote right and left political
themes (see Figure 5), andpertdenotes the share
of each topic t as given in Table 5, per
docu-ment. Note that the RILE score is provided for al-most all the manifestos in the CMP dataset, but the sentence-level annotations are provided only for a subset of manifestos. That is, in some cases, the underlying annotations that the RILE score cal-culation was based on is often not available for a given manifesto.
4 Proposed Approach
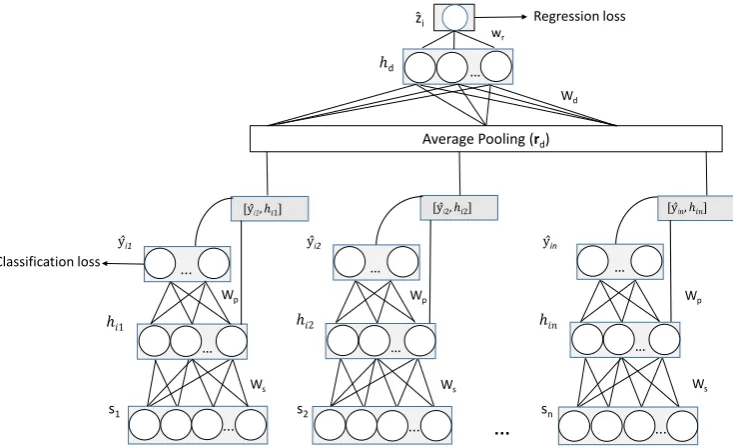
We propose a joint sentence–document model to classify manifesto sentences into one out of 57 categories and also quantify the document-level RILE score. The joint formulation is employed not only to capture the task inter-dependencies, but also to use annotations at different levels of gran-ularity (sentence and document) effectively — a RILE score is available for 948 manifestos from 13 countries, whereas sentence-level annotations are available only for 235 manifestos. We use a hierarchical neural network to model the sentence-level classification and document-sentence-level regression tasks. The proposed architecture is given in Figure 1. Since the text across countries is multi-lingual in nature, we use multi-lingual embeddings to rep-resent words (ew) (Ammar et al.,2016). We refer to the total set of manifestos available for train-ing asD, and the subset which is annotated with
sentence-level labels asDs. We denote each man-ifesto asd, which hasld sentences s1, s2, ..., sld.
We also use i to index documents (i=d)
wher-ever necessary to avoid ambiguity in differentiat-ing from sentence-level variables.
4.1 Sentence-level Model
We represent each sentence using the aver-age embedding of its constituent words, sj =
1
|sj|
P
w2sjew. The average embedding
represen-tation is given as input to a hidden layer with rec-tified linear activation units (ReLU) to get the hid-den representation. Finally, the predictions are ob-tained using a softmax layer, which takes the hid-den representation as input and gives the probabil-ity of 57 classes as output, denotedyˆij. We use the cross-entropy loss function for the sentence-level model. For sentences inDs, with ground truth la-belsyij (using a one-hot encoding), the loss func-tion is given as follows:
LS =
1
|Ds|
|Ds|
X
i=1 ld
X
j=1 K
X
k=1
yijklog ˆyijk (2)
4.2 Joint Sentence–Document Model
Using the hierarchical neural network, we model the sentence-level classification and document-level regression tasks together. In the joint model, we use an unrolled (time-distributed) neural net-work model for the sentences in a manifesto (d).
Here, the model minimizes cross-entropy loss for sentences over each temporal layer (j = 1. . . ld). We use average-pooling with the concatenated hidden representations (hij) and predicted output distributions (yˆij) of individual sentences, to rep-resent a document,2i.e.,r
d= |l1d|Pj2d
ˆ
yij
hij .
The range of RILE is [ 100,100], which we scale to the range [ 1,1]. Hence we use a
fi-nal tanh layer, with zˆi = w>rhd + b, where
hd=ReLU(Wd>rd). Since it is a regression task, we minimize the mean-squared error loss function between the predictedzˆiand actual RILE scorezi,
LD =
1
|D|
|D|
X
i=1
||zˆi zi||22 (3)
Overall, the loss function for the joint model, combining Equations2and3, is:
↵LS+ (1 ↵)LD (4)
where 0 ↵ 1 is a hyperparameter which is tuned on a development set.
We evaluate both cascaded and joint training for this objective function:
2We observed that the concatenated representation
…
Average Pooling (rd)
ℎ𝑖𝑖1 ℎ𝑖𝑖2 ℎ𝑖𝑖𝑛𝑛
ŷi1
[ŷi1,ℎ𝑖𝑖1] [ŷi2,ℎ𝑖𝑖2] [ŷi𝑛𝑛,ℎ𝑖𝑖𝑛𝑛]
ℎd
Wd
Ws
Wp
s1 s2 sn
Ws
Ws
Wp
Wp
Classification loss
... …
…... ...
… …
... … …
…
wr
Regression loss
ŷi2 ŷin
[image:4.595.93.460.73.297.2]ẑi
Figure 1: Hierarchical Neural Network for Joint Sentence–Document Analysis. s1, s2,...sn are input sentences (n=ld),WsandWpare shared across unrolled sentences. yˆijdenotes 57 classes andzˆidenotes the estimated RILE score
Cascaded Training: The sentence-level model
is trained usingDs, to minimizeLSin Equa-tion 2, and the pre-trained sentence-level model is used to obtain document-level rep-resentation rd for all the manifestos in the
training setD. Then the document-level
re-gression task is trained to minimizeLD from Equation 3. Here, the sentence-level model parameters are fixed when the document-level regression model is trained usingrd.
Joint Training: The entire network is updated
by minimizing the joint loss function from Equation 4. As in cascaded training, the sentence-level model is pre-trained using la-beled sentences. Here the sentence-level model uses both labeled and unlabeled data.
We use the Adam optimizer (Kingma and Ba, 2014) for parameter estimation. The proposed architecture evaluates the effectiveness of posing sentence-level topic classification as a precursor to perform document-level RILE prediction, rather than learning a model directly. We also study the effect of the quantity of annotated text at both the sentence- and document-level for the RILE predic-tion task.
5 Experiments
5.1 Setting
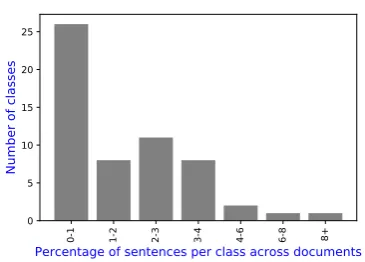
As mentioned earlier, we use manifestos collected and annotated by political scientists as part of CMP. In this work, we used 948 manifestos from 13 countries, which are written in 6 different lan-guages — Danish (Denmark), English (Australia, Ireland, New Zealand, South Africa, United King-dom, United States), Finnish (Finland), French (France), German (Austria, Germany, Switzer-land), and Italian (Italy). Out of the 948 mani-festos, 235 are annotated with sentence level la-bels (from Table5). We have RILE scores for all the 948 manifestos. Statistics about number of an-notated documents and sentences across languages are given in Table 1. Class distribution based on average percentage of sentences coded under each class is given in Figure 2. Top-3 frequent set of classes include 000 (above 8%) , 504 (6-8%) and 305 & 503 (4-6%); and 26 classes occur 0-1%.
We use off-the-shelf pre-trained multi-lingual word embeddings3to represent words. We empir-ically chose embeddings trained using translation invariance approach (Ammar et al., 2016), with size 512 for our work. The neural network model has a single hidden layer for all the sentence and document-level approaches.
Lang. # Docs (Ann.) # Sents (Ann.) Danish 175 (36) 32161 (8762) English 312 (94) 227769 (73682) Finnish 97 (16) 18717 (8503)
French 53 (10) 24596 (5559)
German 216 (65) 146605 (79507) Italian 95 (14) 40010 (4918)
[image:5.595.89.272.237.368.2]Total 948 (235) 489858 (180931)
Table 1: Statistics of dataset, ‘Ann.’ refers to an-notated at sentence level.
Figure 2: Class distribution based on average per-centage of sentences coded under each class
5.2 Sentence-Level Classification
We first compare traditional bag-of-words discrete representation with distributed neural representa-tion for words for fine-grained thematic classifica-tion, under mono-lingual training setting ( Mono-lingual). Hence we compare the following ap-proaches.
Bag-of-words (BoW-LR,BoW-NN): We use TF-IDF representation for sentences and build a model for each language separately. We use Logistic Regression classifier (Biessmann, 2016), which is referred asBoW-LR.We also use Neural Network classifier, which we refer to asBoW-NN.
Language-wise average embedding (AE-NNm): We build a neural network classifier per lan-guage, with average multi-lingual neural em-bedding as sentence representation.
Since distributed representation allows to lever-age text across langulever-ages, we evaluate the follow-ing approaches with combined trainfollow-ing sentences across languages (Cross-lingual).
Convolutional Neural Network (CNN):CNN was shown to be effective for cross-lingual man-ifesto text coarse-level topic classification (Glavaˇs et al., 2017). So, we evaluate CNN with a similar architecture — single convo-lution layer (32 filters with window size 3), followed by single max pooling layer and fi-nally a softmax layer. We use multi-lingual neural embeddings to represent words.
Combined average embedding (AE-NNc): We build a neural network classifier with training instances combined across languages, with average neural embedding as sentence repre-sentation. This is our proposed approach for sentence-level model.
Commonly for all empirical evaluations, we compute micro-averaged performance with 80-20% train-test ratio across 10 runs with random split (at document level), where the 80% split also contains sentence level annotated documents pro-portionally. Optimal model parameters we found for the proposed model (Figure1) are|hij|= 300 (for sentences),|hd|= 10. We compute F-score4to evaluate sentence classification performance. Sen-tence classification performance is given in Ta-ble2. Under mono-lingual setting (Table 2), us-ing word embeddus-ings did not provide better per-formance compared to bag-of-words.
Under cross-lingual setting, AE-NNc is the sentence-level neural network model. We use AE-NNc in the cascaded training for obtaining document-level RILE prediction. Note that in cascaded training, sentence and document-level models are trained separately in a cascaded fash-ion. Joint-training results where the sentence model is trained in a semi-supervised way together with document-level regression task is referred to as JTs. We set ↵=0.4 (in equation 4)
empiri-cally which gave the best score for both sentence and document-level tasks. We observed a trade-off in performance with different ↵, with lesser ↵ (0.1), document-level correlation increases (to
0.52) while sentence-level F-score decreases (to 0.33). Higher value of↵ (0.9) gives performance
closer to cascaded training. JTs has a compara-ble performance withAE-NNc. The proposed ap-proach (joint-training) does not provide any im-provement for the sentence classification task.
4Harmonic mean of precision and recall, https://
Mono-lingual Cross-lingual Lang. BoW-LR BoW-NN AE-NNm CNN AE-NNc JTs
da 0.29 0.35 0.24 0.30 0.28 0.30
en 0.36 0.38 0.42 0.40 0.42 0.41
fi 0.21 0.29 0.26 0.30 0.27 0.26
fr 0.28 0.36 0.24 0.36 0.37 0.38
de 0.30 0.31 0.31 0.31 0.31 0.33
it 0.32 0.33 0.25 0.30 0.32 0.26
[image:6.595.142.455.63.206.2]Avg. 0.32 0.34 0.35 0.34 0.36 0.35
Table 2: Micro-Averaged F-measure for sentence classification. Best scores are given in bold.
5.3 Document-Level Regression
For the document-level regression task, the fol-lowing are baseline approaches. Note that we use
tanhoutput for all the models, since the range of
re-scaled RILE is from -1 to +1.
Bag-of-words (BoW-NNd): We use TF-IDF rep-resentation for documents and build a neural network model for each language.
Average embedding (AE-NNd): We use average embedding of words as document representa-tion to build a neural network model.
Bag-of-Centroids (BoC):Here the word embed-dings are clustered into K different
clus-ters using K-Means clustering algorithm, and words (1-gram) in each document are as-signed to clusters based on its euclidean-distance (dist) to cluster-centroids (C) (
Le-bret and Collobert,2014),
cluster(w) = argmin
k dist(Ck, w). Finally, each document is represented by the distribution of words mapped to different clusters (1⇥Kvector). We use a neural
net-work regression model with bag-of-centroids representation. Results withK=1000, which
performed best is given in Table 3.
Sentence-level model and RILE formulation (AE-NNrile
c ): Here the predictions of sentence-level model (AE-NNc) are used directly with RILE formulation (equation (1)) to derive RILE score for manifestos.
Cross-lingual scaling (CLS): This is a recent unsupervised approach for cross-lingual po-litical speech text positioning task (Glavas
Approach MSE(#) r(")
BoW-NNd 0.054 0.23 AE-NNd 0.057 0.14
BoC 0.052 0.33
AE-NNrile
c 0.060 0.35
CLS – 0.24
Casd 0.050 0.41
JTd 0.044 0.47
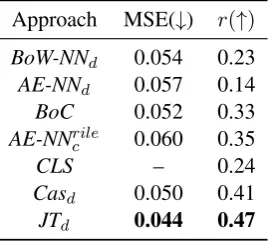
Table 3: RILE score prediction performance. Best scores are given in bold (higher is better forr, and
lower is better for MSE).
et al., 2017). Authors use average word-embeddings weighed by TF-IDF score to rep-resent documents.5 Then a graph is con-structed using pair-wise distance of docu-ments. Given two pivots texts for extreme left and right positions [-1, +1], label propagation approach is used to quantify other documents in the graph.
RILE score regression performance results are given in Table 3. Other than BoW-NNd all other approaches are cross-lingual. We evaluate document-level performance using mean-squared-error (MSE) and Pearson correlation (r). Since
CLSsolves it as a classification problem, MSE is not applicable. The proposed approach’s perfor-mance, using cascaded training is referred to as Casd and jointly trained model is referred to as JTd. Overall the jointly trained model performs best for document-level task, with a comparable performance at sentence-level task.
5We use this aggregate representation since it was shown
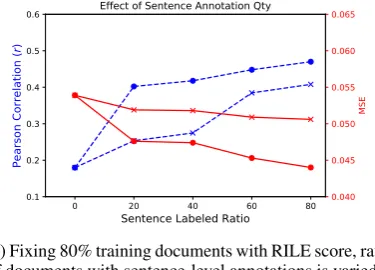
[image:6.595.350.485.250.371.2](a) Fixing 80% training documents with RILE score, ratio of documents with sentence-level annotations is varied.
[image:7.595.303.537.63.113.2](b) Fixing 80% training documents with sentence-level annotations, ratio of documents with RILE score is var-ied.
Figure 3: Study with Quantity of Annotation. In 3(a) and 3(b) cross(x) denotesCasdand circle(y)
denotesJTd
5.4 Quantity of Annotation
We measure the importance of annotated text at sentence and document-level for RILE score re-gression task. We vary the percentage of labeled data, while keeping the test sample size at 20% as before. In the first setting, we keep the training ratio of documents at 80%, within that 80% we in-crease the proportion of documents with sentence-level annotations — from 0 (document average embedding setting,AE-NNd)to 80%. Results are given in Figure3a. Similarly, in the other setting, we keep the training set with 80% sentence-level annotated documents (which is⇠20% of the total data), and add documents (with only RILE score), increasing the training set from 20 to 80%. Results of this study are given in Figure3b. We observed that, jointly-trained model uses sentence-level an-notations more effectively than cascaded approach (Figure3a) — even with less sentence-level anno-tations. Also, with less document-level signal (up to 40%) for training, both the approaches perform similarly (r). As the training ratio increases,
joint-training leverages both sentence and document-level signals effectively.
Approach MSE r
[image:7.595.79.267.65.200.2]stack 0.045 (0.001#) 0.49 (0.02") non-linear stack 0.048 (0.004#) 0.48 (0.01")
Table 4: RILE score prediction performance with countryinformation. Difference compared toJTd is given within paranthesis. "– improvement,#– decrease in performance
5.5 Use of Country Information
Since the definition of left–right varies between countries, we study the influence ofcountry infor-mation in the proposed model withjoint-training. We use two ways to incorporate country informa-tion (Hoang et al.,2016): (a)stack— one-hot en-coding (13 countries, 1⇥13 vector) of each mani-festo’scountryis concatenated with hidden repre-sentation of the document (rdin Figure1) (b) non-linear stack — one-hot-encoded country vector is passed through a hidden layer with tanh
non-linear activation and concatenated with rd. With both the models we observed mild improvement in correlation (given in Table4).
6 Conclusion and Future Work
Figure 4: Manifesto snippet for Democratic Party of USA, 2000 —R denotes sentence segment. See Table 5 for code description.
CMP Coding Scheme
• Domain 1. External Relations 411 Technology and Infrastructure: Positive 101 Foreign Special Relationships: Positive 412 Controlled Economy
102 Foreign Special Relationships: Negative 413 Nationalisation 103 Anti-Imperialism 414 Economic Orthodoxy
104 Military: Positive 415 Marxist Analysis
105 Military: Negative 416 Anti-Growth Economy: Positive
106 Peace
107 Internationalism: Positive • Domain 5: Welfare and Quality of Life 108 European Community/Union: Positive 501 Environmental Protection
109 Internationalism: Negative 502 Culture: Positive 110 European Community/Union: Negative 503 Equality: Positive
504 Welfare State Expansion
• Domain 2: Freedom and Democracy 505 Welfare State Limitation
201 Freedom and Human Rights 506 Education Expansion
202 Democracy 507 Education Limitation
203 Constitutionalism: Positive
204 Constitutionalism: Negative • Domain 6: Fabric of Society
601 National Way of Life: Positive
• Domain 3: Political System 602 National Way of Life: Negative
301 Decentralisation 603 Traditional Morality: Positive
302 Centralisation 604 Traditional Morality: Negative
303 Governmental and Administrative Efficiency 605 Law and Order: Positive
304 Political Corruption 606 Civic Mindedness: Positive
305 Political Authority 607 Multiculturalism: Positive
608 Multiculturalism: Negative • Domain 4: Economy
401 Free Market Economy • Domain 7: Social Groups
402 Incentives: Positive 701 Labour Groups: Positive
403 Market Regulation 702 Labour Groups: Negative
404 Economic Planning 703 Agriculture and Farmers: Positive 405 Corporatism/Mixed Economy 704 Middle Class and Professional Groups
406 Protectionism: Positive 705 Underprivileged Minority Groups
407 Protectionism: Negative 706 Non-economic Demographic Groups
408 Economic Goals
409 Keynesian Demand Management
410 Economic Growth: Positive 000 No meaningful category applies
References
Leman Akoglu. 2014. Quantifying political polarity based on bipartite opinion networks. InAAAI. Waleed Ammar, George Mulcaire, Yulia Tsvetkov,
Guillaume Lample, Chris Dyer, and Noah A Smith. 2016. Massively multilingual word embeddings.
arXiv preprint arXiv:1602.01925.
Akshat Bakliwal, Jennifer Foster, Jennifer van der Puil, Ron O’Brien, Lamia Tounsi, and Mark Hughes. 2013. Sentiment analysis of political tweets: To-wards an accurate classifier. InACL.
Kenneth Benoit and Thomas D¨aubler. 2014. Putting text in context: How to estimate better left-right po-sitions by scaling party manifesto data using item re-sponse theory. InMapping Policy Preferences from Texts Conference.
Felix Biessmann. 2016. Automating political bias pre-diction. InarXiv:1608.02195.
B. Bruinsma and K. Gemenis. 2017. Validating Word-scores. ArXiv e-prints.
Ian Budge and Michael Laver. 1992. Party policy and government coalitions. St. Martin’s Press New York.
Thomas D¨aubler, Kenneth Benoit, Slava Mikhaylov, and Michael Laver. 2012. Natural sentences as valid units for coded political texts.British Journal of Po-litical Science.
Zhuoye Ding, Qi Zhang, and Xuanjing Huang. 2011. Keyphrase extraction from online news using binary integer programming. InIJCNLP.
Goran Glavaˇs, Federico Nanni, and Simone Paolo Ponzetto. 2017. Cross-lingual classification of top-ics in political texts. InACL WS.
Goran Glavas, Federico Nanni, and Simone Paolo Ponzetto. 2017. Unsupervised cross-lingual scaling of political texts. InEACL.
Justin Grimmer and Brandon M Stewart. 2013. Text as data: The promise and pitfalls of automatic content analysis methods for political texts. Political analy-sis.
Frederik Hjorth, Robert Klemmensen, Sara Hobolt, Martin Ejnar Hansen, and Peter Kurrild-Klitgaard. 2015. Computers, coders, and voters: Comparing automated methods for estimating party positions.
Research & Politics.
Cong Duy Vu Hoang, Gholamreza Haffari, and Trevor Cohn. 2016. Incorporating side information into recurrent neural network language models. In
NAACL-HLT.
Mladen Karan, Jan ˇSnajder, Daniela ˇSirinic, and Goran Glavaˇs. 2016. Analysis of policy agendas: Lessons learned from automatic topic classification of croat-ian political texts. InLaTeCH.
Diederik P. Kingma and Jimmy Ba. 2014. Adam: A method for stochastic optimization. CoRR
abs/1412.6980.
David Lazer, Alex Sandy Pentland, Lada Adamic, Sinan Aral, Albert Laszlo Barabasi, Devon Brewer, Nicholas Christakis, Noshir Contractor, James Fowler, Myron Gutmann, et al. 2009. Life in the network: the coming age of computational social science.Science (New York, NY)323(5915):721. R´emi Lebret and Ronan Collobert. 2014.
N-gram-based low-dimensional representation for document classification.arXiv preprint arXiv:1412.6277. Will Lowe, Kenneth Benoit, Slava Mikhaylov, and
Michael Laver. 2011. Scaling policy preferences from coded political texts. In Legislative studies quarterly. Wiley Online Library.
Christopher Lucas, Richard A Nielsen, Margaret E Roberts, Brandon M Stewart, Alex Storer, and Dustin Tingley. 2015. Computer-assisted text anal-ysis for comparative politics. Political Analysis
23(2):254–277.
Slava Mikhaylov, Michael Laver, and Kenneth R Benoit. 2012. Coder reliability and misclassification in the human coding of party manifestos. In Politi-cal Analysis.
Federico Nanni, C¨acilia Zirn, Goran Glava˘s, Jason Ei-chorst, and Simone Paolo Ponzetto. 2016. Topfish: topic-based analysis of political position in us elec-toral campaigns. InPolText.
Ludovic Rheault. 2016. Expressions of anxiety in po-litical texts. InNLP+ CSS 2016. page 92.
Jonathan B Slapin and Sven-Oliver Proksch. 2008. A scaling model for estimating time-series party posi-tions from texts. Wiley Online Library, volume 52, pages 705–722.
Dhanya Sridhar, Lise Getoor, and Marilyn Walker. 2014. Collective stance classification of posts in on-line debate forums. InACL.
Suzan Verberne, Eva D’hondt, Antal van den Bosch, and Maarten Marx. 2014. Automatic thematic clas-sification of election manifestos. In Information Processing & Management.
Andrea Volkens, Onawa Lacewell, and Sven Regel Henrike Schultzeand Annika Werner. Pola Lehmann. 2011. The manifesto data col-lection. manifesto project (mrg/cmp/marpor). In
Wissenschaftszentrum Berlin fur Sozialforschung (WZB).
Daniel Xiaodan Zhou, Paul Resnick, and Qiaozhu Mei. 2011. Classifying the political leaning of news arti-cles and users from user votes. InICWSM.