Article
1
A Quantum Hybrid PSO Combined with Fuzzy K-NN
2
Approach to Feature Selection and Cell Classification in
3
Cervical Cancer Detection
4
Abdullah M. Iliyasu 1, 3, 4, * and Chastine Fatichah 2
5
1 Electrical Engineering Department, College of Engineering, Prince Sattam Bin Abdulaziz University,
Al-6
Kharj 11942, KSA
7
2 Informatics Department, Institut Nepuluh Nopember, ITS Campus, Surabaya 60111, Indonesia
8
3 School of Computing, Tokyo Institute of Technology, Yokohama 226-8502, Japan
9
4 School of Computer Science and Technology, Changchun University of Science and Technology,
10
Changchun 130022, China
11
* Correspondence: [email protected]; +966-115-888-8259
12
Abstract: A quantum hybrid (QH) intelligent approach that blends the adaptive search capability
13
of the quantum-behaved particle swarm optimisation (QPSO) method with the intuitionistic
14
rationality of traditional fuzzy k-nearest neighbours (Fuzzy k-NN) algorithm (known simply as the
15
Q-Fuzzy approach) is proposed for efficient feature selection and classification of cells in cervical
16
smeared (CS) images. From an initial multitude of seventeen (17) features describing the geometry,
17
colour, and texture of the CS images, the QPSO stage of our proposed technique is used to select the
18
best subset features (i.e. global best particles) that represent a pruned down collection of seven (7)
19
features. Using a dataset of almost 1000 images, performance evaluation of our proposed Q-Fuzzy
20
approach assesses the impact of our feature selection on classification accuracy by way of three
21
experimental scenarios that are compared alongside two other approaches: The All-features (i.e.
22
classification without prior feature selection) and another hybrid technique combining the standard
23
PSO algorithm with the Fuzzy k-NN technique (P-Fuzzy approach). In the first and second scenarios,
24
we further divided the assessment criteria in terms of classification accuracy based on the choice of
25
best features and those in terms of the different categories of the cervical cells. In the third scenario,
26
we introduced new QH hybrid techniques, i.e. QPSO combined with other supervised learning
27
methods, and compared the classification accuracy alongside our proposed Q-Fuzzy approach.
28
Furthermore, we employed statistical approaches to establish qualitative agreement with regards to
29
the feature selection in scenarios 1 and 3. The synergy between the QPSO and Fuzzy k-NN in the
30
proposed Q-Fuzzy approach marginally improves classification accuracy as manifest in the
31
reduction in number cell features, which is crucial for effective cervical cancer detection and
32
diagnosis.
33
Keywords: computational intelligence; quantum hybrid intelligent systems; quantum machine
34
learning; medical image processing; disease diagnosis; Fuzzy k-NN; Quantum-behaved PSO;
35
cervical smear images; cancer detection
36
37
1. Introduction
38
Hybrid intelligent systems (HIS) simultaneously integrate (or combine) two or more intelligent
39
approaches, such as fuzzy techniques, genetic algorithms, neural networks, agent-based techniques,
40
case-based reasoning and other computationally (or artificially) intelligent approaches, conducive to
41
overcome individual limitations and achieve synergetic outcomes. Such hybridisation offers the
42
capability to handle real world complex problems involving imprecision, uncertainty, vagueness,
43
high-dimensionality, etc. [1]. HIS systems are applied in almost every area of life, but notable
44
applications can be found in science, technology, business, commerce, and medicine.
45
Cervical cancer is one of the most common lethal malignant diseases among women. Thankfully,
46
however, with improvement in medical technologies, over the past few years, it is easier to detect
47
such disease at an early stage by doing Pap smear image tests. These tests typically involve filtering
48
out abnormal cervical cells [2] and use of the results to detect precancerous changes in cervical cells
49
based on colour and shape properties of their nuclei and cytoplasm [3]. Screening for cervical cancer
50
by Pap smear image tests provide an inference regarding the presence of the Papilloma virus that is
51
responsible for cervical cancer [4]. However, performing the Pap smear test manually is known to be
52
a time consuming and error-prone exercise that is further exacerbated by the lack of adequate
53
pathology expertise [5]. In addition, due to subjective disparity from different cytologists, the results
54
of the screening often show a lot of inconsistencies [6]; thereby further compromising the screening
55
process [7]. Moreover, since hundreds of images need to be analysed daily, the manual screening
56
process to classify the cells is a challenging pursuit that is susceptible to error [8]. A Single cell from
57
the Pap smear test can be classified into one of seven classes [9-12], which are Superficial squamous,
58
Intermediate Squamous, Columnar, Mild dysplasia, Moderate dysplasia, Severe dysplasia, and
59
Carcinoma in situ.
60
Meanwhile, in furtherance of improving the accuracy of automated cervical cell detection
61
systems, dynamic segmentation techniques are required to delineate the contours of the cytoplasm
62
and nucleus in the cell images from Pap smear tests. This has led to the proposal of numerous
63
approaches aimed at improving the assessment of Pap smear image test results.
64
Some studies related to the cervical cancer detection classification of various cervical cell features
65
are presented in [8-14]. The study in [8] uses fourteen (14) features and five (5) classifiers to validate
66
their classification results with focus on digital imaging colposcopy. In [11], a neuro-fuzzy method
67
was used to classify the twenty (20) features in cervical cell types; while in [13] an automatic cervical
68
cell segmentation and classification method was applied on three datasets of Pap smeared images.
69
Therein, nine (9) features were used and the results obtained were compared alongside five other
70
classification methods. A support vector machine technique based on recursive feature elimination
71
(SVM-RFE) was used to select the features and classify the cervical cell types in [14]. In that study,
72
eleven (11) nuclei features and nine (9) cytoplasm features were used to differentiate the cervical cell
73
types. The study in [14] combined four (4) feature selection approaches with the traditional support
74
vector machine (SVM) algorithm in order to classify the cell types. It was reported therein that the
75
accuracy of the classification results depended on good choice of features, which further indicates the
76
importance of choosing the best subset of features enhances to accuracy of classification results.
77
In terms of feature selection, three (3) methods: filter, wrapper, and hybrid methods, are widely
78
used in the literature. The filter method is considered computationally fast, easy to interpret, and is
79
scalable for high-dimensional data [15]. Nonetheless, equipped with advanced machine learning
80
algorithms to select the best feature subsets, the wrapper and hybrid methods are known to
81
demonstrate better performances than the filter methods. Besides, hybrid methods commonly use
82
supervised learning techniques and swarm-based intelligent methods as integral components of their
83
feature selection. Many previous studies utilised the swarm intelligence algorithms for their feature
84
selection stages, among which is the particle swarm optimisation (PSO) that is widely used to solve
85
optimisation problems [17].
86
Recently, quantum machine learning, which is an approach integrating quantum mechanics into
87
traditional machine learning approaches, has been used to further understand and enhance the
88
learning process. One of such techniques is the quantum-behaved particle swarm optimisation
89
(QPSO), which is a variant of the standard PSO algorithm, that was proposed in [18] by exploiting
90
some proven properties of quantum mechanics. Among other superlative properties, QPSO
91
eliminates the velocity term and control parameters that are used in the traditional PSO approach
92
[17]. This ensures that, in comparison with the original PSO algorithm [18], the QPSO offers improved
93
performance in terms of its search capability.
94
Since that effort, numerous approaches have been suggested to further enhance the QPSO.
95
Among them, a new QPSO (NQPSO) algorithm was proposed in [19] to further improve on the QPSO
96
Similarly, in [20] an improved QPSO (IQPSO) algorithm was proposed and utilised for visual features
98
selection (VFS). Overall, the standard QPSO approach was proposed to deal premature convergence,
99
and it is simple and easy to understand [19]. The use of a global optimal to determine the best subset
100
features makes the QPSO a veritable choice to accelerate convergence in feature selection tasks.
101
Therefore, the study presented in this work exploits the proven versatility of the QPSO
102
algorithm as the main component of a new hybrid approach for selecting features of cervical cells in
103
Pap smeared images by blending the QPSO with the intuitionistic descriptiveness of Fuzzy k-Nearest
104
Neighbours (Fuzzy k-NN) algorithms. Specifically, the best choice of subset features is enhanced by
105
combining the QPSO with the Fuzzy k-NN, which itself is an extension of the k-nearest neighbours
106
(k-NN) algorithms but with fuzzy intuition integrated into it [21-23]. As envisaged, this hybridisation
107
leads to modest improvements in cervical cell classification accuracy.
108
To validate the expected potency of the proposed technique, the Herlev dataset [24], which
109
contains original and segmented images collated using the CHAMP software [10-12], is used. To
110
establish the cogency of the outcomes from our proposed technique, we utilised seventeen (17)
111
geometric, chromatic, and textural features that are employed in some available literature [3, 11, 12]
112
to describe our cervical cell images. The acuteness of the QPSO unit of the proposed technique
113
ensures that the best features are selected and then pruned down to a collection of seven (7) features.
114
This feature selection step, combined with the rationality from the Fuzzy k-NN guarantees
115
improvement in cell classification accuracy, which is crucial in cervical cancer prediction.
116
The remainder of the paper is organised as follows: advances in cervical cell classification for
117
smeared images are highlighted in the next section as well as a succinct overview of the QPSO and
118
Fuzzy k-NN algorithms including arguments supporting their adoption as the core units of our
119
proposed approach to feature selection and cell classification for cervical cancer detection. These two
120
units and how they coalesce into our quantum hybrid (QH) system are discussed in Section 3, while
121
experimental results to demonstrate the utility of our proposed technique are reported in Section 4.
122
2. Overview of cell classification in smeared cervical images, quantum-behaved PSO and fuzzy
123
K-NN
124
As mentioned earlier, in this section we will highlight the advances made in cell classification
125
for smeared cervical images. Additionally, we will present a succinct overview of the QPSO and
126
Fuzzy k-NN algorithms and conclude with a few arguments supporting their adoption as the core
127
units of our proposed approach to feature selection and cell classification in cervical cancer detection.
128
2.1. Cell classification in smeared cervical images
129
Cervical cancer is a malignant cancer that forms in cervical tissues (i.e. the organ that connects
130
the uterus to the vagina) [14]. The Pap smear image test is one of the first procedures used to extract
131
medical inference regarding the presence of the Papilloma virus, which is known to be responsible
132
for causing cervical cancer [3]. Pap Smear image tests also provide a window for early detection and
133
treatment before the condition deteriorates [6]. A single cell pap smear image can be classified into
134
one of the seven classes presented in Table 1 [9-12].
135
As seen from the table, abnormal cervical cells that have undergone precancerous changes
136
(called a dysplastic cell) are further divided into four main phases. The first phase, called mild
137
dysplasia, occurs when the nucleus grows larger and brighter than normal. In the second phase,
138
called moderate dysplasia, the nucleus becomes darker and larger in size. The third phase, known as
139
severe dysplasia, occurs when the size and texture of both the nucleus and cytoplasm change: the
140
nucleus grows (in size) while becoming darker with strange shapes; and the cytoplasm also becomes
141
darker but smaller in size. The last phase, known as Carcinoma in situ, is characterised by a very
142
large nucleus and it occurs at a point when cytology strongly suggests malignancy.
143
Table 1. Classification of Pap smear single image cell types
145
1 Normal cells
Superficial squamous Intermediate squamous
Columnar
2 Abnormal cells
Mild dysplasia Moderate dysplasia
Severe dysplasia Carcinoma in situ
Knowledge of these cell attributes allow us to describe cells in cancerous and precancerous
146
stages since they are marked by many changes in morphology and architecture, including geometry
147
(in terms of both shape and size) of the cytoplasm and nucleus, changes in nuclear-cytoplasm ratios,
148
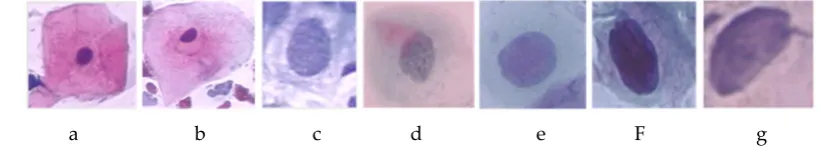
and others [15-17]. Some sample results for Pap smear image tests are shown in Figure 1.
149
a b c d e F g
Figure 1. A single cell cervical smear image: (a) Superficial squamous, (b) Intermediate Squamous, (c)
150
Columnar, (d) Mild dysplasia, (e) Moderate dysplasia, (f) Severe dysplasia, (g) Carcinoma in situ
[9-151
11].
152
2.2. Quantum-behaved Particle Swarm Optimisation (QPSO)
153
Quantum computing is a new and exciting computing paradigm that is tailored towards
154
exploiting the physical attributes of quantum mechanics to harness information processing [25].
155
Many new applications have been proposed either for use with quantum computing hardware or
156
just to exploit some of the confounding properties of quantum mechanics to enhance traditional
157
computing protocols, notably those in the areas of image processing, quantum machine learning
158
(QML), and general areas of computational intelligence [25-28].
159
QML, which incorporates integration of ‘quantumness’ into traditional machine learning
160
algorithms, and its application in different domains is an emerging sub-discipline that seems to
161
receiving increased attention [34]. Among others, a major objective of this study is to explore the
162
integration of QML techniques (specifically, QPSO) in image-based cervical cancer detection [34, 35].
163
We begin our discussion of the QPSO with a pithy highlight of the standard particle swarm
164
optimisation (PSO) algorithm. PSO was proposed (by Eberheart and Kennedy in 1995 [21]) to mimic
165
the social behaviour of a swarm of birds searching for food in a predefined space with each of them
166
behaving in accordance with the expected intelligence of the swarm population in such an
167
environment [20]. Furthermore, the scenario imposes the additional restriction that there is only one
168
source of food and none of the birds has prior knowledge of this location. Although rather
169
inefficacious, based on the foregoing scenario, the easiest solution would be to trail any bird that
170
perchance stumbles into this location. Consequently, all the birds in the population would traverse
171
(albeit, randomly) the same path to the food source irrespective of their own proximity to the source
172
and the remaining birds in the population. In PSO parlance, each single solution in the search space
173
is called a particle, like a bird. PSO is initialised with random particles (solutions) and an optimal
174
solution is determined within the search space by updating each generation. All particles have fitness
175
values and velocities with which they fly over the search space as they follow paths covered by
176
particles that are perceived as better solutions [19].
177
The d dimension of the ith particle is represented as Xi = (xi1, xi2,…,xid) and for each generation
178
each particle is updated using two ‘best’ values [15]. The first of these solutions, called Pi_best (personal
179
best value of any particle in the population. The fitness function of particle X (denoted as F(X)), is
181
defined using the F1 score (which will be presented much later in Eq. (29)).
182
The quantum-behaved version of the PSO (i.e. the QPSO) was proposed to improve on the
183
capabilities of the PSO algorithm. In it, the probability of the particle appearing in position X may be
184
obtained from the quantum mechanical interpretation of the wave function of the particle at current
185
position (t) as described in Eq. (1) [20].
186
( ) = 1 | ( ) ( )| (1)
187
where the parameter Q depends on the mean of best and current positions of the particles and it helps
188
to specify the search scope for a particle; and mbest is calculated as the mean of the best positions of all
189
particles (S) in the population, such that:
190
=1 _ . (2)
191
The parameter Q and the position X are updated according to the constraints in Eqs. (3) to (5).
192
( ) = 2. ∝. | ( ) − ( )|, (3)
193
( + 1) = ( )−∝. | ( ) − ( )|. ( ), if ( ) ≥ 0.5 (4)
194
and
195
( + 1) = ( )−∝. | ( ) − ( )|. ( )1 , if ( ) < 0.5, (5)
196
where u and s are uniformly distributed random numbers in the interval (0, 1); the parameter α is the
197
contraction-expansion coefficient [18]; and p(t) takes the form defined in Eq. (6).
198
( ) = ( ). _ ( ) + 1 − ( ) . ( ), (6)
199
where φ is a uniformly distributed random number in the interval (0,1), and to update the new best
200
position of particle I (Pi_best(t+1)), Eq. (7) is used.
201
_ ( + 1) =
( ), ( ) > _ ( )
_ ( ), ( ) ≤ _ ( )
(7)
202
The Pseudocode in Table 2 outlines the steps to execute the QPSO algorithm (as discussed in [18,
203
19]).
204
Table 2. Pseudocode for executing the QPSO algorithm [18, 19].
205
Initialise the current positions and the Pi_best positions of all the particles
206
Do
207
Calculate mbest in Eq. (2)
208
Select a suitable value for α
209
For particles i = 1 to S
210
1. Calculate the fitness value of particle i according to classification accuracy
211
2. Update Pi_best and Pglobal in Eq. (7)
212
3. For dimension 1 to d
213
ϕ = rand (0,1)
214
u = rand (0,1)
215
If s = rand (0,1) ≥ 0.5
216
update particle positions in Eq. (4)
217
else
218
update particle positions in Eq. (3)
219
As outlined in the pseudocode, each particle is encoded into a binary string whose length is
221
equal to the size of feature vector. A value ‘1’ indicates that a feature is selected whereas a value ‘0’
222
indicates otherwise. In this manner, each particle is encoded into a binary string as presented in Eq.
223
(8) and further depicted in Figure 2 [19].
224
= 1, if ( ) > (0,1)
0, otherwise, (8)
225
where Sigmoid(x) = 1/(1+e-x) and U(0,1) is a uniformly distributed random number in the interval (0,1).
226
The 100101 six-bit string depicting a particle (shown in Figure 2), shows that the first, fourth and
227
sixth features are selected, whereas the second, third and fifth features are not selected. The fitness
228
value of each particle is calculated based on the accuracy of the classification results.
229
Particle
1 0 0 1 0 1
Figure 2. Illustration of particle encoded as a binary string where the bit value ‘1’ denotes a selected
230
feature and ’0’ denotes a non-selected feature.
231
2.3. Fuzzy k-nearest neighbours (Fuzzy k-NN)
232
Fuzzy k-nearest neighbours (Fuzzy k-NN) is an extension of the standard k-nearest neighbours
233
(k-NN) algorithm but with fuzzy intuition is integrated into it [22]. More precisely, fuzzy theory is
234
used to generalise definitions of the k-NN membership values of the data in each class as defined in
235
Eq. (9).
236
( , ) =∑ ( , ). ( , )
∑ ( , ) , (9)
237
where u(x, ) is membership values of data x in the class ; k value is the number of nearest
238
neighbours; u(xk, ) is membership value of k nearest neighbours’ data x in the class ; d(x, ) is
239
distance between data x and k nearest neighbours; and m is weight exponent, which should be greater
240
than 1.
241
The pseudocode in Table 3 outlines the Fuzzy k-NN algorithm (as discussed in [22, 23]).
242
Table 3. Pseudocode for executing the Fuzzy k-NN algorithm [22, 23].
243
Normalise the data
Find the k-nearest neighbours
Calculate the membership value u(x, ) in Eq. (9)
Select the maximum value of c from u(x, )
Assign class c to the data
3. Methodology for quantum hybrid approach to cervical cancer feature selection and
244
classification
245
Pap cervical smear (CS) images are rich in various features like colour, shape, and texture. The
246
process of accurate extraction of these unique visual features from the images is very crucial in
247
developing an automated cancer screening process [8].
248
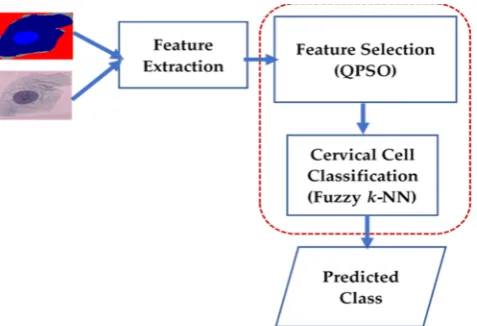
The layout of our proposed quantum hybrid technique (QHT) that combines the
quantum-249
behaved PSO with the Fuzzy k-NN (henceforth referred to as the Q-Fuzzy approach) to select
250
appropriate features for accurate classification of cervical cells in smeared images is presented in
251
Figure 3.
252
As seen in that figure, the inputs are the original and segmented versions of the cervical smear
253
images. In the first stage of the proposed technique, features relevant to the colour, shape or texture
254
of the input smeared images are extracted. Following this, in the second stage, the proposed QH (i.e.
255
the combination of QPSO and Fuzzy k-NN) algorithm is used for feature selection and subsequent
256
cell classification. The output of the system provides an inference about the predicted class from data
257
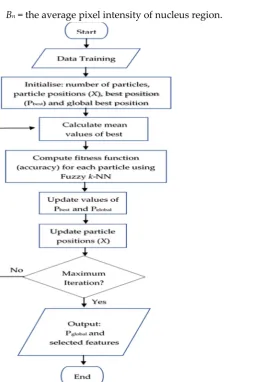
The flowchart in Figure 4 further highlights the steps of our proposed feature selection and
259
classification using proposed the QH or Q-Fuzzy (i.e. QPSO blended with Fuzzy k-NN) approach.
260
To ensure effective cell classification, the feature extraction stage is designed to target seventeen
261
(17) features related to the geometry, colour, and texture of the input CS images. These features have
262
been widely cited in previous studies, notably [3, 11, 13]. However, for integrality, we further define
263
these features in Eqs. (10) to (26).
264
265
Figure 3. Layout of proposed quantum hybrid (Q-Fuzzy) technique to select and classify cells in smeared
266
cervical images
267
a. Area of nucleus, An
268
An = number of pixels in the nucleus region (10)
269
b. Major axis of nucleus, Ln
270
Ln = the length of the major axis of an ellipse that completely encloses the nucleus region. (11)
271
c. Minor axis of nucleus,Dn
272
Dn = the length of the minor axis of an ellipse that completely encloses the nucleus region. (12)
273
d. Aspect ratio of nucleus,
274
= , (13)
275
where Wn is the width of the nucleus and Hn is the height of the nucleus region.
276
e. Perimeter of Nucleus, Pn
277
Pn = the perimeter of the nucleus region, (14)
278
f. Roundness of nucleus, Ncircle
279
N =
4 . → = N . (15)
280
g. Maxima of nucleus, Maxn
281
Maxn = number of local maximum value from eight pixels in the neighbourhood of the nucleus
282
region. (16)
283
h. Minima of nucleus, Minn
284
Minn = number of local minimum value from eight pixels in the neighbourhood of the nucleus
285
region. (17)
286
i. Homogenity of nucleus,
287
= ( , )
1 + − , (18)
288
where p(i,j) is the probability pixel pairs in the nucleus region calculated by gray level co-occurrence
289
j. Brightness of nucleus, Bn
291
Bn = the average pixel intensity of nucleus region. (19)
292
293
Figure 4. Flowchart depicting process of feature selection using the proposed Q-Fuzzy approach
294
k. Maxima of cytoplasm, Maxc
295
Maxc = number of local maximum value from eight (8) pixels in the neighbourhood of the
296
cytoplasm region. (20)
297
l. Minima of cytoplasm, Minc
298
Minc = number of local minimum value from eight (8) pixels in the neighbourhood of the
299
cytoplasm region. (21)
300
m. Brightness of cytoplasm, Bc
301
Bc = the average pixel intensity of cytoplasm region. (22)
302
n. Area of entire cell, Acell
303
Acell = number of pixels in the cell region. (23)
304
o. Compactness of the entire cell,
305
= . (24)
306
p. Ratio of nucleus and cell,
307
= , (25)
308
q. LBPcell = the local binary pattern of cell region. (26)
310
To extract textural features from the CS images, we use Local Binary Pattern Histogram Fourier
311
(LBP-HF) protocol; wherein we start by applying operator LBP to obtain the pattern of data and create
312
its histogram using Uniform LBP approach. Second, the LBP-HF feature is computed by applying
313
Discrete Fourier Transform (DFT) from n histogram Uniform LBPs. Finally, the feature vector of
LBP-314
HF is obtained by combining histogram values of all zeros, all ones, non-uniform, and Fourier
315
spectrum values.
316
Based on the LBP-HF and relevant texture features in Eqs. (10) to (26), we obtain a texture feature
317
vector of 38 entries, while the total feature vector has 54 entries. As mentioned earlier, further details
318
about these features can be found in [3, 10, 13].
319
As outlined (in the red short-dashed rectangle) in Figure 3, the feature selection stage of our
320
proposed QHT technique comprises of two units that utilise the quantum-behaved PSO technique
321
and the Fuzzy k-NN algorithm so that both feature selection and classification accuracy in smeared
322
cervical images are enhanced.
323
We further clarify that (in Figure 4) the fuzzy k-NN is applied prior to computing the fitness
324
function, i.e. using the F1 score (defined later in Eq. (29)). In other words, the QPSO approach is used
325
to find the variation of subset features by generating particles that are each evaluated by calculating
326
fitness values from the accuracy of classification result. Following this, the Fuzzy k-NN method is
327
applied to classify the categories of smear images. Based on their fitness values, the particles with
328
best fitness values are assigned as local best position and global best position. The particle that is
329
assigned as global best position represents the best subset features.
330
In this study, we shall use Fuzzy k-NN is used to enhance the accuracy of our classification of
331
cells in smeared cervical images and the best position Pi_best of particle i is determined using Eq. (18)
332
[18].
333
4. Experiments on smeared cervical images using Q-Fuzzy approach
334
Using the framework outlined in Figures 3 and 4, which were discussed in latter parts of the
335
preceding section, in this section, we present an experimental validation regarding the utility of our
336
proposed QH approach for feature selection in cervical cell classification.
337
4.1. Description of dataset
338
For our experimental validation, the unit cell microscopic cervical smear (CS) images from the
339
Herlev dataset [24] will be used as input dataset. This dataset consists of 917 CS images that were
340
collated by cytology experts using a microscope connected to a digital camera. Each image was taken
341
with a resolution of 0.201μm/pixel [10-12].
342
343
Figure 5. Sample cervical smear images and manual segmentation (ground truth) images [15-17]
344
After capturing the images, cytology experts were tasked with manually classifying the CS
345
images into the seven classes discussed in Section 2. Each cell is assessed by two experts while a
346
medical doctor was asked to further examine the samples that are deemed hard to deal with. All the
347
images in the dataset are segmented into the cytoplasm, nucleus, and background regions using
348
CHAMP software [12]. Results of the segmentation were further examined by cytology experts to
349
ensure accuracy. A few sample images from the Herlev dataset (with their respective ground truth
350
images) are shown in Figure 5. Furthermore, Table 3 presents the description of the Herlev smeared
351
cervical dataset as well as their distribution and categories.
352
Table 3. Classification of Pap smear single image cell types in the Herlev dataset [24]
355
Cell Class Name Cell count Sub-total
Normal
Normal superficial squamous 74
242 Normal intermediate squamous 70
Normal columnar 98
Abnormal
Carcinoma in situ 150
675 Light dysplastic 182
Moderate dysplastic 146 Severe dysplastic 197
Total 917 917
4.2. Evaluation method
356
Many approaches are utilised to evaluate the performance of classification algorithms. Here, we
357
use the Precision, Recall, and F1 Score analysis (or PRS analysis). Precision is used to ascertain the
358
accuracy of classification using the number of correctly classified positive examples divided by the
359
number of examples labelled by the system as positive (Eq. (27)). Recall is the number of correctly
360
classified positive examples divided by the number of positive examples in the data (Eq. (28)) and F1
361
score is combination of Precision and Recall [29] as defined in Eq. (29).
362
( ) = (27)
363
( ) =
+ (28)
364
1 = 2. ×
+ (29)
365
where tp is true positive, fp is false positive, and fn is false negative.
366
The r-fold cross validation method is employed for validating the experimental results, which
367
considering the size of our data, 5-fold cross-validation is used.
368
To establish the relationship between the different feature classification approaches, we employ
369
Cohen’s kappa statistical measure, which is widely used to quantify agreement between two raters
370
(i.e. mechanism to assess or observe a variable or system), that each classify N items into C mutually
371
exclusive categories [30] as defined in Eq. (30).
372
= (30)
373
where is the relative observed agreement between raters (akin to accuracy) and is the
374
hypothetical probability of chance agreement. If raters are in complete agreement = , whereas
375
when there is no agreement among the raters other than what would be expected by chance (i.e. as
376
given by ), then ≤ .
377
4.3. Experimental Result for Cervical Smear Image Classification
378
Earlier in Section 3, the mechanism via which the best out of an assemblage of seventeen (17)
379
features with size of feature vector of 54 entries for the CS images were pruned down to seven (7)
380
features with a feature vector of 32 entries.
381
The seven (7) best features utilised for the remainder of our performance assessment are area of
382
nucleus (i.e. Eq. (10), roundness of nucleus i.e. Eq. (15)), brightness of nucleus (i.e. Eq. (19)), brightness
383
of cytoplasm (i.e. Eq. (22)), area of entire cell (i.e. Eq. (23)), ratio of nucleus and cytoplasm (i.e. Eq.
384
(25)), and local binary pattern with histogram Fourier (LBP-HF) (i.e. Eq. (26)). Furthermore, for the
385
LBP-HF, 25 of 38 feature vectors were selected. Meanwhile, in the Fuzzy k-NN unit of the proposed
386
Q-Fuzzy approach (Figure 3), we computed the accuracy for varying values of k (i.e. the number of
387
23]) starting with k = 2, which implies that at least 2 nearest neighbours are considered in determining
389
the prediction result. In addition, it was observed that beyond k = 4 the accuracy of prediction results
390
decreased, and so the upper bound was limited at k = 7.
391
We clarify here that our experiments are mainly focused on establishing the impact of the feature
392
selection on the classification accuracy and how well our proposed QH approach (which combines
393
the QPSO algorithm with the Fuzzy k-NN - or simply the Q-Fuzzy approach) contributes towards
394
improving the performance of classification results, which is deemed crucial for cervical cancer
395
detection.
396
Consequently, we considered three experimental scenarios whereby, in the first two
397
experiments we compared the classification results obtainable with and without prior feature
398
selection. This encompasses comparisons between our proposed Q-Fuzzy approach and other Fuzzy
399
k-NN hybrid methods including one that blends the standard PSO with the Fuzzy k-NN technique
400
(which we refer to as the P-Fuzzy approach) alongside the All-Features approach, i.e. classification
401
without prior feature selection imposing the use of all the image features. Based on this setup, in the
402
first experimental scenario, we present an assessment of the classification results for the All-features,
403
P-Fuzzy and Q-Fuzzy approaches.
404
For a more objective assessment, we maintained the same parameter values of PSO and QPSO
405
as well as the number of particles and number of iterations (maintained as 20 and 200, respectively)
406
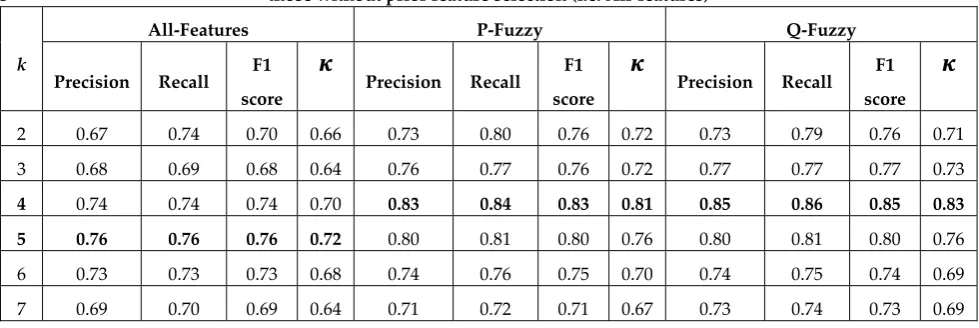
while varying the number of nearest neighbours, k. The outcomes (in Table 4) show that (for all values
407
of k) applying prior feature selection (i.e. in both the P-Fuzzy or Q-Fuzzy approaches) improved the
408
classification results in comparison to instances using all features (i.e. All-Features approach). The
409
highest performance obtained without feature selection (i.e. using all features) is realised at k = 5,
410
whereas the best performance for the P-Fuzzy and Q-Fuzzy approaches was obtained at k = 4.
411
Table 4. Comparison of classification results for approaches with (i.e. P-Fuzzy and Q-Fuzzy) and
412
those without prior feature selection (i.e. All-features)
413
k
All-Features P-Fuzzy Q-Fuzzy
Precision Recall F1
score Precision Recall
F1
score Precision Recall
F1
score
2 0.67 0.74 0.70 0.66 0.73 0.80 0.76 0.72 0.73 0.79 0.76 0.71
3 0.68 0.69 0.68 0.64 0.76 0.77 0.76 0.72 0.77 0.77 0.77 0.73
4 0.74 0.74 0.74 0.70 0.83 0.84 0.83 0.81 0.85 0.86 0.85 0.83
5 0.76 0.76 0.76 0.72 0.80 0.81 0.80 0.76 0.80 0.81 0.80 0.76
6 0.73 0.73 0.73 0.68 0.74 0.76 0.75 0.70 0.74 0.75 0.74 0.69
7 0.69 0.70 0.69 0.64 0.71 0.72 0.71 0.67 0.73 0.74 0.73 0.69
Furthermore, using the same approaches (i.e. All-features, P-Fuzzy and Q-Fuzzy), in the second
414
experimental scenario, we assessed the impact of prior feature selection on the classification accuracy
415
for all the seven cervical cell categories. Our results, in Table 5, indicate that our proposed QH feature
416
selection approach that blends the QPSO algorithm with the Fuzzy k-NN (i.e. the Q-Fuzzy approach)
417
yielded better classification accuracy than both the All-features and P-Fuzzy approaches in terms of
418
outcomes of the PRS analysis. Further investigation of the outcomes indicates an improvement in the
419
classification accuracy for all cell categories when prior feature selection (P-Fuzzy or Q-Fuzzy) was
420
utilised. Moreover, our proposed Q-Fuzzy approach outperformed the P-Fuzzy hybrid approach for
421
all cervical cell categories (except the Normal Columnar category) with its best classification results
422
in the Normal superficial cell category.
423
To further establish the utility of the proposed Q-Fuzzy QH approach, in the third experimental
424
scenario, we compared it (i.e. the proposed Q-Fuzzy approach) with other hybrid QH approaches
425
formed by blending the QPSO algorithm with other supervised learning methods, namely, the Naïve
426
Bayes (NB) and the support vector machines (SVM). Additionally, we examined the performance of
427
Relief [29] (by selecting the 25 top-ranked features from a feature vector of 54 entries (i.e. based on
429
the Relief score), the sequential feature selection (SFS) method, which has an in-built capability to
430
add or remove features sequentially [31] and the random forest (RF) method, which is an ensemble
431
learning based technique that is widely employed in classification, regression, etc. [35].
432
Table 5. Comparison of classification results with and without prior feature selection using the
all-433
features, P-Fuzzy and proposed Q-Fuzzy approaches
434
Cell category
All features (k = 5) P-Fuzzy (k = 4) Q-Fuzzy (k = 4)
Precision Recall F1
score Precision Recall F1
score Precision Recall F1
Score
Normal superficial 0.83 0.86 0.84 0.95 0.91 0.93 0.95 0.95 0.95
Normal intermediate 0.82 0.74 0.78 0.89 0.84 0.86 0.89 0.89 0.89
Normal columnar 0.63 0.67 0.65 0.65 0.72 0.68 0.61 0.74 0.67
Carcinoma in situ 0.74 0.83 0.78 0.81 0.87 0.84 0.84 0.90 0.87
Light dysplastic 0.83 0.78 0.81 0.88 0.94 0.91 0.89 0.97 0.93
Moderate dysplastic 0.69 0.85 0.76 0.83 0.96 0.89 0.89 0.96 0.93
Severe dysplastic 0.79 0.62 0.70 0.86 0.65 0.74 0.88 0.61 0.72
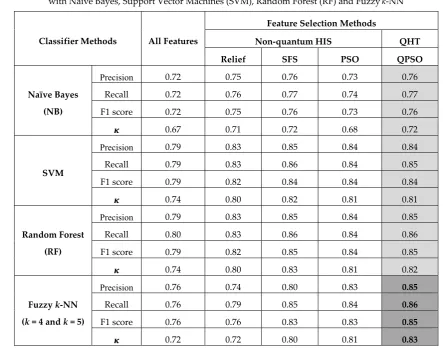
Table 6. Comparison of classification outcomes between hybrid QH approaches that combine QPSO
435
with Naïve Bayes, Support Vector Machines (SVM), Random Forest (RF) and Fuzzyk-NN
436
To clearly assess the potential impacts of integrating ‘quantumness’ into cell classification of
437
cervical smear images for the purpose of cervical cancer detection, our discussion of the results in
438
Table 6 will be predicated in two directions.
439
First, we analyse the results in terms of the resulting HIS models that are realised by blending
440
the classifiers (in the extreme left of Table 6) with the feature selection methods (Naïve Bayes (NB)
441
support vector machines (SVM) and random forest (RF)) that produce the NB, RF, SVM and Fuzzy
k-442
Classifier Methods All Features
Feature Selection Methods
Non-quantum HIS QHT
Relief SFS PSO QPSO
Naïve Bayes
(NB)
Precision 0.72 0.75 0.76 0.73 0.76
Recall 0.72 0.76 0.77 0.74 0.77
F1 score 0.72 0.75 0.76 0.73 0.76
0.67 0.71 0.72 0.68 0.72
SVM
Precision 0.79 0.83 0.85 0.84 0.84
Recall 0.79 0.83 0.86 0.84 0.85
F1 score 0.79 0.82 0.84 0.84 0.84
0.74 0.80 0.82 0.81 0.81
Random Forest
(RF)
Precision 0.79 0.83 0.85 0.84 0.85
Recall 0.80 0.83 0.86 0.84 0.86
F1 score 0.79 0.82 0.85 0.84 0.85
0.74 0.80 0.83 0.81 0.82
Fuzzy k-NN
(k = 4 and k = 5)
Precision 0.76 0.74 0.80 0.83 0.85
Recall 0.76 0.79 0.85 0.84 0.86
F1 score 0.76 0.76 0.83 0.83 0.85
NN (FkNN) HIS models. To simplify our discussion, we further divided the models into two
443
categories. The first category consists of non-quantum HIS models wherein neither the classifier nor
444
the feature selection units has any ‘quantumness’ in it. The second category comprises of quantum
445
HIS techniques (or simply quantum hybrid techniques) that are realised by blending the QPSO
446
feature selection method with each of the four classifiers (NB, SVM, RF and FkNN). The resulting NB,
447
SVM, RF and FkNN QHTs are shown highlighted in Table 6. Notably, we clarify that the FkNN QHT
448
(whose results are shaded in darker background) is also our proposed Q-Fuzzy approach that blends
449
the QPSO into the Fuzzy k-NN classifier method.
450
Our analysis in terms of the HIS models pitches the non-quantum models against the QH
451
techniques for each classifier method. As reported in Table 6, the QHT technique of each classification
452
method (i.e. QPSO blended with NB, QPSO blended with SVM, QPSO blended with RF and QPSO
453
blended with FkNN) present between marginal to modest improvements across all the parameters
454
(i.e. Precision, Recall, F1 score and Cohen’s Kappa measure) used to assess the classification accuracy
455
than most of the non-quantum HIS models for that same classifier. Similarly, the results obtained
456
when All-Features (i.e. without prior feature selection) methods is used are improved along all
457
parameters in comparison with using the QHT of each corresponding classification method.
458
To focus the assessment in terms of our proposed Q-Fuzzy approach, the second perspective of
459
our discussion of the results in Table 6 is confined to comparisons between the four QHTs. The results
460
(shaded area) show that, with the exception of the RF-based QHT, our proposed Q-Fuzzy approach
461
(or FkNN-based QHT) performs better than the NB and SVM-based QHTs in terms of all four
462
parameters that are reported (in Table 6). Even though these improvements are modest (ranging
463
between 1 to 9 percent for Precision, Recall and F1 score and 2 to 11 percent for the Cohen’s Kappa
464
statistical measure) their impact in terms of better detection of cancerous cells in cervical smear
465
images are significant. Moreover, as reported earlier in Table 5, our proposed Q-Fuzzy approach
466
outperformed its closest competition (the P-Fuzzy technique or PSO-based non-quantum HIS) in
467
terms of accuracy of classifying most of the cell categories in the cervical smear images. Similarly, as
468
reported in Table 4, the proposed Q-Fuzzy approach presented better classification accuracy in terms
469
of abnormal cell categories than the P-Fuzzy method.
470
In concluding, we reiterate that all along our objective has been to explore the impact of
471
integrating ‘quantumness’ into HIS models. As reported earlier in this section, the quantum
472
hybridised QHT models enhanced the classification accuracy across most of classifier methods (i.e.
473
NB, SVM and Fuzzy k-NN) that were evaluated. Furthermore, as noted in earlier Section 2, the
474
improvements recorded via the proposed Q-Fuzzy approach could be attributed to the manner that
475
the intuitionistic rationality of the Fuzzy k-NN complements the adaptive search capability of the
476
quantum-behaved QPSO algorithm. Consequently, the foregoing narrative enunciates potential
477
applications for quantum machine learning algorithms in image-based approaches to disease
478
diagnosis and treatment.
479
5. Concluding remarks
480
Accuracy is an important aspect of cell detection and delineation, especially in many
image-481
based applications for disease diagnosis. To enhance the accuracy of classification of cells in smeared
482
cervical images, our study proposes a hybrid feature selection technique that combines the potency
483
of the quantum-behaved particle swarm optimisation (QPSO) algorithm with the versatility of the
484
Fuzzy k-nearest neighbours (Fuzzy k-NN) algorithm (i.e. the proposed quantum hybrid (QH) or
Q-485
Fuzzy technique).
486
From an initial multitude of seventeen (17) features that describe the geometry, colour, and
487
texture of the cervical images, the QPSO stage of our proposed technique is used to select the best
488
subset features (i.e. global best particles) that represent a pruned down collection of seven (7) features.
489
Using the Herlev dataset [24]) consisting of almost 1000 images, our verification of the cogency
490
of the proposed QH approach in cervical cancer detection was predicated upon its use in three
491
experimental scenarios. The purpose of the first two scenarios is to establish the impact of prior
492
approach (i.e. when no prior feature selection is used in the classification) alongside HIS models
494
including the P-Fuzzy approach (which is a hybrid approach that combines the standard PSO
495
algorithm with the Fuzzy k-NN technique) on one side and alongside our proposed Q-Fuzzy
496
approach that blends the quantum-behaved PSO algorithm with the Fuzzy k-NN technique.
497
Outcomes from these tests confirm that integrating ‘quantumness’ into the feature selection units led
498
to enhanced classification accuracy. Moreover, the efficacy of our proposed Q-Fuzzy approach
499
manifests in the manner that it rivals the P-Fuzzy approach in terms of classification accuracy for six
500
out of the seven cervical cell categories. In the third experimental scenario, we established the synergy
501
between the quantum-behaved PSO and the Fuzzy k-NN technique that form our proposed Q-Fuzzy
502
approach by comparing its classification accuracy alongside that from a trio of hybrid QH approaches
503
that each blends the QPSO with other classification methods, namely the Naïve Bayes (NB) networks,
504
the random forest (RF) ensemble method and the support vector machine (SVM). Outcomes establish
505
that the adaptive search capability of the quantum-behaved QPSO algorithm is best complemented
506
by the intuitionistic rationality inherent to the Fuzzy k-NN technique. Overall, our proposed QPSO
507
blended Fuzzy k-NN QH approach (i.e. Q-Fuzzy approach) outperformed the other approaches that
508
QPSO blended with the NB and SVM with modest average increases ranging from 2 to 11 percent in
509
terms of the classification parameters that were evaluated.
510
Buoyed by the foregoing outcomes, in ongoing work, additional ‘quantumness’ will be exploited
511
and integrated into the QPSO (as well as in QH techniques generally) so that the accuracy and
512
performance of the feature selection could be further enhanced. These efforts would improve the
513
effectiveness of image-based approaches used in cervical cancer diagnosis and treatment. Later, we
514
hope to exploit these strategies (and others in [33]) in image-based detection of other carcinogens.
515
Acknowledgments: This work is sponsored, in full, by the Prince Sattam Bin Abdulaziz University, Saudi Arabia
516
via the Deanship for Scientific Research funding granted to the CIIS Research group project number 2016/01/6441.
517
Conflicts of Interest: The authors declare no conflict of interest.
518
References
519
1. A. Abraham, “Hybrid artificial intelligent systems”, in Innovations in Hybrid Intelligent Systems
520
Series on Advanced Soft Computing, 2007, 44(2007). xvi-xvi.
521
2. K. A. Abuhasel, C. Fatichah, A. M. Iliyasu, “A Bi-Stage Technique for segmenting Cervical Smear
522
Images Using Possibilistic Fuzzy C-Means and Mathematical Morphology”, J. of Medical Imaging and
523
Health Info., 2016, 6(7): 1663–1669.
524
3. WHO, "Comprehensive Cervical Cancer Control: A Guide to Essential Practice," WHO Press, 2006
525
4. A. Gençtava, S. Aksoy, and S. Onder, Unsupervised segmentation and classification of cervical cell
526
images, Pattern Recognition, 2012, 45(12): 4151–4168.
527
5. Parkway Cancer Centre, 2014. [Online]. Available: http://www.parkwaycancercentre.com/. [Accessed
528
October 2017].
529
6. C. M. Wang, H.T. Chen, S. F. Yang-Mao, Y. K. Can, S. F. Lin, New Methods for Image De-noising and
530
Edge Enhancement in Cervical Smear Images Segmentation, Int. J. of Computer, Consumer and
531
Control (IJ3C), 2013, 2(1): 2013.
532
7. R.M. Demay, Common problems in Papanicolaou smear interpretation, Archives of Pathology and
533
Laboratory Medicine, 1997, 121(3): 229–238.
534
8. B. L. Craine, E. R. Craine, J. R. Engel, N. T. Wemple, A clinical system for digital imaging Colposcopy,
535
Medical Imaging II, Calif, USA, Newport Beach press 1998, pp. 505–511.
536
9. E. J. Mariarputham and A. Stephen, Nominated Texture Based Cervical Cancer Classification,
537
Computational and Mathematical Methods in Medicine, 2015, 2015(Article ID 586928): 2015.
538
10. M. H. Tsai, Y. K. Chan, Z. Z. Lin, S. F. Yang-Mao, P. C. Huan, Nucleus and cytoplast contour detector
539
of cervical smear image, Pattern Recognition Letter, 2008, 29(9): 1441-1453.
540
11. E. Martin, Pap-smear classification, Master's Thesis, Technical University of Denmark: Oersted-DTU,
541
Automation, 2003.
542
12. J. Norup, Classification of pap-smear data by transductive neuro-fuzzy methods, Master’s thesis,
543
13. J. Jantzen, J. Norup, G. Dounias and B. Bjerregaard, Pap-smear Benchmark Data for Pattern
545
Classification, 2005.
546
14. T. Chankong, N. Theera-Umpan and S. Auephanwiriyakul, “Automatic cervical cell segmentation and
547
classification in pap smear,” Computer Methods and Program in Biomedicine, 2014, 2(113): 539-556.
548
15. A. H. Mbaga, P. ZhiJun, “Pap Smear Images Classification for Early Detection of Cervical Cancer,” Int.
549
J. of Comp. Appl., 2015, 118(7): 10-16.
550
16. B. Ashok, P. Aruna, Comparison of Feature selection methods for diagnosis of cervical cancer using
551
SVM classifier,” Int. J. of Eng. Research & Appl., 2016, 6(1): 94-99.
552
17. K. A. Abuhasel, A. M. Iliyasu, C. Fatichah, “A Hybrid Particle Swarm Optimisation and Neural
553
Network with Fuzzy Membership Function Technique for Epileptic Seizure Classification,” J. of Adv.
554
Comput. Intelligence and Intelligent Informatics, 2015, 19(3): 447-455.
555
18. J. Sun, B. Feng, and W. B. Xu, Particle swarm optimization with particles having quantum behaviour,
556
Proceedings of the IEEE Congress on Evolutionary Computation (CEC '04), 2004 June 2-4; pp. 325–331.
557
19. X. Fu, W.S. Liu, B. Zhang, H. Deng, “Quantum behaved particle swarm optimization with
558
neighbourhood search for numerical optimization,” Math. Problems Eng. 201(Article ID 469723): 2013.
559
20. C. Jin, S.W. Jin, Automatic image annotation using feature selection based on improving quantum
560
particle swarm optimization, Signal Processing, 2015, 109: 172–181.
561
21. J. Kennedy, R.C. Eberhart, Y. Shi, Swarm Intelligence, Morgan Kaufmann, San Francisco, 2001.
562
22. D. Li, J.S. Deogun, and K. Wang, Gene function classification using fuzzy k-nearest neighbour
563
approach, Proceedings of IEEE Int. Conference on Granular Computing (GRC), pp. 644-644, 2007.
564
23. S. Y. Kim, J. Sim, and J. Lee, “Fuzzy k-Nearest Neighbour Method for Protein Secondary Structure
565
Prediction and Its Parallel Implementation,” Computational Intelligence and Bioinformatics, 2006,
566
4115, Lecture Notes in Computer Science: 444-453.
567
24. The Management and Decision Engineering Laboratory, Herlev Databases
http://mde-568
lab.aegean.gr/downloads
569
25. A. M. Iliyasu, Towards the Realisation of Secure and Efficient Image and Video Processing
570
Applications on Quantum Computers, Entropy, 2013, 15(8): 2874-2974
571
26. A. M. Iliyasu, P. Q. Le, F. Dong, K. Hirota, Restricted geometric transformations and their applications
572
for quantum image watermarking and authentication, In Proc. of the 10th Asian Conf. on Quantum
573
Info. Science (AQIS 2010), 18-19 August 2010; Tokyo, Japan, pp. 212–214.
574
27. A. M. Iliyasu, F. Yan, S. E. Venegas-Andraca, A. S. Salama, “Hybrid Quantum-Classical Protocol for
575
Storage and Retrieval of Discrete-Valued Information,” Entropy, 2014, 16(6): 3537-3551.
576
28. F. Yan, A. M. Iliyasu, A survey of quantum image representation, Quant. Info. Proc. 2016, 15 (1): 1–35.
577
29. M. Sokolova, G. Lapalme, “A systematic analysis of performance measures,” Info. Proc. & Management,
578
2009, 45: 427–437.
579
30. Cohen, Jacob, "A coefficient of agreement for nominal scales," Educational and Psychological
580
Measurement, 1960, 20 (1): 37–46. doi:10.1177/001316446002000104
581
31. R. Thomas, C. Osendorfer, P. Van der Smagt, “Sequential Feature Selection for Classification,”
582
Advances in Artificial Intelligence, 2011, 132-141, doi:10.1007/978-3-642-25832-9_14
583
32. A. Sakthi, M. Rajaram, “Density based Multiclass Support Vector Machine using IoT driven service
584
oriented architecture for predicting cervical cancer”, Int. J. of u- and e-Service, Science and Technology,
585
2016, 9(11):195-216
586
33. A. M. Iliyasu, C. Fatichah, K. A. Abuhasel, “Evidence Accumulation Clustering with Possibilitic Fuzzy
587
C-Means base clustering approach to disease diagnosis,” Automatika: Journal for Control, Measurement,
588
Electronics, Computing and Communications, 2016, 57(3): 822-835
589
34. M. Schuld, I. Sinayskiy, F. Petruccione, "An introduction to quantum machine learning," Contemporary
590
Physics, 2014, 56 (2): 172. arXiv:1409.3097
591
35. A. M. Iliyasu, C. Fatichah, A. S. Salama, J. She “Quantum hybrid technique for feature selection in
592
classification of cervical cells,” 7th Int. Sym. on Comp. Intelligence & Industrial Appl. (ISCIIA 2016),
![Figure 5. Sample cervical smear images and manual segmentation (ground truth) images [15-17]](https://thumb-us.123doks.com/thumbv2/123dok_us/7953975.1319865/9.595.93.490.562.622/figure-sample-cervical-images-manual-segmentation-ground-images.webp)
![Table 3. Classification of Pap smear single image cell types in the Herlev dataset [24]](https://thumb-us.123doks.com/thumbv2/123dok_us/7953975.1319865/10.595.117.476.87.235/table-classification-smear-single-image-types-herlev-dataset.webp)