Plant Disease Detection Using Leaf Pattern: A Review
Vishnu S
Advanced Communication & Signal Processing Laboratory, Department of Electronics & Communication Engineering,
Government College of Engineering Kannur, Kerala, India,
Email: [email protected]
A. Ranjith Ram
Advanced Communication & Signal Processing Laboratory, Department of Electronics & Communication Engineering,
Government College of Engineering Kannur, Kerala, India,
Email: [email protected]
Abstract—In this review paper we discuss the various methodologies for plant disease detection. Studies show that relying on pure naked-eye observation of experts to detect and classify diseases can be time consuming and expensive, especially in rural areas and developing countries. So we present fast, automatic, cheap and accurate image processing based solution. Solution is composed of four main phases; in the first phase we create a color transformation structure for the RGB leaf image and then, we apply color space transformation for the color transformation structure. Next, in the second phase, the images are segmented using the K-means clustering technique. In the third phase, we calculate the texture features for the segmented infected objects. Finally, in the fourth phase the extracted features are passed through a pre-trained neural network.
Keywords-Disease detection, symptoms, neural network, color cooccurrence, plant leaf disease, K-means Method.
I. INTRODUCTION
India is an agricultural country wherein most of the population depends on agriculture. Research in agriculture is aimed towards increase of productivity and food quality at reduced expenditure, with increased profit. Agricultural production system is an outcome of a complex interaction of soil, seed, and agro chemicals. Vegetables and fruits are the most important agricultural products. In order to obtain more valuable products, a product quality control is basically mandatory. Many studies show that quality of agricultural products may be reduced due to plant diseases. Diseases are impairment to the normal state of the plant that modifies or interrupts its vital functions such as photosynthe-sis, transpiration, pollination, fertilization, germination etc. These diseases are caused by pathogens viz., fungi, bacteria and viruses, and due to adverse environmental conditions. Therefore, the early stage diagnosis of plant disease is an important task [1]. Farmers require continuous monitoring of experts which might be prohibitively expensive and time consuming. Therefore looking for fast [2], less expensive and accurate method to automatically detect the diseases from the symptoms that appear on the plant leaf is of great realistic significance. This enables machine vision that is to provide image based automatic inspection, process control and robot guidance. The objective of this paper is
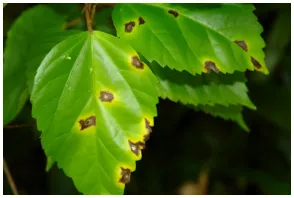
Figure 1. Bacterial disease on leaf
to concentrate on the plant leaf disease detection based on the texture of the leaf. Leaf presents several advantages over flowers and fruits at all seasons worldwide [3], [4].
Rest of the paper is organized as follows. Section III presents a detailed discussion on recent work carried out in this area. Section IV includes basic methodology for leaves disease detection which represents a brief review on various image processing techniques. Then section V gives an idea about the proposed system.Section VI point out the main applications of the proposed system . Finally, section VII concludes this paper along with possible future directions.
II. PLANT DISEASES ANALYSIS AND ITS SYMPTOMS Following are some common symptoms of fungal, bacte-rial and viral plant leaf diseases.
1) Bacterial disease symptoms: The disease is character-ized by tiny pale green spots which soon come into view as water- soaked. The lesions enlarge and then appear as dry dead spots as shown in Fig. 1.
Figure 2. Viral disease on leaf
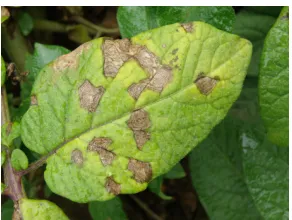
Figure 3. Fungal disease on leaf-downy mildew
3) Fungal disease symptoms: Plant leaf diseases, those caused by fungus are discussed below and shown in Fig. 3., Fig. 4. & Fig. 5. e.g. Late blight caused by the fungus Phytophthora infesters is shown in Fig. 4. It first appears on lower, older leaves like water-soaked, gray-green spots. When fungal disease matures, these spots darken and then white fungal growth forms on the undersides. Early blight is caused by the fungus Alternaria solani shown in Fig. 5. It first appears on the lower, older leaves like small brown spots with concentric rings that form a bulls eye pattern. When disease matures, it spreads outward on the leaf surface causing it to turn yellow. In downy mildew yellow to white patches on the upper surfaces of older leaves occurs. These areas are covered with white to greyish on the undersides as shown in Fig. 3.
III. CURRENTSTATE OF THEART
A methodology for detecting plant diseases early and accurately using diverse image processing techniques has been proposed by Anand H. Kulkarni et al. [1], where Gabor
Figure 4. Fungal disease on leaf-late blight
Figure 5. Fungal disease on leaf-early blight
filter has been used for feature extraction and ANN based classifier has been used for classification with recognition rate up to 91%. F. Argenti, et al. [2], proposed a fast algorithm for calculating parameters of co-occurrence matrix by supervised learning and maximum likelihood method for fast classification. Homogenize techniques like sobel and canny filter has been used to identify the edges by P. Revathi et al. [3]. These extracted edge features have been used in classification to identify the disease spots. The proposed homogeneous pixel counting technique for cotton diseases detection (HPCCDD) algorithm has been used for categorizing the diseases. They claim the accuracy of 98.1% over existing algorithm. Tushar H Jaware et al. [4] proposed a novel and improved k-means clustering technique to solve low-level image segmentation. Spatial gray-level dependence matrices (SGDM) method has been used for extracting statistical texture features by Sanjay B. Dhaygude et al. [5]. RGB images have been converted into Hue Saturation Value (HSV) color space representation and showed the H, S and V components. Mokhled S. Al-Tarawneh [6] presented an empirical investigation of olive leaf spot disease using auto-cropping segmentation and fuzzy c-means classification. Rgb to Lab colorspace and median filter used for image enhancement. At end present comparative assessment of fuzzy c-means and k-mean clustering.
The fuzzy feature selection approach namely fuzzy curves (FC) and fuzzy surfaces (FS) have been proposed to select features of cotton leaf disease by Yan-Cheng Zhang, et al. [7]. This has been resulted in reduced dimensional feature space. Back-propagation (BP) networks have been used to classify the grape and wheat diseases by Haiguang Wang et al. [8]. Also by using principal component analysis (PCA) dimensions of the feature data has been reduced. Texture features based on the local power spectrum of Gabor filters has been proposed by Simona E. Grigorescu et al. [9] where complex moments, Gabor energy and grating cell operator features have been discussed. They concluded that grating cell operator responded only to texture features.
namely banana, beans, jackfruit, lemon, mango, potato, tomato and sapota. 94.74% accuracy has been achieved by Support vector machine (SVM) classifier.
Dheeb Al Bashish, et al. [11] developed neural network classifier based on statistical classification and could suc-cessfully detect and classify the diseases with a precision of around 93%. A Research of maize disease image recognition of corn based on BP networks effectively identified by Song Kai et al. [12] where YCbCr color space technology is used to segment disease spot, Co-occurrence matrix (CCM) spatial gray level layer is used to extract disease spot texture feature, and BP neural network has been used to classify the maize disease. The applications of K-means clustering, BP neural networks had been formulated for clustering and classification of diseases that affect on plant leaves by H. Al-Hiary, et al. [13]. They provide adequate support for accurate detection of leaf diseases. The proposed algorithm has been tested on five diseases viz. Early and late scorch, cottony and ashen mold , tiny whiteness. Menukaewjinda et al. [14] tried another ANN, i.e. back propagation neural network (BPNN) for efficient grape leaf color extraction with complex background. They also explore modified self organizing feature map (MSOFM) and genetic algorithm (GA) and found that these techniques provide automatic adjustment in parameters for grape leaf disease color extrac-tion. Support vector machine (SVM) has been also found to be very promising to achieve efficient classification of leaf diseases. 21 color, 4 shape and 25 texture features has been extracted by Haiguang Wang et al. [15] and principal component analysis (PCA) has been performed for reducing dimensions in feature data processing, then back-propagation (BP) networks, radial basis function (RBF) neural networks, generalized regression networks (GRNNs) and probabilistic neural networks (PNNs) has been used as the classifiers to identify diseases.
IV. METHODOLOGIES FOR PLANT DISEASE DETECTION
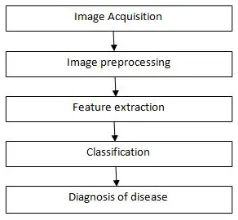
There are five main steps used for the detection of plant leaf diseases as shown in Fig. 6. The processing scheme consists of image acquisition through digital camera or web, image pre-processing includes image enhancement and image segmentation where the affected and useful area are segmented, feature extraction and classification. Finally the presence of diseases on the plant leaf will be identified.
In the initial step, RGB images of leaf samples were picked up. The step-by-step procedure as shown below:
1) RGB image acquisition
2) convert the input image into color space 3) Segment the components
4) obtain the useful segments 5) Computing the texture features
6) Configuring the neural networks for recognition
A. Image acquisition
Firstly, the images of various leaves acquired using a digital camera with required resolution for better quality. The construction of an image database is clearly dependent on the application. The image database itself is responsible for the better efficiency of the classifier which decides the robustness of the algorithm.
B. Image pre-processing
In the second step, this image is pre-processed to improve the image data that suppress undesired distortions, enhances some image features important for further processing and analysis task. It includes color space conversion, image enhancement, and image segmentation.
First, the RGB images of leaves are converted into HSI color space representation. The purpose of the color space is to facilitate the specification of colors in some standard, generally accepted way. HSI (hue, saturation, intensity) color model is a popular color model because it is based on human perception (Gonzalez and Woods, 2008). Hue is a color attribute that refers to the dominant color as perceived by an observer. Saturation refers to the relative purity or the amount of white light added to hue and intensity refers to the amplitude of the light. Color spaces can be converted from one space to another easily. After the transformation process, the H component is taken into account for further analysis. S and I components are dropped since it does not give extra information [5].
Image segmentation is process used to simplify the repre-sentation of an image into something that is more mean-ingful and easier to analyze. As the premise of feature extraction and pattern recognition, image segmentation is also the fundamental approaches of digital image processing. There are various techniques for image segmentation discuss below.
1) Region based: In this technique pixels that are related to an object are grouped. The area that is detected for segmentation should be closed. Due to missing edge pixels in this region based segmentation there wont be any gap. The boundaries are identified for segmentation. In every step at least one pixel is related to the region and is taken into consideration. After identifying the change in the color and texture, the edge flow is converted into a vector. Then these edges are detected for further segmentation.
2) Edge based: Segmentation can also be done by using edge detection techniques. There are various techniques viz. gradient, log, canny, sobel, laplacian, robert. In this technique the boundary is identified to segment. Edges are detected to identify the discontinuities in the image. For classification they use both fixed and adaptive feature of support vector machine.
original image. So, if the edge detections are accurate then the threshold too. Segmentation through thresholding has fewer computations compared to other techniques. The disadvantage of this segmentation technique is not suitable for complex images.
4) Feature based clustering: Segmentation is also done through Clustering [8]. The image is converted into his-togram and then clustering is done on it. Pixels of the color image are clustered for segmentation using an unsupervised technique Fuzzy C. This is applied for ordinary images. It results to fragmentation if it is a noisy image. A basic clustering k-means algorithm is used for segmentation in textured images [6], [13]. It clusters the related pixels to segment the image. Segmentation is done through feature clustering and there it will be changed according to the color components. Segmentation is also purely depending on the characteristics of the image. Features are taken into account for segmentation. Difference between the intensity and color values are used for segmentation. Improved k-mean used to solve low-level image segmentation [4].
For segmentation of color image use of fuzzy clustering technique is to iteratively generate color clusters using fuzzy membership function in color space regarding to image space. The technique is successful in identifying the color region. Real time clustering based segmentation. A Virtual attention region is captured accurately for segmentation. Image is segmented coarsely by multithresholding. It is then refined by fuzzy c-means clustering [6]. It applied to any multispectral images is a major advantage [7].Segmenta-tion approach for region growing is k-means clustering. A Clustering technique for image segmentation is done with cylindrical decision elements of the color space. The surface is obtained through histogram and is detected as a cluster by thresholding. By using modified self organizing feature map (MSOFM), clustering process does not require predefined number of color group. This is also adjustable allowing similarity of each color group. The suitable color group numbers lead to the better color extraction [14].
5) Model based: Markov Random Field (MRF) based segmentation is known as model based segmentation. An inbuilt region smoothness constraint is presented in MRF which is used for color segmentation. MRF is combined with edge detection for identifying the edges accurately [4].
C. Feature extraction
After segmentation the area of interest i.e. diseased part extracted. In the next step, significant features are extracted and those features can be used to determine the meaning of a given sample. Actually, image features usually includes color, shape and texture features. Currently most of the researchers targeting plant leaf texture as the most impor-tant feature in classifying plants. With the help of texture features, plant diseases are classified into different types.
There are various methods for feature extraction as discussed below.
1) Texture analysis methods: Textures are a pattern of non-uniform spatial distribution of differing image intensi-ties, which focus generally on the individual pixels that make up an image. Texture is termed as quantifying the spatial relationship between materials in an image. Some proper-ties are playing an important role in recitation of texture viz. uniformity, regularity, density, linearity, directionality, roughness, coarseness, phase and frequency. The method to characterize texture force into four major categories such as statistical, structural, fractals, and signal processing.
Statistical: Statistical type includes grey-level histogram, grey-level co-occurrence matrix, auto-correlation features, and run length matrices for texture extraction.
Structural: The structural models of texture presume that textures are combinations of texture primitives. Conceptu-ally, structural texture analysis carried out into two major steps i.e. extraction of the texture elements, and inference of the placement rule. Two different structural methods are considered i.e. two dimensional wavelet transform and Gabor transform.
Fractals: Many natural surfaces possess a statistical qual-ity of roughness and self-similarqual-ity at different scales. Frac-tals have become very useful and popular in modelling these properties in the image processing field.
Signal processing: Texture is especially suited for this type of analysis because of its properties. Includes spatial domain filters, Fourier domain, two-dimensional Gabor function.
2) Texture feature extraction methods: The extraction methods are used for extracting interesting and relevant features from the inputted image. The one which is used for the extraction of texture feature from images is called texture feature extraction method. The popular extraction techniques in texture field are discussed in this section.
Gray-level Dependence Matrices (SGDM) includes properties viz. contrast, energy, local homogeneity, and correlation [5].
Gabor Filters: Gabor filters also popular as the Gabor wavelets. It is a widely used signal processing method. The Gabor filters consists of parameters such as the radial centre frequency, standard deviation and orientation. It can be can be used by defining a set of radial centre frequencies and orientations. As signal processing method produces large feature size, Gabor filters requires to be downsized for the prevention of the dimensionality issues [9]. Principal Com-ponent Analysis (PCA) can be a good choice to downsize the feature space Though Gabor filters are popular in texture classification it sometimes combined with other methods too [1].
Wavelets Transform: Another popularly used signal pro-cessing method in image propro-cessing and pattern recognition is wavelet transforms. Currently, it became an important feature to be used in texture classification. Several wavelet transforms are used popularly nowadays such as Discrete Wavelet Transforms (DWT), Haar wavelet and Daubechies wavelets. Among these DWT is most widely used wavelet transform. The information on the frequency domain is usually more stable as compared to the spatial domain. Therefore, despite being more complex and slower, wavelet transforms usually produces better features with a higher accuracy [3].
Principal component analysis: PCA is a statistical pro-cedure that uses orthogonal transformation to convert a set of observations of possibly correlated variables into a set of values of linearly uncorrelated variables called principal components. The number of original variables is greater than or equal to the number of principal components. It is sensi-tive to the relasensi-tive scaling of the original variables [15]. PCA is the simplest of the true eigenvector-based multivariate analyses; PCA is closely related to factor analysis [8]. D. Classifier
A software routine was written in MATLAB. In which training and testing performed via several neural network classifier. Texture Feature Classification Methods are as follows.
1) K-nearest neighbour: K-Nearest Neighbor is a simple classifier in the machine learning techniques where the clas-sification is achieved by identifying the nearest neighbors to a query examples and then make use of those neighbors for determination of the class of the query. In KNN the classification i. e. to which class the given point is belongs is based on the calculation of the minimum distance between the given point and other points. As a classifier the nearest neighbor does not include any training process .It is not applicable in case of large number of training examples as it is not robust to noisy data. For the plant leaf clas-sification the Euclidean distance between the test samples and training samples is calculated. In this way it finds out
similar measures and accordingly the class for test samples. A sample is classified based on the highest number of votes from the k neighbors, with the sample being assigned to the class most common amongst its k nearest neighbors.k is a positive integer, typically small. If k = 1, then the sample is simply assigned to the class of its nearest neighbor. In binary (two class) classification problems, it is helpful to choose k to be an odd number as this avoids tied votes [19][20]. Nearest neighbor method is easy to implement also quite good results if the features are chosen carefully. The K-Nearest Neighbor (KNN) Classifier is works well on basic recognition problems. The main disadvantage of the KNN algorithm is that it is a slow learner, i.e. it does not learn anything from the training data and simply make use the training data itself for classification. Another disadvantage is this method is also rather slow if there are a large number of training examples as the algorithm must have to compute the distance and sort all the training data at each prediction. Also it is not robust to noisy data in case of large number of training examples. The most serious disadvantage of nearest neighbor methods is that they are very sensitive to the presence of irrelevant parameters.
2) Radial basis function: A radial basis function (RBF) is a real-valued function whose value depends only on the distance from the origin. The normally used measuring norm is Euclidean distance. RBFs are the networks where the activation of hidden units is based on the distance between the input vector and a prototype vector [15].
layer (forward). Multiple layers of neurons with nonlinear transfer functions allow the network to learn nonlinear and linear relationships between input and output vectors. Multilayer perceptrons (MLPs), which can be trained using a backpropagation algorithm (Rumelhart and McClelland, 1986), is a very popular choice for many researchers. E. Probabilistic Neural Network (PNN)
: Probabilistic Neural Networks (PNNs) is a feedforward neural network , based on Parzen windows. In a PNN, the operations are organized into a multilayered feedforward network with four layers.PNN is mainly used in classifica-tion problems. The first layer is input layer which calculates the distance from the input vector to the training input vectors. The second layer sums the contribution for each class of inputs and produces its net output as a vector of probabilities. Third Pattern layer contains one neuron for each case in the training data set. It stores the values of the predictor variables for the case along with the target value. The pattern neurons add the values for the class they represent. The output layer compares the weighted votes for each target category accumulated in the pattern layer and uses the largest vote to predict the target category. As PNNs are much faster than multilayer perceptron networks their training phase requires only one pass through the training patterns. PNN can be accurate than multilayer perceptron networks also relatively insensitive to outliers. To improve the overall performance PNNs output can be later processed by another classification system and as this happens very fast, PNNs are used in on-line applications where a real-time classifier is required.
The main disadvantage of PNN is it requires large storage space.
1) Support vector machine: Support Vector machine (SVM) is a non-linear Classifier. This is a new trend in machine learning algorithm which is used in many pattern recognition problems, including texture classification. In SVM, the input data is non-linearly mapped to linearly sep-arated data in some high dimensional space providing good classification performance. SVM maximizes the marginal distance between different classes. The division of classes is carried out with different kernels.SVM is designed to work with only two classes by determining the hyper plane to divide two classes. This is done by maximizing the margin from the hyper plane to the two classes. The samples closest to the margin that were selected to determine the hyper plane is known as support vectors .Fig below shows the support vector machines concept. Multiclass classification is also applicable and is basically built up by various two class SVMs to solve the problem, either by using one-versus-all or one versus-one. The winning class is then determined by the highest output function or the maximum votes respectively.
Main advantages of SVM are: 1) Its prediction accuracy is high.
Figure 6. Steps involved in the proposed method of plant disease detection
2) Its working is robust when training examples contain errors.
3) Its simple geometric interpretation and a sparse solu-tion.
4) Like neural networks the computational complexity of SVMs does not depend on the dimensionality of the input space.
Drawbacks of SVM are:
1) This classifier involves long training time.
2) In SVM it is difficult to understand the learned func-tion (weights).
3) The large number of support vectors used from the training set to perform classification task.
V. PROPOSEDSYSTEM
In the previous sections we have discussed the current state of the art and various methodologies. In this section we discuss the proposed system. There are five main steps used for the detection of plant leaf diseases as shown in Fig.6. The processing scheme consists of image acquisi-tion through digital camera or web, image pre-processing includes image enhancement and image segmentation where the affected and useful area are segmented, feature extraction and classification. Finally the presence of diseases on the plant leaf will be identified. In the initial step, RGB images of leaf samples were picked up. Then it is converted into HSV color space. Afterthat the components are segmented. After obtaining the useful segments the texture features are computed. Neural networks are configured then for recognition.
VI. APPLICATIONS
expensive and accurate method to automatically detect the diseases from the symptoms that appear on the plant leaf is of great realistic significance. This enables machine vision that is to provide image based automatic inspection, process control and robot guidance. The objective of this paper is to concentrate on the plant leaf disease detection based on the texture of the leaf. Leaf presents several advantages over flowers and fruits at all seasons worldwide [3], [4].
VII. CONCLUSION
This paper reviews and summarizes image processing techniques that have been used for recognizing plant dis-eases. The major techniques for detection of plant diseases are: BPNN, SVM, K-means clustering, and SGDM. These techniques are used to analyses the healthy and diseased plants leaves. Some of the challenges in these techniques viz. effect of background data in the resulting image, opti-mization of the technique for a specific plant leaf diseases, and automation of the technique for continuous automated monitoring of plant leaf diseases under real world field conditions. The review suggests that this disease detection technique shows a good potential with an ability to detect plant leaf diseases and some limitations. Therefore, there is scope of improvement in the existing research.
REFERENCES
[1] Anand H. Kulkarni, Ashwin Patil R. K.,Applying image pro-cessing technique to detect plant diseases, International Journal of Modern Engineering Research, vol.2, Issue.5, pp: 3661-3664, 2012.
[2] F. Argenti,L. Alparone,G. Benelli , Fast algorithms for texture analysis using co-occurrence matrices Radar and Signal Pro-cessing, IEE Proceedings , vol. 137, Issue 6, pp:443-448 , No. 6, December 1990.
[3] P. Revathi, M. Hemalatha, Classification of Cotton Leaf Spot Diseases Using Image Processing Edge Detection Techniques, IEEE International Conference on Emerging Trends in Sci-ence, Engineering and Technology, pp-169-173, Tiruchirap-palli, Tamilnadu, India, 2012.
[4] Tushar H. Jaware, Ravindra D. Badgujar and Prashant G. Patil, Crop disease detection using image segmentation, National Conference on Advances in Communication and Computing, World Journal of Science and Technology, pp:190-194, Dhule, Maharashtra, India, 2012.
[5] Prof.Sanjay B. Dhaygude, Mr.Nitin P. Kumbhar, Agricultural plant Leaf Disease Detection Using Image Processing, Interna-tional Journal of Advanced Research in Electrical, Electronics and Instrumentation Engineering , S and S Publication vol. 2, Issue 1, pp: 599-602, 2013.
[6] Mokhled S. Al-Tarawneh An Empirical Investigation of Olive Leave Spot Disease Using Auto-Cropping Segmentation and Fuzzy C-Means Classification, World Applied Sciences Journal , vol.23, no.9, pp:1207-1211,2013.
[7] Yan-Cheng Zhang, Han-Ping Mao, Bo Hu, Ming -Xi Li, Feature Selection of Cotton Disease leaves Image Based on Fuzzy feature Selection Techniques, Proceedings of the 2007 International Conference on Wavelet Analysis and Pattern Recognition, pp:124-129, Beijing, China, Nov. 2007.
[8] Haiguang Wang, Guanlin Li, Zhanhong Ma, Xiaolong Li, Im-age Recognition of Plant Diseases Based on Back propagation Networks, 5th International Congress on Image and Signal Processing, pp-894-900, Chongqing, China, 2012
[9] Simona E. Grigorescu, Nicolai Petkov, and Peter Kruizinga, Comparison of Texture Features Based on Gabor Filters , IEEE ransaction on Image Processing, vol. 11, No. 10, pp-1160-1167, oct 2002 .
[10] S. Arivazhagan , R. Newlin Shebiah , S. Ananthi, S. Vishnu Varthini , Detection of unhealthy region of plant leaves and classification of plant leaf diseases using texture features, Commission Internationale du Genie Rural(CIGR) journal, vol. 15, no.1, pp:211-217, March 2013.
[11] Dheeb Al Bashish, M. Braik, and S. Bani-Ahmad, A Frame-work for Detection and Classification of Plant Leaf and Stem Diseases, 2010 International Conference on Signal and Image Processing, pp: 113-118, Chennai, India, 2010.
[12] Song Kai, liu zhikun, Su hang, Guo chunhong , A Research of maize disease image recognition of Corn Based on BP Networks, Third International Conference on Measuring Tech-nology and Mechatronics Automation,pp:246-249, Shenyang , China, 2011.
[13] H. Al-Hiary, S. Bani-Ahmad, M. Reyalat, M. Braik and Z. ALRahamneh, Fast and Accurate Detection and Classification of Plant Diseases, International Journal of Computer Appli-cations, Wageningen Academic publishers, vol. 17, no.1, pp: 31-38, March 2011.
[14] A.Menukaewjinda, P.Kumsawat, K.Attakitmongcol, A.Srikaew, Grape leaf disease detection from color imagery using hybrid intelligent system, Proceedings of electrical Engineering/electronics, Computer, Telecommunications and Information technology (ECTI-CON), vol 1. pp: 513-516, Krabi, Thailand, 2008.