New measurement of the
242Pu
(n,
γ
) cross section at n_TOF
J. Lerendegui-Marco1,a, C. Guerrero1, M. A. Cortés-Giraldo1, J. M. Quesada1, E. Mendoza2, D. Cano-Ott2, K. Eberhardt3, A. Junghans4, and the n_TOF Collaboration5
1Dpto. de Física Atómica, Molecular y Nuclear, Universidad de Sevilla, 41012 Sevilla, Spain
2Centro de Investigaciones Energéticas, Medioambientales y Tecnológicas (CIEMAT), 28040 Madrid, Spain 3Johannes Gutenberg-Universität Mainz, 55128 Mainz, Germany
4Helmholtz-Zentrum Dresden-Rossendorf, D-01314 Dresden, Germany 5European Center for Nuclear Research (CERN),CH-1211 Geneva, Switzerland
Abstract.The use of MOX fuel (mixed-oxide fuel made of UO2and PuO2) in nuclear reactors allows substituting a large fraction of the enriched Uranium by Plutonium repro-cessed from spent fuel. With the use of such new fuel composition rich in Pu, a better knowledge of the capture and fission cross sections of the Pu isotopes becomes very im-portant. In particular, a new series of cross section evaluations have been recently carried out jointly by the European (JEFF) and United States (ENDF) nuclear data agencies. For the case of242Pu, the two only neutron capture time-of-flight measurements available, from 1973 and 1976, are not consistent with each other, which calls for a new time-of flight capture cross section measurement. In order to contribute to a new evaluation, we have perfomed a neutron capture cross section measurement at the n_TOF-EAR1 facility at CERN using four C6D6detectors, using a high purity target of 95 mg. The preliminary results assessing the quality and limitations (background, statistics andγ-flash effects) of this new experimental data are presented and discussed, taking into account that the aimed accuracy of the measurement ranges between 7% and 12% depending on the neu-tron energy region.
1 Introduction and motivation
The measurement of accurate capture and fission cross sections is essential for the design and oper-ation of current and innovative nuclear systems aimed at the reduction of the nuclear waste [1]. The spent fuel from current nuclear reactors contains a significant fraction of plutonium, which can be separated from the fuel matrix. This plutonium contains 66% of the fissile239Pu and241Pu, that can be combined with depleted uranium (238U) to make what is known as mixed oxide (MOX) fuel. In this way the Pu from spent fuel and the depleted uranium, otherwise considered as waste, are used in a new reactor cycle, contributing in this way to the long-term sustainability of nuclear energy. Currently, the use of MOX fuel in thermal power reactors has been established in several countries. However, a much more efficient use of plutonium will ultimately be made in fast reactors, where multiple recy-cling is possible and has been demonstrated. The reader is referred to Ref.[2] for more details on the status and progress in MOX fuel technologies.
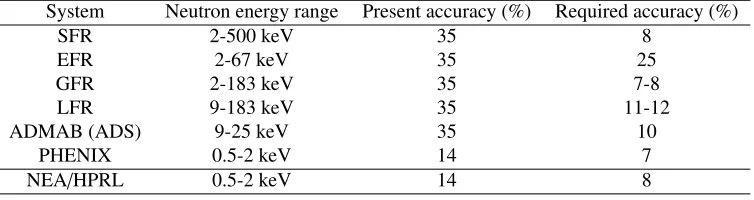
NEA/HPRL 0.5-2 keV 14 8
The extensive use of MOX fuels in fast reactors calls for a revision of the neutron cross sections that play a role in the neutronics of such reactors and are not known with enough accuracy yet. For the particular case of242Pu, the first attempts to measure its neutron capture cross section were made in 1973 and 1976, when Portmans et al. [3] and Hockenbury et al. [4] used the time-of-flight technique for measurements at low (below 1.3 keV) and high (6-87 keV) neutron energies, respectively. A few years later, Wisshak and Kaeppeler [5, 6] measured the capture cross section in the 10-90 and 50-250 keV energy intervals. The comparison of the different results indicates an uncertainty of about 35% in the capture cross section in the keV region. In this context, the Nuclear Energy Agency recommends in its “High Priority Request List” [7] and its report WPEC-26 [8] that the capture cross section of 242Pu should be measured with an accuracy of at least 7-12% in the neutron energy range between 500 eV and 500 keV (see Table 1). Furthermore, interpretations with JEFF-3.1 of the PROFIL and PROFIL-2 experiments carried out in the fast reactor PHENIX have shown an overestimation of about 14% of the242Pu capture cross section [9, 10]. In addition to the direct measurement in the fast energy region (En>2 keV), accurate average radiation width and strength function are required to solve some ambiguous results obtained between optical model calculations and the statistical analysis of the s-wave resonance parameters [11]. This calls as well for an accurate measurement of the resonance region (1 to 1000 eV) with enough resolution and statistics to determine accurately the corresponding average resonance parameters.
For all of the above, a new measurement of the242Pu cross section at the n_TOF facility was proposed to the ISOLDE and Neutron Time-of-Flight Committee (INTC) [12] and was approved in September 2013. The material production and sample preparation took place during the first semester of 2015 in collaboration with the JGU Mainz and the HZ Dresden-Rossendorf research centers. Fi-nally, the experiment was succesfuly performed in summer 2015. In the following section we briefly describe the n_TOF facility and the experimental setup. Section 3 provides some details on the mea-suring technique and the preliminary data and some preliminary results are presented in Section 4.
2 Experimental setup
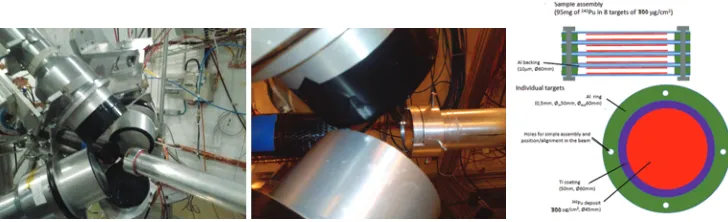
Figure 1.Experimental setup for the detection ofγ-rays from capture on242Pu: (Left) 4 C
6D6detectors looking at the242Pu sample assembly (center), composed of by several thin targets (right).
characterization of EAR1 can be found in Ref. [13], while the description of the EAR2 beam line, still in its commissioning phase, is given in Ref. [14]. The measurement presented in this work was performed in EAR1, featuring a better time resolution and consequently a better capability to resolve resonances up to higher neutron energies than in EAR2.
At n_TOF, the radiative capture measurements can be performed using two different detection
systems available: the Total Absorption Calorimeter TAC [15] (a 4πBaF2 array) and the Total
En-ergy detectors (deuterized benzene (C6D6) scintillators [16]). The latter have been chosen for this
measurement mainly because they suffer significantly less from the so-calledγ-flash, thus allowing
us to measure up to the required neutron energy (see Table 1). In addition, this detection setup fea-tures a much lower neutron sensitivity than the TAC. This advantage is counterbalanced by a more complicated analysis technique, discussed in Section 3.
Neutrons coming from the spallation target, travel 185 m in vacuum along the beam line until
they reach the242Pu sample, with a diameter larger than the beam, inducing radiative capture
reac-tions. Theγ-ray cascades are detected with 4BICRON C6D6 scintillators placed at∼10 cm of the
sample (Figure 1). The gain of the C6D6detectors was adjusted to record signals up to 14 MeV in
the flash-ADC cards. The detectors were calibrated in energy using fiveγ-ray energies from137Cs,
88Y,241Am-9Be and244Cm-13C and the energy calibration was validated with the comparison between
experiment and Geant4 simulations of the detector response to this sources. Upstream from the sam-ple, the neutron beam is monitored with the SiMon monitor which consists of four silicon detectors
looking at a thin lithium foil for detecting6Li(n,α) reactions [17]. The signals registered in each
detector are recorded by our digital data acquisition system. The new 12-bit cards with a maximum
sampling rate of 900MSamples/s enhance the amplitude (deposited energy) resolution, timing and
signal reconstruction capabilities.
The sample preparation was carried out within the CHANDA project [18] by the University of
Mainz and the HZDR research center. A total of 95 mg of 99% pure242Pu, a series of eight thin242Pu
samples 45mm in diameter were prepared by electrodeposition of242Pu on a thin (10μm) Al backing
covered with 50 nm Ti coating, reaching a maximum density of 0.8 mg/cm2 of 242Pu per sample.
must be weighted with an energy (pulse height) dependent weighting function (WF); this is known as thePulse Height Weighting Technique(PHWT).
To calculate the WF, the response distribution of each detector must be well known. Since its experimental determination is impossible due to the lack of monoenergeticγ-ray sources in the whole energy range of interest (0-12 MeV), Monte Carlo simulations, performed in this work using the
Geant4toolkit [21], are the best solution. In these simulations the details on the experimental setup and the 8-target sample were implemented in order to consider, among other effects, the attenuation of photons in the242Pu targets. From these accurate simulations we extract response functions for each detector to a large number ofγ-ray energies,Ri j= countsNi i j, wherejrepresents the bin number for a certain deposited energy andiis theγ-ray energy. The response functions are appropiately broaden to consider the detectors’ energy resolution before being used as the input to obtain the WF. The energy dependence of this resolution is extracted from the fit of the experimental broadenings with simulated responses to calibration sources at differentγ-ray energies. The WF’s are assumed to be 4th-8th-degree polynomials,W
j=
kak·(Ej)k, and their parameters,ak, are obtained with theMinuit function minimization code. The obtained WF’s satisfy (within 2%), in the whole energy range from 100 keV-10 MeV, the proportionality condition
j
Wj·Ri j=Ei; where
j
Ri j=i.
4 Preliminary analysis and first results
The digitalized movies, in the so-called raw data format, are transfered and stored in the CERN Ad-vanced STORage manager (CASTOR). This raw data files are processed with a dedicated pulse shape analysis routine [22]. It has been extensively validated to ensure the correct reconstruction of the am-plitude, area, time, and all other relevant features of each recorded signal. The output of this program provides files inROOT format, including the correlation of the complete set of variables that char-acterize the signals. Last, the data reduction is performed with the TTOFsort routine (developed by F. Gunsing), that implements the energy calibration of the detectors, applies the weighting functions and performs a coicidence rejection to satisfy the condition of detecting just oneγ-ray, among many other options. This program provides histograms of detected counts as a function of the time-of-flight, deposited energy, etc...
Figure 2. Left: Sketch of the individual targets and the assembled stack with 8 targets. Right: Picture of the 242Pu sample assembly.
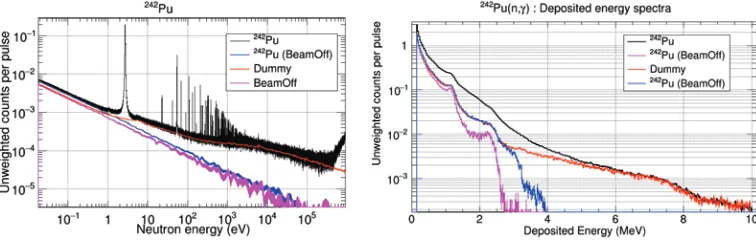
242Pu assembly without242Pu deposits inside and is the main neutron related background component.
In addition to the contribution of the backings in the sample, we also have to consider the room
back-grounds. with and without the242Pu targets in place. The ratio of signals from capture on242Pu to
background can be enhanced with an addecuate choice of the condtions in amplitude (or deposited
energy Edep). The corresponding deposited energy distributions are presented in the right panel of
Figure 2, where the preliminary thresholds in Edephave been set to 150 keV and 10 MeV. This figure
shows that the excess of counts coming from242Pu are below the neutron separation energy of the
compound nucleus,Sn=5.035 MeV. The increase of the beamoffbackground when the242Pu is in
place, is thought to come from the spontaneous fissionγ-rays.
In order to extract the neutron capture yield,Yexp, the different background contributions shown
in Figure 2 are subtracted from the total counts following a two step process. First the beamoff
contributions are substracted: A =242 Pu−242Pu_beamo f f and B = Dummy− Beamo f f. Then
C=A−B, represents the counts coming from reactions on242Pu. However, not every reaction on242Pu
is induced by neutrons. Indeed, for targets with a high atomic number Z, an additional background
contribution comes from in-beamγ-rays induced reactions (compton∝Z2and pair production∝Z).
A high Z material with negligible neutron capture cross section,natPb in our case, was measured
to estimate the level of the in-beamγ-ray induced background, assumming that theγ-ray induced
background, Bγ, dependence on Z and n(atoms/barn) is given byBγ ∝ Z3/2·n. After scaling the
counts in Pb to the expected background in our measurement, theγ-ray background is found to be
negligible at low energies and as high as 35% of242Pu after substracting thedummyin the hundreds of
keV region. In this energy range the reduction of uncertainties will be mainly limited by the sytematic uncertainties related to the dummy sample since it represents up to 80% of the total counts.
According the to PHWT (see Section 3), from the weighted counts after background substraction,
Cw, we extract the experimental capture yield as
Yexp(En)= fc·fsat·
Cw(En)
Φ(En)·BIF·(Sn+En)
where Φ represents the accurately measured neutron flux of n_TOF- EAR1 [23],BIFstands for
Beam Interception Fraction, being the unity since the sample covers the full beam; fc is a factor
that corrects for the counts lost below the amplitude threshold, the multiple detection of photons and
the presence of conversion electrons; and fnorm = Y1sat, is the normalization factor obtained from the
measured saturated value of the capture yield of197Au at E
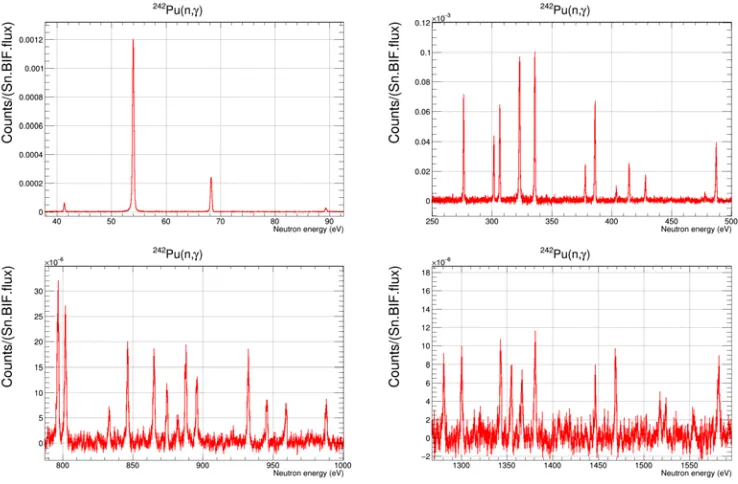
Figure 3.Capture counts per incident neutron (not in Yield units) obtained in the RRR from the tenths of eV to ∼1.5keV
the preliminary results obtained after dividing the capture counts by the neutron flux, the BIF and Sn, and thus proportional to the capture yield. Four different energy ranges are shown to illustrate first the high level of statistics in the RRR below 1 keV and the promising results above this energy that hopefully will allow a resonance analysis up to 2keV. Beyond 2 keV we cannot clearly resolve every resonance due to the increasing level density and the limited statistics and we will thus employ the Unresolved Resonance Region (URR) formalism. The capability to extract a reliable cross section in the URR up to 500 keV with this experimental technique and background conditions will be validated with a carefoul analysis of the197Au(n,γ) measurement, which presents a standard cross section above 150 keV.
5 Summary and conclusions
aim to collaborate with the evaluators in CEA Cadarache (JEFF) or ORNL (ENDF) in order to include the new experimental data in the upcoming release of the242Pu(n,γ) cross section evaluation.
Acknowledgments
This measurement has received funding from the EC FP7 Programme under the projects NEUTAN-DALUS (Grant No. 334315) and CHANDA (Grant No. 605203), and the Spanish Ministry of Econ-omy and Competitiveness projects FPA2013-45083-P and FPA2014-53290-C2-2-P.
References
[1] N. Colonna et al, Energy Environ. Sci.3, 1910-1917(2010)
[2] International Atomic Energy Agency, Status and advances in Mox fuel technologyIAEA Technical Reports Series415(2003)
[3] F. Poortmans et al., Nucl. Phys A207, 342-352(1973) [4] R.W.Hockenbury et al., SP425, 584-586 (1975)
[5] K. Wisshak and F. Kaeppeler, Nucl. Sc. and Eng.66, 363 (1978) [6] K. Wisshak and F. Kaeppeler, Nucl. Sc. and Eng.69, 39 (1979) [7] NEA High Request Priority Listhttp://www.nea.fr/dbdata/hprl/
[8] Salvatores and R. Jacqmin, Uncertainty and target accuracy assessment for innovative system using recent covariance data evaluations(NEA/WPEC-26, 2008)
[9] G. Noguere, E. Dupont, J. Tommasi and D. Bernard. Technical note CEA Cadarache, NT-SPRC/LEPH-05/204 (2005)
[10] J. Tommasi, E. Dupont and P. Marimbeau., Nucl. Sci. Eng.154, 119-133 (2006)
[11] E. Rich, G. Noguere, C. De Saint Jean and O. Serot. Proceedings of the Int. Conf. on Nuclear Data for Science and Technology, Nice, France, 2007
[12] C. Guerrero, E. Mendoza et al.Radiative capture on242Pu for MOX fuel reactors, CERN-INTC-2013-027 (INTC-P-387) (2013)
[13] C. Guerrero et al., Eur. Phys. J. A49, 27(2013)
[14] C. Weiss et al., Nucl Instrum. and Meth. A799, 90–98 (2015) [15] C.Guerrero et al., Nucl. Instrum. Methods A608, 424 (2009)
[16] P. Mastinu et al.,New C6D6 detectors: reduced neutron sensitivity and improved safety, CERN-n_TOF-PUB-2013-002 (2013)
[17] S. Marrone et al., Nucl. Instrum. Methods A517, 389 (2004).
[18] CHANDA:solving CHAllenges in Nuclear DAta. Project funded by FP7-EURATOM-FISSION, European Commission.
[19] R.L. Macklin, J.H. Gibbons, Phys. Rev.159, 1007 (1967)
[20] Abondano et al., Nucl. Instrum. and Meth. A521, 454–467(2004) [21] S. Agostinelli et al., Nucl. Instrum. Methods A506, 250 (2003)
[22] P. Zugec et al.,Pulse Shape Analysis routines for n_TOF-Phase3. Nucl. Instrum. Methods A. To be published (2015)