Intelligent Methods for Enhancing Lifetime of
Sensor Node
Ganesh Sharma
1, Dipanjan Bhattacharjee
2PG Student [DEAC], Dept. of ECE, Sikkim Manipal Institute of Technology, Sikkim, India1 Assistant Professor, Dept. of ECE, Sikkim Manipal Institute of Technology, Sikkim, India2
ABSTRACT: Wireless sensor network (WSN) consists of a large amount of small battery powered devices which perform tasks like processing, radio transmission-reception, sensing and actuating. Wireless sensor network devices have limited energy to complete large tasks. Energy consumption still remains the limitation of this field.The lifetime of the sensor node is highly dependent on its power source. The sensor nodes are basically placed in remote location and it mainly battery operated.An ordinary node performs two major tasks. Firstly, it senses physical phenomenon and performs some computation and forwards it to other nodes, if necessary. Secondly, it also acts as relay point for other sensor nodes to route the data.The 80% of the total power of the node is consumed during the transmission. Hence if the sensor continuously transmits, the battery of sensor may run away which makes the sensor node inactive. In order to reduce this power and increase the lifetime of the sensor node various methods can be implemented. This paper describes the various methods to reduce the transmission time and power and also increase the battery life.
KEYWORDS: sensor node, data fusion, power management protocol, solar energy
I. INTRODUCTION
Wireless Sensor Networks (WSN) is the collection of large number of low powered sensor nodes deployed for sensing & monitoring real world physical phenomenon like temperature, humidity, soil moisture, pressure, etc. Due to low powered battery and unattended deployment of sensor nodes, conserving sensor node energy requirement is one of the prime challenges in WSN. The life time of the sensor node must be longer as it is deployed in remote location. Charging and recharging battery of sensor nodes becomes quite difficult especially in hostile environment. Even though, it is possible to replace the battery, it will interrupt the continuous operation of WSNs. This may lose some of the packets. Losing some of the packets is not good for the application where continuous surveillance is needed. Reliability of wireless sensor network is deliberated as amount of time for which the sensor network is functioning. The sensor are robust hence it can operate for years but the battery incorporated with the system may run away soon. So in order to make the efficient use of the sensor node, the power consumption protocols of the node must be regulated without affecting the actual operation and precision of the system. There are various methods that can be implemented in order to increase the efficiency of the power consumption and increase the life time of the node. These methods are (1) power management protocol; (2) inter nodal data similarity and (3) solar powered sensor node. All the above methods will be discussed in the subsequent section.
II. LITERATURE SURVEY
like mobile ad hoc networks or cellular networks. The paper analyzes seven different existing routing protocols namely, mLeach, pathdcs, BVR, ABVCap, PSVC, VCP and greedy HVP in WSNs on the basis of the lifetime of sensor networks [3]. Many routing protocols have been proposed for sensor network, especially cluster based routing protocols. Cluster based routing protocols are best known for its energy efficiency, network stability and for increasing the life time of the sensor network. Low Energy Adaptive Clustering Hierarchy (LEACH) is one of the fundamental protocols in this class. This research paper proposes a new energy efficient cluster based protocol (EECP) for single hop heterogeneous wireless sensor network to increase the life of a sensor network. EECP is an extension of LEACH which takes the full advantage of heterogeneity. It improves the network lifetime, stable region and throughput of the network [4]. WSN is classified as ad-hoc network; however the routing protocols used in WSN having many differences to traditional ad-hoc networks in which the most important issue is network energy consumption. This paper proposes a new routing protocol basing on LEACH protocol for wireless sensor networks to extend the lifetime of wireless sensor networks in terms of BS placed in the sensor area. However, this protocol is only applied in the case of BS in the sensor area. But with BS is far from sensor area, we cannot apply this protocol [5]. Clustering sensor node is an effective topology for the energy constrained networks. So energy saving algorithm has been developed in which clusters are formed. Considering a subset of high energy nodes as a cluster-head and another subset of powerful nodes is ask to go to sleep. Proposed approach is implemented in MATLAB, Simulation results shows that it can prolong the network lifetime than LEACH protocol, and achieves better performance than the existing clustering algorithms such as LEACH [6]. Clustering techniques provides an effective way to prolong the lifetime. This paper proposes energy efficient using dynamic clustering (EEUDC) which provides a new way to create clusters and utilize the energy of the nodes. The proposed scheme can partition the nodes into clusters and select the cluster head among the nodes [7]. To maximize the lifetime of the sensor node it is preferable to distribute the energy dissipated throughout the wireless sensor network in order to minimize maintenance and maximize overall system performance. This paper introduces parallel load sharing technique to increase the life time of all the nodes in a way to get maximum efficiency from the network [8]. Clustering is one of the key techniques used to improve lifetime of wireless sensor network by reducing energy utilization. Clustering partitions sensor network into groups called as cluster, with high energy node acting as cluster head. This paper provides survey of various clustering algorithms highlighting their objectives and features [9].
In order to increase the energy of the nodes it is necessary to implement energy routing algorithms. This paper proposes a novel way by using clustered multipath routing to improve the lifespan of sensor networks [11].The distance between a sensor node and sink node is reduced; the energy consumption will also reduce. Here, the proposed system implements multiple sink nodes with an energy efficient routing algorithm based on local information only. Simulation results show that the networks with this lifetime-oriented strategy achieve a significant improvement on network lifetime [11].
III. POWER MANAGEMENT PROTOCOL (PMP)
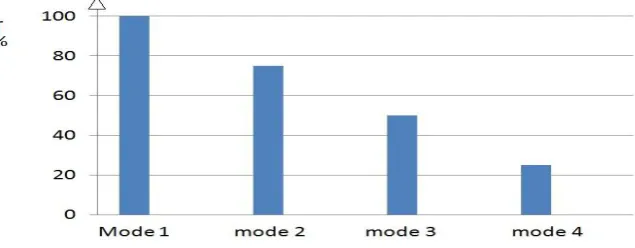
Power management protocol is based on the power level of the battery present in the sensor node. In this method the level of the power of the battery is continuously monitored and different protocol is implemented based on that.
Figure 1 shows the graph of modes selection based on the power level of the battery of the sensor node. When the battery level is 100% then the mode 1 will be implemented. When it is 75% then mode 2 will be implemented and so on. In mode 1 the frequency of the transmission of the sensed data from the sensor node to base station is high. In mode 2 the frequency of transmission will decrease, the frequency of transmission will decrease further in mode 3 and mode 4. When it reaches mode 4, the frequency of transmission will be very low and the node will only send health signal. In this mode along with the health signal, the alarm signal may also be sent. This alarm signal will inform the base station that the particular node is running out of the supply. Hence the base station can either switch off the node or activate the redundant node for proper functioning of the system.
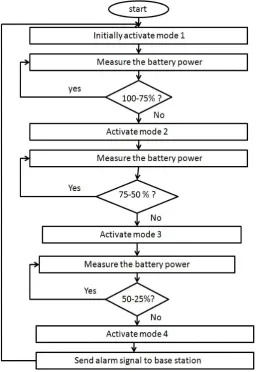
Figure 2: flow chart of execution of PMP
Figure 2 shows the flow chart for the execution of the power management protocol. Here the main functionality is dependent on the power level of the battery and the main task is to measure the battery level. So based on the battery level various power management modes are selected and alarm signal will be sent to the base station wirelessly.
IV. INTER NODAL DATA SIMILARITY
sense the particular environment, then during normal condition the similar value may be observed from most of the node. By incorporating the intelligence in the system, instead of sending the similar data from the various sensors, we can send only the single data instead of sending whole set of data. The inter-node data similarity is measured by calculating similarity metrics like -Euclidean Distance, Cosine similarity and Pearson correlation coefficient. Finally, energy conservation technique is applied if the similarity metrics suggests high correlation between sensor nodes data.
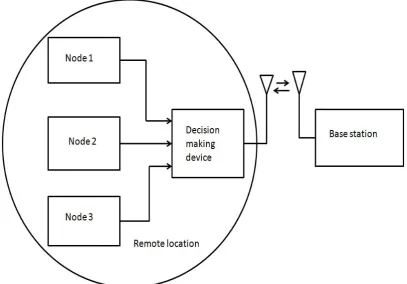
Figure 3: Basic block diagram for data fusion technique
Figure 3 shows the basic block diagram for the acquisition and transmission of sensed data from the remote location where sensor has been deployed and the base station. The sensor node has an intelligent decision making device capable of data fusion, to reduce the transmission power, which in turn increase the life time of the sensor node.
V. SIMILARITY METRICS
In this section the theoretical methods to calculate inter-node data association is discussed. Let [𝑖] be the datasets from sensor node X and [𝑖] be the datasets from sensor node Y. Let n be total number of samples used for analysis. The commonalities between data source due to spatial and temporal relation can be calculated using following similarity metrics [14].
Euclidean score is a method of calculating a score of how similar two things are. We get a value between 0 and 1, 1 meaning they are identical 0 meaning they don't have anything in common. Euclidean score is calculated as given in equation 1
𝐸𝑢𝑐𝑙𝑖𝑑𝑒𝑎𝑛𝑆𝑐𝑜𝑟𝑒 = 1 (1 + 𝐸𝑢𝑐𝑙𝑖𝑑𝑒𝑎𝑛𝐷𝑖𝑠𝑡𝑎𝑛𝑐𝑒) (1)
Euclidean distance is the distance between two points in Euclidean space. Euclidean space was originally devised by the Greek mathematician Euclid around 300 B.C.E. to study the relationships between angles and distances. The Euclidean Distance is calculated using following formula in equation (2)
𝐸𝑢𝑐𝑙𝑖𝑑𝑒𝑎𝑛𝐷𝑖𝑠𝑡𝑎𝑛𝑐𝑒 = √Σ (𝑥𝑖 − 𝑦𝑖) 2𝑛𝑖=1 (2)
𝐶𝑜𝑠𝑖𝑛𝑒 (cos 𝜃) = Σ 𝑥𝑖 ×𝑦𝑖𝑛𝑖=1 √Σ 𝑥𝑖2 𝑛𝑖=1 ×√Σ 𝑦𝑖2 𝑛𝑖=1 (3)
The cosine similarity is in the range of [−1,1], the similarity value of −1 means that data are exactly opposite, 0 meaning independent,1 meaning exactly the same, with in-between values indicating intermediate similarities or dissimilarities. Cosine similarity gives a measure of common variations observed between the samples of the nodes by evaluating the angles between the two data samples considered.
Pearson Correlation Coefficient(r) is known as Pearson Product-Moment Correlation Coefficient (PPMC). The Pearson product-moment correlation coefficient is a measure of the linear correlation between two variables X and Y, giving a value between +1 and −1 inclusive, where 1 is total positive correlation, 0 is no correlation, and −1 is total negative correlation. As the value of r tends to 0, the greater is the variation. The formula for calculating PPMC is given in equation 4
(𝑟) = 𝑛 Σ 𝑥𝑦− Σ 𝑥 Σ 𝑦 [√𝑛 Σ 𝑥2−(Σ 𝑥)2] [√𝑛 Σ 𝑦2−(Σ 𝑦)2] (4)
After applying the above matrices the suitable algorithm is applied for further processing of the data.
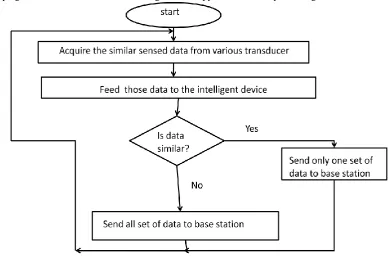
Figure 4: flow chart for execution of data fusion technique
Figure 4 shows the flow diagram of the process from data acquisition from various sensor nodes to the decision making up to the transmission of data toward the base station. If the set of data coming from two or more similar sensor deployed in nearby location are same then only a single set of data set is sent. If the sensed data is dissimilar then all set of the data is sent to the base station. Using this technique the total transmission power is saved, and the channel is also used efficiently which avoid the data collision.
IV. SOLAR POWERED SENSOR NODE
Figure 5: Basic block diagram of the solar powered sensor node.
Figure 5 shows the basic block diagram of the solar powered sensor node. The output of the solar panel is passed through the regulator for stabilization purpose. The regulated supply will recharge the battery when there is sufficient amount of light falling on the solar panel. As the sensor node will be deployed in remote location, hence the solar power will only be able to recharge the battery of the sensor node.
VII. CONCLUSION
In this paper, theoretical analysis of different ways by which we can improve the energy efficiency of the wireless sensor networks is presented. Wireless sensor networks are battery powered, therefore prolonging the network lifetime through a power aware node organization is highly desirable. As the lifetime of the sensor node is dependent on the life of the battery present in it. Hence by implementing the above methods, we can decrease the power consumption of the node or we can increase the battery life. So by implementing the above method the lifetime of sensor node can be increase without decreasing the efficiency of the entire system. The solar power system can be upgraded by using the auto steer able solar panel which wills make the optimum use of the solar energy.
REFERENCES
[1]. J. Saraswat, N. Rathi and P. P. Bhattacharya,” Techniques to Enhance Lifetime of Wireless Sensor Networks: A Survey,” Global Journal of Computer Science and Technology Network, Web & Security Volume 12, Issue 14, Version 1.0, 2012.
[2]. M. Cardei, D.Z. Du, “Improving Wireless Sensor Network Lifetime through Power Aware Organization,” Springer Science, Wireless Networks 11, pp.333–340,2005.
[3]. Md. Z. Hussain, M. P. Singh and R. K. Singh “Analysis of Lifetime of Wireless Sensor Network,” International Journal of Advanced Science and Technology Vol. 53, pp.117-126, April, 2013.
[4]. S. Kumar, M. Prateek, B. Bhushan “Energy Efficient (EECP) Clustered Protocol for
Heterogeneous Wireless Sensor Network,” International Journal of Advanced Research in Computer Science and Software Engineering 3 (7) , pp. 1448-1453, July - 2013.
[5]. T. C. Hung and N. H. Quan “A Proposal for Improve the Lifetime Of Wireless Sensor Network,” International Journal of Computer Networks & Communications (IJCNC) Vol.6, No.5 , pp.59-69, September 2014.
[6]. M. Raghatate and D. W. Wajgi “An Energy Saving Algorithm to Prolong the Lifetime of Wireless Sensor Network,” International Journal of Wireless & Mobile Networks (IJWMN) Vol. 6, No. 5 , pp.33-44, October 2014.
[7]. S. M. Priya and S. Karthikeyan “Increasing Lifetime of Sensor Networks by Using Dynamic clustering,” International Journal of Wireless Communications and Networking 3(1), pp. 1-5, 2011.
[8]. A. G Surati, R. R. Jagtap, “Parallel Load Sharing Technique Used To Increase the Life Time of
Wireless Sensor Network,” International Journal on Recent and Innovation Trends in Computing and Communication,Volume: 3 Issue: 3, pp. 1017-1022,March 2015.
[9]. V. V. Deshpande, A. R. B. Patil “Clustering for Improving Lifetime of Wireless Sensor Network: A Survey,” International Journal of Engineering Science Invention,Volume 2 Issue 5, pp.1-6, May. 2013.
[10]. S.M. Priya, S. Karthikeyan” An Efficient Clustered Multipath Routing to improve lifespan in WSN,” IJCSI International Journal of Computer Science Issues, Vol. 9, Issue 2, No 2, pp.182-187, March 2012.
[11]. S. Chattopadhyay, G.Vijayalakshmi “Improving the Lifetime of Wireless Sensor Network through Energy Conservation,” International Journal of Computer Science and Information Technologies, Vol. 5 (2) , pp. 2345-2347, 2014.
[12]. K. T. Soe “Increasing Lifetime of Target Tracking Wireless Sensor Networks,” International Journal of Electrical, Computer, Energetic, Electronic and Communication Engineering Vol: 2, No: 6, pp.1128-1133, 2008.
[13]. S. Anandamurugan, C.Venkatesh “Increasing the Lifetime of Wireless Sensor Networks by using AR (Aggregation Routing) Algorithm,” IJCA Special Issue on “Mobile Ad-hoc Networks” MANETs, pp.180-186, 2010.