ISSN(Online): 2319-8753 ISSN (Print): 2347-6710
I
nternational
J
ournal of
I
nnovative
R
esearch in
S
cience,
E
ngineering and
T
echnology
(An ISO 3297: 2007 Certified Organization)
Website: www.ijirset.com
Vol. 6, Issue 3, March 2017
Role of Big Data in Imaging Modalities to
Classify the Image Using SVM
Anshu Dhabhai
1, Yogesh Kumar Gupta
2M.Tech Student, Department of Computer Science, Banasthali University, Jaipur, Rajasthan, India 1
Assistant Professor, Department of Computer Science (AIM & ACT), Banasthali University, Jaipur, Rajasthan, India 2
ABSTRACT: The amount of images are increasing, we need to collect them every day so it create problem for us to extract the meaningful hidden information from vast collection datasets of raw images with no human intervention. So we need software’s to analyze those images with reliability and high accuracy which helps to reduce the workload and the goal is not only to get result with high accuracy but our goal is to detect the affected area by the disease and help to specialist to learn about the progress of a disease in early. To extract the region of interest from an image we process the image from different phases and in this paper we only focus on the classification method that is SVM (Support Vector Machine) to classify the images.
KEYWORDS: Big Data, Medical imaging, SVM.
I. INTRODUCTION
Big Data is a word which is used for the huge amount of data sets which have the big, extra various and difficult structure facing some difficulties in storing the data then analyzing and visualizing the data for the final outcome. Big data analytics is the procedure of probing huge amounts of data [1].
“Big Data” be a new concept present in IT companies, industries, academics and medical science and continuously increasing in the volume and the detail of some data are structured and mainly non-structured crossed the order of petabytes, Exabyte, and zetabyte and further rising year by year are generally referred as Big Data. These data obtained by health data records, science data records, online transactions, videos, email, images, audios, posts, logs, searching queries, some social networking sites, sensors, mobiles with their apps and must update time to time quickly [2, 3]. [5] Big data are characterized with the help of (1) various data have characteristics such as velocity, variety, volume and value, (2) it cannot classify in relational databases, and (3) data are originated, catches and carry out quickly for a final result. Big Data characterized in –
Volume - It is used to describe the size of data or the total quantity of different kind of data produced from various sources so continuously extends.
Variety- variety makes big data actually big. It mentions the various kinds of data that are composed through
social communications, sensors, mobile phones which contains video, audio, text, image, and data logs that are structured, unstructured and semi-structured format.
Velocity - It speaks about the data transmission rate.
Value- It is very valuable characteristic of large data. It mentions the procedure of uncovering the large unseen information from huge datasets.
Veracity- it is the data uncertainty. Data is uncertain because sometimes data are incomplete and inconsistence and this is the critical challenge in analyzing of data.
ISSN(Online): 2319-8753 ISSN (Print): 2347-6710
I
nternational
J
ournal of
I
nnovative
R
esearch in
S
cience,
E
ngineering and
T
echnology
(An ISO 3297: 2007 Certified Organization)
Website: www.ijirset.com
Vol. 6, Issue 3, March 2017
biggest sources to generating the real-time data through mobile sensors. Not only mobile but sensors are embedded in all type of things like vehicles, humans, and devices like home TV, hospitals which generates networks connected with the internet infrastructure and generating huge data [1].
To resolve the Big Data problem we have some techniques like Hadoop, Mapreduce and HDFS.
1. Hadoop:-
It is an open source framework, this powerful technology developed for distributed environment to execute the huge scale data set processing and complicated data computing. It eradicates the requirements of hardware computing which is costly dedicated space and software’s. It created by Google’s MapReduce and has two prime components that are MapReduce and HDFS.
2. MapReduce:-
It is also a software programming structure used for scattered computing environment. It was developed on the basis of GFS (Google File System) and adopted by an open-source Hadoop implementation. It uses the method of divide and conquers to divide the difficult big problems into their small sub problems and execute each of them in parallel; this process is hidden from programmers. It works in two phases –
Map phase- here master node data splits into several smaller data nodes. Then smaller data nodes are processed by worker node and it is controlled by job tracker node and for saving the results it used local file system so reducer can easily access it [1, 2, 4and 5].
Reduce phase- it accesses the results comes from the map steps .those results are analyzes and merges. Then the process of multiple reduces tasks aggregations are performed on worker nodes, and all tasks are executed to the Job Tracker control [1, 2, 4 and 5].
3. HDFS:-
It relies on client/server architecture. It planned to execute on the local file system so the extremely large files and cluster nodes can easily access the streaming data. It has an extreme power to tolerate the fault and can easily up the scale from one server node to thousands of server nodes when needed; every node provides own storage and estimation. It contains a Name Node that is executed over master server and manages the file system and Data Node which is responsible for read/write request from clients [1, 4 and 9].
So Hadoop provides some features such as scalability, fault-tolerance and flexibility.
II. BIG DATA IN HEALTHCARE
It mentions the electronic data sets which are too big and complicated to handle or manage by the traditional database. With the help of big data analytics, can reveal the extra hidden value from health information. Big Data is used in health to predict epidemics, cure disease, improve the quality of life it also includes the new insights in personalized care, improve patient outcomes and ignore the unnecessary cost. Healthcare includes clinical data, clinical decision support system (notes written by physicians and prescriptions, medical imaging, laboratory, pharmacy, insurance), patient data in electronic patient records, machine- generated data, emergency care data, news feed and articles in medical journals [13, 14 and 15].
III. IMAGE PROCESSING WITH CLASSIFICATION
ISSN(Online): 2319-8753 ISSN (Print): 2347-6710
I
nternational
J
ournal of
I
nnovative
R
esearch in
S
cience,
E
ngineering and
T
echnology
(An ISO 3297: 2007 Certified Organization)
Website: www.ijirset.com
Vol. 6, Issue 3, March 2017
means to extract the hidden, useful knowledge from the vast amount of data. It uses statistical, machine learning, virtualization and other manipulation techniques to extract the knowledge.
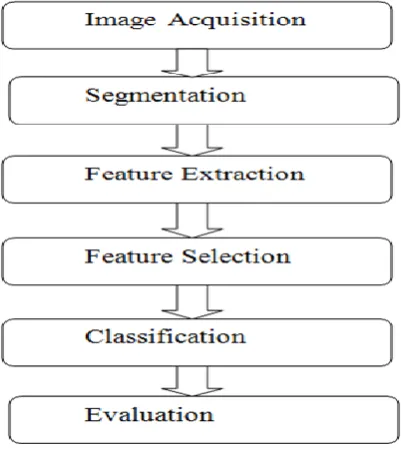
Fig.1 Digital Image Processing
Figure 1 shows the complete digital image processing steps. First of all in Images acquisition we collect the images from the sources then apply some preprocessing steps to clean the images by removing the noise and inconsistency that present in our image, resize the images according to the need. In Image segmentation we divide an image into their different segments, regions, or parts having different characteristics to get the particular specific region of the image. For extracting the Feature we analyze the images and objects then extract important feature or attributes that represents the objects of different classes. We can say that we join the attributes or features to make the new diminished value set. In Feature selection we apply selection process of selecting the features or attributes that are very relevant. The goal of the selection process is to remove the irrelevant and redundant feature or attribute which increase the accuracy of prediction and reduced the computing time that gives the best performance. Then we perform classification technique that is SVM to get the accuracy in our result. In last step we evaluate the classified result means we check that how much disabilities are present in our classified result.
Increasing the volume of big data and complexity of the data we are facing some difficulties to extract the region of interest. We apply some techniques on the images to find the hidden patterns from the images. Digital image processing includes image acquisition, segmentation, feature extraction, feature selection, classification and evaluation. In this paper our main focus on the classification and we use the SVM technique to classify the images to find ROI.
IV. LITERATURE REVIEW
Shilpa, K.Manjit. (2013), in this paper the definition of big data and explains three parameters (that are velocity, variety and volume), the evolution of big data with some literature review, problem description regarding storage capacity and processing of big data. To solve the problem in processing the huge amount of data it introduce new techniques and technologies for manipulating, analyzing and visualizing the big data such as Hadoop with some related components, HDFS and HPCC but Hadoop is one of most widely used technologies [2].
ISSN(Online): 2319-8753 ISSN (Print): 2347-6710
I
nternational
J
ournal of
I
nnovative
R
esearch in
S
cience,
E
ngineering and
T
echnology
(An ISO 3297: 2007 Certified Organization)
Website: www.ijirset.com
Vol. 6, Issue 3, March 2017
MapReduce, HDFS and HPCC. It also discusses benefits, barriers, and challenges of big data and the privacy and security issue.
It describes the knowledge discovery from data, that make easy to get information from complex data sets and helps for future insights. So it concludes that the challenge is not only to collect and manage data but we need powerful analytics with great insight to extract useful information from complex data [3].
Kumar, R. (2014), this paper contains the basic concepts of big data, its benefits and working. Describe all the types of data and introduce with Hadoop and its components MapReduce and HDFS. Further, it introduces with NoSQL and NewSQL with their characteristics and analyzes that how big data handle through Hadoop, NoSql, and NewSql [4].
Khan, N. (2014), in this paper author includes the fundamental concept of big data with increasing data, demand for HDD, handle the big data with some management tools and describes the role of big data in current environment, Hadoop and complete architecture of MapReduce and HDFS, some limitations of Hadoop, the life cycle of big data and management of data using technologies of big data which include the collection, filtering, analysis, storage, retrieval and discovery. It also discusses some opportunities, open issues and challenges [5].
Priyanka, K., and Kulennavar, N. (2014), here author defines and discusses the characteristics and the type of big data in healthcare such as clinical data, publications, clinical references, genomic data, streamed data, the web and social network data, business or external data. It also gives the examples of big data analytics in healthcare [6].
Raghupathi, W., and Raghupathi, V. (2014), this paper described the big data in healthcare; it discusses the advantages and four V’s (volume, velocity, variety, and veracity) and outlines the architecture framework, methodology, and briefly described the challenges [7].
Wang, L., and Alexander, C. A. (2015), here author describes the big data concepts and characteristics with six V’s (volume, variety, velocity, value, veracity and variability), healthcare data and some important issues that occur in big data, Some issues include the benefits of big data and its applications and opportunities in medical and healthcare areas. Methods and technologies also described. The Author discussed the challenges of big data in medical applications and healthcare [8].
Antonie, M. L., Zaiane, O. R., & Coman, A. (2001), in this paper author presents the concepts of medical imaging and the need to classify the medical images. Then discuss the general process of classification, data collection, image pre-processing steps and feature extraction phase. Further they used neural network techniques and the association rule classification technique for classification. At the end they perform the experiment on some data and get result [10]. GHITA, S., discussed here the complete classification process including image acquisition, image enhancement, feature extraction, and classification. It uses the apriory algorithm of association rule mining for classification of medical images. In this paper the goal of author is to increase the accuracy of diagnostic and optimize the decision time [11]. Smitha, P. et al. (2011), describes the importance of image data classification techniques foe medical images. Discuss the texture classification techniques (wavelet and Fourier transformation), neural network technique (Bayesian decision theory) including supervised and unsupervised techniques and some data mining techniques [12].
Lashari, S. A., and Ibrahim, R. (2013), discuss why we need classification, how can medical images classified using related technologies and methods such as texture classification, k-nearest neighbor, neural network, SVM and describe the proposed framework which consist the six phases as- “Data acquisition, Data pre-processing, Data partition, Soft set classification, Data analysis and performance evolution” to achieve accuracy and speed of computations [13].
J. Alamelu Mangai, et al. (2013), here author introduce with data mining techniques used for classification of medical images. They proposed a new approach for automated classification. Further they proposed discritization method to increase the classifiers accuracy, this method experiments on three classifiers that are K-nearest neighbor, Naïve bays and SVM [14].
V. CLASSIFICATION TECHNIQUE
1. SUPPORT VECTOR MACHINE
ISSN(Online): 2319-8753 ISSN (Print): 2347-6710
I
nternational
J
ournal of
I
nnovative
R
esearch in
S
cience,
E
ngineering and
T
echnology
(An ISO 3297: 2007 Certified Organization)
Website: www.ijirset.com
Vol. 6, Issue 3, March 2017
longer response time and inability to deal with isolated attributes, and the second one is sample used in it needed the larger size to get best outcomes and accuracy in prediction. It used in many fields like bioinformatics, text and image recognition etc.
The aim of SVM is tries to maximize the distance of the separating boundary between the two classes. Support vector machine is a linear machine whose design greatly influence by the position of support vectors. The position of hyperplane depends on the support vectors. Our main objective is to classify the data by selecting the best hyper plane which helps to separates the data points of the different classes. Then we calculate the margin. The Margin is the gap or space between breakable lines to the nearest point of both classes so we select the maximum margins. Some points that are closest to the hyper plane named as support vectors helps to classify the various objects and these support vectors exist on the boundary.
2. MATHEMATICAL MODEL REPRESENTATION
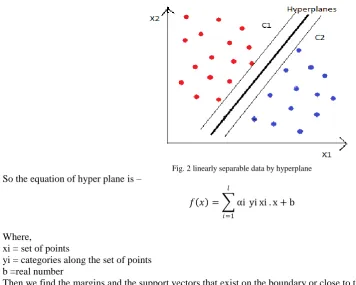
SVM introduced by Boser, Guyon & Vapnik. It is an algorithm which is developed with the help of statistical learning theory. Here, the points of training data set xi belongs to the two classes with label yi that is {-1, 1}. First of all, we select the best optimal separating hyper plane this is shown in figure 2.
Fig. 2 linearly separable data by hyperplane
So the equation of hyper plane is –
𝑓 𝑥 = αi
𝑙
𝑖=1
yi xi . x + b
Where,
xi = set of points
yi = categories along the set of points b =real number
ISSN(Online): 2319-8753 ISSN (Print): 2347-6710
I
nternational
J
ournal of
I
nnovative
R
esearch in
S
cience,
E
ngineering and
T
echnology
(An ISO 3297: 2007 Certified Organization)
Website: www.ijirset.com
Vol. 6, Issue 3, March 2017
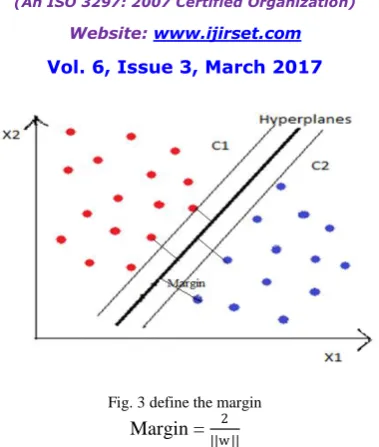
Fig. 3 define the margin
Margin = 2 ||w ||
Now Support vectors are those points that are closest or lies on the hyperplane. Figure 4 shows the support vectors.
Fig. 4 support vectors in SVM
Support vector = { f x = 𝛼𝑖 y𝑖 (𝑖 x𝑖T x) + b }
And the linear classifier has form –
𝑓 𝑥 = wTx + b
Where, b = bias
w = normal and weight factor
III.RESULT AND DISCUSSIONS
We use the specific classification technique that is Support Vector Machine which is used for classify the images and find out the area of interest. Here we discuss that how SVM classifier classifies the various objects and find the best hyper plane, margin and support vectors.
Process of SVM to classify the image on the basis of specified region
ISSN(Online): 2319-8753 ISSN (Print): 2347-6710
I
nternational
J
ournal of
I
nnovative
R
esearch in
S
cience,
E
ngineering and
T
echnology
(An ISO 3297: 2007 Certified Organization)
Website: www.ijirset.com
Vol. 6, Issue 3, March 2017
Step 2: Repeat the step 1 for generating the data2 with 2nd radius i.e. 3r, it means this time radius is three times greater than the 1st radius.
Step 3: Plot the points and plot the circle with radius 1st and 2nd.
Step 4: Compare the data1 and data2 and store the result in new matrix i.e. data3.
Step 4: Make the vector classification. Generate 200 rows with a single column and assigns the label +1 and -1. In this step, we separate the data points into two classes.
Step 5: Train the SVM classifier with kernel function and boxconstraint etc. This helps to draw a classifier that is very close to the circle of 1st radius.
Step 6: Find the support vectors that are close to the classifier boundary.
Fig. 5 (A) data points are distributed in disk with circle of radius 1st and 2nd, (B) separate the data points in two classes using classifier and assigns the
labels, and (c) calculate the margins and the support vectors [18]. .
Support vector machine is effective for high dimensions and it provides efficient results. In above algorithm, we try to describe the working of SVM for extracting the region of interest by using the Gaussian function and kernel function. In short, we select the best hyper plane that separates the data in two classes then we calculate the margin and the support vectors which classify the various objects.
VI. CONCLUSION
The size of data continuously increases with variety, volume, velocity, value, and veracity. This type of data is very complex to handle and maintain so for the solution we introduce some techniques like Hadoop, MapReduce, and HDFS. Big data used in healthcare so to handle the imaging data records, we process this imaging data use some techniques such as feature extraction, feature selection, segmentation, classification and evaluation which helps in extracting the feature, hidden information and the region of interest. But in this paper, we discussed classification technique only. We are going to discuss the specific classification technique that is SVM (support vector machine) to find out the specific region of interest. This technique is memory efficient and provides the efficient results.
REFERENCES
[1] Dhabhai, A., & Gupta, Y. K.., “A Study of Big Data in Cloud Environment with their Related Challenges”, International Journal of
Engineering Science, 2511, (2016).
[2] Dhabhai, A., & Gupta, Y. K.., “Empirical Study of Image Classification Techniques to Classify the Image using SVM: A Review”,
International Journal of Innovative Research in Computer and Communication Engineering, Vol. 4, Issue 10, October (2016).
[3] Shilpa, K.Manjit, “BIG Data and Methodology-A review”, International Journal of Advanced Research in Computer Science and
Software Engineering, (2013).
[4] Sagiroglu, S., & Sinanc D., “Big data: A review”, In Collaboration Technologies and Systems (CTS),International Conference on (pp.
ISSN(Online): 2319-8753 ISSN (Print): 2347-6710
I
nternational
J
ournal of
I
nnovative
R
esearch in
S
cience,
E
ngineering and
T
echnology
(An ISO 3297: 2007 Certified Organization)
Website: www.ijirset.com
Vol. 6, Issue 3, March 2017
[5] Kumar, R., Parashar, B. B., Gupta, S., Sharma, Y., & Gupta, N., “Apache Hadoop, NoSQL and NewSQL Solutions of Big Data”,
International Journal of Advance Foundation and Research in Science & Engineering (IJAFRSE), 1(6), 28-36, (2014).
[6] Khan, N., Yaqoob, I., Hashem, I. A. T., Inayat, Z., Mahmoud Ali, W. K., Alam, M. & Gani, A., ”Big data: survey, technologies,
opportunities, and challenges”, TheScientificWorldJournal, (2014).
[7] Priyanka, K., & Kulennavar, N., “A survey on Big Data analytics in health care”, International Journal of Computer Science and
Information Technologies, 5(4), 5865-8, (2014).
[8] Raghupathi, W., & Raghupathi, V., “Big data analytics in healthcare: promise and potential”, Health Information Science and Systems,
2(1), 1, (2014).
[9] Wang, L., & Alexander, C. A., “Big Data in Medical Applications and Health Care”, American Medical Journal, 6(1), 1, (2015).
[10] Oancea, B., & Dragoescu, R. M., “Integrating R and hadoop for big data analysis”, arXiv preprint arXiv: 1407.4908, (2014).
[11] Antonie, M. L., Zaiane, O. R., & Coman, A, “Application of Data Mining Techniques for Medical Image Classification”, MDM/KDD,
2001, 94-101, (2001).
[12] GHITA, S, “Using the Apriori Algorithm for Medical Image Classification”.
[13] Smitha, P., Shaji, L., & Mini, M. G., “A review of medical image classification techniques”, In International conference on VLSI,
Communication & Intrumrnataiom (pp.34-38) ,(2011).
[14] Lashari, S. A., & Ibrahim, R., “A Framework for Medical Images Classification Using Soft Set”, Procedia Technology, 11, 548-556,
(2013).
[15] J. Alamelu Mangai, Jagadish Nayak and V. Santhosh Kumar, “A Novel Approach for Classify Medical Image Using Data Mining
Techniques”, International Journal of Computer Science and Electronics Engineering (IJCSEE), Volume1, Issue2 (2013).
[16] Ko, B. C., Kim, S. H., & Nam, J. Y, “X-ray image classification using random forests with local wavelet-based CS-local binary patterns”,
Journal of digital imaging, 24(6), 1141-1151, (2011).
[17] Foody, G. M., & Mathur, A, “A relative evaluation of multiclass image classification by support vector machines”, IEEE Transactions on
geoscience and remote sensing, 42(6), 1335-1343, (2004).
![Fig. 5 (A) data points are distributed in disk with circle of radius 1st and 2nd, (B) separate the data points in two classes using classifier and assigns the labels, and (c) calculate the margins and the support vectors [18]](https://thumb-us.123doks.com/thumbv2/123dok_us/1613358.1200070/7.595.75.529.306.467/distributed-separate-classifier-assigns-calculate-margins-support-vectors.webp)
