DOI: 10.1534/genetics.105.048603
Maize Adaptation to Temperate Climate: Relationship Between Population
Structure and Polymorphism in the
Dwarf8
Gene
Le´tizia Camus-Kulandaivelu,*
,†Jean-Baptiste Veyrieras,* Delphine Madur,* Vale´rie Combes,*
Marie Fourmann,* Ste´phanie Barraud,* Pierre Dubreuil,
‡Brigitte Gouesnard,
†Domenica Manicacci* and Alain Charcosset*
,1*UMR de Ge´ne´tique Ve´ge´tale, INRA UPS INA-PG CNRS, Ferme du Moulon, 91190 Gif-sur-Yvette, France,†UMR 1097 Diversite´ et Ge´nomes des Plantes Cultive´es, INRA Domaine de Melgueil, 34130 Mauguio, France and‡Biogemma SAS, Campus Universitaire des Ce´zeaux,
F63170 Aubie`re, France Manuscript received July 21, 2005 Accepted for publication January 9, 2006
ABSTRACT
To investigate the genetic basis of maize adaptation to temperate climate, collections of 375 inbred lines and 275 landraces, representative of American and European diversity, were evaluated for flowering time under short- and long-day conditions. The inbred line collection was genotyped for 55 genomewide sim-ple sequence repeat (SSR) markers. Comparison of inbred line population structure with that of land-races, as determined with 24 SSR loci, underlined strong effects of both historical and modern selection on population structure and a clear relationship with geographical origins. The late tropical groups and the early ‘‘Northern Flint’’ group from the northern United States and northern Europe exhibited different flowering times. Both collections were genotyped for a 6-bp insertion/deletion in theDwarf8 (D8idp) gene, previously reported to be potentially involved in flowering time variation in a 102 American inbred panel. Among-group D8idp differentiation was much higher than that for any SSR marker, suggesting diversifying selection. Correcting for population structure,D8idpwas associated with flowering time under long-day conditions, the deletion allele showing an average earlier flowering of 29 degree days for inbreds and 145 degree days for landraces. Additionally, the deletion allele occurred at a high fre-quency (.80%) in Northern Flint while being almost absent (,5%) in tropical materials. Altogether, these results indicate thatDwarf8could be involved in maize climatic adaptation through diversifying selection for flowering time.
M
AIZE arose from a single domestication that occurred in southwestern Mexico 9000 years ago from a strain of teosinte Zea maysssp. parviglumis(Matsuoka et al. 2002b). Native Americans spread
maize over North and South America, generating a wide diversity of landraces adapted to local environ-mental conditions, from tropical to cool temperate (nowadays Canada and southern Chile). One of the prominent maize types in this adaptation history is the Northern Flint race (Brownand Anderson1947)
cul-tivated in northeastern America during pre-Colombian times. This early flowering type has adapted to cold temperate regions and was reported to have an ex-ceptional genetic divergence compared to other pre-Colombian maize tropical or subtropical landraces that were cultivated in present-day Mexico, the southwest-ern United States, and the Caribbean islands (Doebley
et al.1986). In North America, primary genetic pools (Northern Flint, tropical, and subtropical) cultivated by Native Americans were then used by colonists to create
new landrace varieties. Both the historical records and genetic studies show that the subtropical Southern Dent type was crossed with Northern Flint 200 years ago, leading to the Corn Belt Dent type adapted to the tem-perate midwestern United States region (Doebleyet al.
1988).
With respect to maize adaptation in Europe, the work
of Rebourget al.(2003) based on both molecular and
historical data revealed that at least two introductions occurred in the old continent: first, Colombus brought Caribbean material to southern Spain in 1493, and then Northern Flint material was introduced by either Spanish or French explorers from the eastern coast of North America during the first half of the sixteenth century. This second material was already cultivated on a sig-nificant scale in northern Europe by 1539 (Rebourg
et al.2003; Dubreuilet al.2006). On the basis of
mo-lecular marker records, these studies also showed that landraces cultivated at intermediate latitudes in Europe resulted from the hybridization of these two parental types. Northern Flint material therefore has played a unique role in the adaptation of maize to temperate climates (i) in North America, southern Chile, and north-ern Europe as well as (ii) in independent hybridization
1Corresponding author:UMR de Ge´ne´tique Ve´ge´tale, INRA UPS INA-PG
CNRS, Ferme du Moulon, 91190 Gif-sur-Yvette, France. E-mail: [email protected]
processes in the Corn Belt and in Europe. These tra-ditional Corn Belt Dent and European Flint landraces then played a key role in the development of hybrid breeding for the United States (Duvick et al. 2004;
W. Tracy, personal communication) and Europe.
Regarding the genetic basis of this adaptation, nu-merous quantitative trait loci (QTL) have been detected for flowering time in maize and a recent meta-analysis suggests a total of.60 QTL, some of which have large effects in several genetic backgrounds (Chardonet al.
2004). Association studies now offer a promising avenue to go beyond QTL mapping by identifying genes that contribute to trait variation. This approach was first applied to plants by Thornsberryet al. (2001) who
re-ported that polymorphism inDwarf8, a gene involved in the maize gibberellin pathway (Peng et al. 1999), was
associated with flowering time variation in a 102 maize inbred line panel representing North American tem-perate and subtropical modern origins. A key factor for a relevant application of association genetics is to have a good understanding of population structure, to avoid false associations due to linkage disequilibrium between physically distant loci. Association studies were originally carried out to investigate disease susceptibility traits in humans (Pritchardet al.2000b), where differentiation
of susceptibility allele frequency among genetic groups can be considered as mainly random. On the contrary, spatial adaptation in plants leads to a relationship be-tween genetic groups and adaptative traits, as described in Oryza glaberrima (Semon et al. 2005). Nonrandom
differentiation among genetic groups for causal poly-morphisms is expected in this context. Diversifying selection can ultimately lead to the fixation of different alleles in phenotypically contrasted populations. In such an extreme situation, association studies, which integrate population structure as covariate(s), have no power to reveal statistical associations between phe-notypic and genetic variations. Thus, efficient identifi-cation of genes involved in adaptation requires the consideration of both association between phenotypes and polymorphisms and differentiation among groups.
The aim of our study was first to investigate popula-tion structure in maize with special attenpopula-tion to its relationship to flowering time and second to evaluate the contribution ofDwarf8to maize adaptation to tem-perate climate. To do so, we defined a collection of 375 inbred lines covering a wide range of flowering time from late photoperiod sensitive to extremely early types with a special emphasis on typical Northern Flint and its derivatives. This collection was characterized for flower-ing time under both long- and short-day conditions, genotyped for genomewide simple sequence repeat (SSR) markers and an indel polymorphism inDwarf8, previously reported to be potentially involved in flower-ing time variation (Thornsberryet al.2001). The indel
polymorphism inDwarf8was also characterized in a col-lection of 275 traditional landraces from both American
and European origins, previously analyzed for SSR markers
(Dubreuil et al. 2006) and for which flowering time
data were available (Rebourg 2000; Gouesnardet al.
2002). For these different genetic materials, we inves-tigated (i) population structure based on SSR markers using the Structure software (Pritchard et al.2000a);
(ii) the relationship between population structure and flowering time variation, to assess the specificities of the different genetic groups with respect to this trait; (iii)Dwarf8differentiation among groups; and (iv) the association between flowering time variation, population structure, andDwarf8polymorphism by combining asso-ciation tests with the study of among-group differentiation.
MATERIALS AND METHODS
Plant material:A 375 inbred line collection was defined with the objective of representing European and American di-versity and covering a wide range of flowering times. The collection includes 153 inbreds obtained directly by selfing from traditional landraces (open-pollinated varieties). These 153 lines, referred to as the first-cycle inbred panel, were used to assess genetic structure of the ancestral inbred gene pool used for modern selection. We added to this panel 220 inbreds either of most advanced selection cycles or from synthetic populations like CYMMIT or Stiff Stalk populations. These 220 inbreds, representative of more recent material, should pres-ent new phenotypic characteristics such as those associated with high performance. The 375 inbred panel, referred to as the whole inbred panel, includes the 102 inbred line panel studied by Remingtonet al.(2001) and Thornsberryet al.
(2001) and additional dent lines studied by Liuet al. (2003). A
detailed list of genotypes and origins is available as supplemen-tal information at http://www.genetics.org/supplemensupplemen-tal/ or from the corresponding author, with information regarding reference stock centers for seed request.
To compare inbred lines with traditional maize accessions, we conducted new statistical analyses for SSR data from the landrace panel defined and genotyped by Dubreuil et al.
(2006). It includes 131 European landrace accessions from eight geographical areas of primary introduction or tradi-tional cultivation (Spain, Portugal, Italy, France, Germany, former Yugoslavia, Switzerland, Austria, Poland, Romania, Ukraine, Bulgaria, Czech Republic, and Slovakia) and 144 accessions among American racial groups including various types from the southwestern and northeastern United States, highland Mexico, core Andes, southern Chile and Argentina, lowland Mexico, Guatemala, the Caribbean, and Central America.
Field data:For inbred lines, flowering time under long-day conditions (15 hr) was evaluated in 2002 at two locations, St. Martin de Hinx (southwestern France) and Gif-sur-Yvette (Paris region, France). Two replicates were planted at each location for each line, each replicate consisting of 15 plant rows planted at a density of approximately six plants per square meter. Days to pollen expressed in thermal time following Ritchie and Nesmith (1991) (with parameter
of each genotype for further analyses. Heritability was calcu-lated as described in Gallais(1990).
Flowering time under short-day conditions (13 hr 10 min) for inbred lines was evaluated in Petit Bourg (Guadeloupe) in 2003 and 2004 with a two-repetition trial and the same sowing conditions as in Gif-sur-Yvette and Saint Martin de Hinx. As for long-day conditions, days to pollen expressed in thermal time was selected as a measure of flowering time. The 2004 trial was lost because of extreme climatic conditions and insect pressure.
We used data from Rebourg (2000) and Rebourg et al.
(2001) for flowering time of temperate landraces under long-day conditions and those from Gouesnardet al. (2002) for
flowering time of tropical landraces under both short- (13 hr 10 min) and long-day (15 hr) conditions. Both temperate and tropical landraces used in these studies were evaluated in Montpellier and Gif-sur-Yvette in 1997.
Photoperiod sensitivity was taken from Gouesnardet al.
(2002) for tropical landraces and evaluated for inbred lines using flowering time data from Gif-sur-Yvette (15 hr 33 min) and Petit Bourg (13 hr 10 min), with the same method as that
of Gouesnardet al. (2002).
Genotyping: Fifty-five SSR were used to analyze genetic diversity and population structure of both inbred panels. Primer pairs were chosen on the basis of their ability to detect a single locus, their broad genome coverage, and their good reproducibility in allele size determination. We avoided di-nucleotide SSR because of their possible high mutation rate
(Vigourouxet al.2002), which may cause departure from the
infinite-allele model (Excoffierand Hamilton2003). Table 1
summarizes the main characteristics of these loci in terms of position and motif. Primer sequences are available from the maize database project, at the University of Missouri (http:// www.maizegdb.org/). Eighteen of these SSR loci are in com-mon with the 24 used by Dubreuilet al. (2006) to characterize
maize landraces using a bulk method.
Leaf tissue samples for the whole inbred panel were obtained from 10 plants per inbred line. DNA was extracted following Taiand Tanksley(1991) with minor modifications.
PCR reactions were performed in 20-ml volumes containing 15–30 ng DNA template, 13PCR buffer, 0.2 mmdNTPs, 3 mm
MgCl2, 1 unit of Taq polymerase, 0.1mmol of each forward (with M13 tail) and reverse primer, and 0.03mmol of IRD-labeled M13 primer. Thermocycling consisted of initial de-naturation of DNA template at 95°for 5 min followed by 30 cycles of 95°for 20 sec, 56°for 20 sec, and 72°for 30 sec, and a final extension of 72°for 3 min. SSR were multiplexed by two according to their expected size, with loading buffer (IR2 loading solution, Li-Cor), heated at 95°for 5 min, and then placed on ice. Denatured samples (0.5ml) were loaded on 6.5% KB1(Li-Cor) gels in 13TBE buffer (89 mmTris, 89 mm
Borate, 2 mmEDTA, pH 8.2) and electrophoresed at 2000 V
for 3 hr on an automated DNA sequencer (model IR2, Li-Cor). Gels were run in a 96-well format. Size standards (50–350 bp, Li-Cor) were regularly spaced in gels (every 19 lanes). Fragment sizes were determined on the basis of their migra-tion relative to that of size standards using One-Dscan v. 2.05 software (Scanalytics). Alleles displaying very close sizes were pooled. SSR data for inbred lines are available as supplemental information at http://www.genetics.org/supplemental/ or from the corresponding author.
For the Dwarf8 gene (located on chromosome 1, in bin 1.09, see Gardiner et al.1993 for bin definition), we
geno-typed, for both inbred panels and the landrace panel analyzed
by Dubreuil et al. (2006), the polymorphism that showed
the stronger association with flowering time according to
Thornsberry et al. (2001). This polymorphism is a 6-bp
insertion/deletion at position 3472 and is referred to as
D8idp. The deletion allele is further noted asD8-deletion. This polymorphism was characterized through the size difference of PCR products. PCR reactions were performed in 20-ml volumes containing 37 ng of template DNA, 13PCR buffer, 0.1 mmof
each dNTP, 13QIAGEN (Valencia, CA) buffer, 0.6 unit of Taq polymerase, 0.04 mmol of forward primer (59-CGTTCCTCG ACCGCTTCACC-39with M13 tail), 0.4mmol of reverse primer (59-GGTACACCTCCGACATGACCT-39), and 0.36 mmol of IRD-labeled M13 primer. A touchdown PCR amplification was carried out as follows: 4 min at 95°; 10 cycles of 20 sec at 95°, 20 sec annealing decreasing 1°per cycle from 64°to 55°, and 30 sec elongation at 72°; followed by 21 cycles of 20 sec at 95°, 20 sec at 54°, and 30 sec at 72°; and a final extension of 5 min at 72°. Fragment migration and gel reading were done with the same protocol as that for SSR. Inbred lines were individually genotyped forD8idp. For landraces, the frequency of the deletion allele was estimated using bulked DNA samples from Dubreuilet al. (2006) for SSR. Reliability ofD8idpbulk
analysis on landraces was assessed by comparing expected and estimated allele frequencies obtained from 10 controlled DNA pools made from 100 mg lyophilized leaf from the FV75 inbred (homozygote for the deletion allele) and the LAN496 inbred (homozygote for the insertion allele) in various proportions. R2 between expected and estimated allele frequencies was 98.4%.
Diversity and genetic structure analysis:We calculated Nei’s unbiased genetic diversity Ht(Nei1978) at SSR loci for the
panels of inbred lines. Htestimates heterozygosity expected under the hypothesis of panmixy. To have a measure of allelic richness independent of sample size, we used FSTAT software
(Goudet2001) to calculate the estimator proposed by Petit
et al. (1998). These values were compared to those obtained by
Dubreuilet al. (2006) on landraces. However, allelic richness
values were similar to the average number of alleles and were thus not shown. Genetic structure was assessed using the Structure software package (Pritchardet al.2000a; Falush
et al.2003) on SSR genotypic data for landrace, whole-inbred, and first-cycle inbred panels. Structure results of individual attribution to genetic groups (percentage of genome of each individual attributed to each group) were graphically dis-played using the Distruct software (Rosenberg2002).
Results on the whole inbred and first-cycle inbred panels were obtained as described in our companion technical note (L. Camus-Kulandaivelu, J.-B. Veyrieras, B. Gouesnard,
A. Charcosset and D. Manicacci, unpublished results,
companion technical note available on request from the corresponding author). For both panels, we performed 10 independent runs of Structure for numbers of groups varying from 2 to 10, leading to 90 Structure outputs. For land-races, allele frequencies obtained from the analysis of pools
(Dubreuilet al.2006) were used to simulate sets of five
haplo-types per landrace, under the hypothesis of equilibrium. This made it possible to use the haploid option in Structure as for inbred panels and thus to keep the data a manageable size. We calculated the group attribution of each landrace as the mean of its five simulated haplotype group attributions. Because the options of the iteration procedure used for inbreds would be too computer-time consuming for landraces, we set a 105 itera-tion burn-in period and 105iteration sampling period and performed only 3 independent runs for each group number, leading to 27 Structure outputs.
For the three panels, we selected the best output for each group number on the basis of goodness-of-fit criteria. We estimated group mean contribution (GMC) using Structure to quantify each group’s relative importance. We also estimated the divergence of each group relative to a putative ancestral pool using Fst-statistics analogous to Wright’s Fst (Wright
panel on the basis of goodness-of-fit criteria (see our compan-ion technical note available on request from the correspond-ing author) and, to a limited extent, on the basis of consistency of group composition based ona prioriknowledge of genetic origins. For these three outputs (landrace, first-cycle inbred, and whole inbred panels), further referred to as reference outputs, we calculated Nei’s relative genetic differentiation among groups (Gst) as well as Nei’s diversity index of each group, using allelic frequencies estimated for the different groups.
Relationships between the first-cycle inbred panel and the landrace panel were also investigated by running Structure on these two data sets pooled together, using the 18 common SSRs. Relationships between genetic groups of the whole inbred panel and the first-cycle inbred panel were identified by calculating Euclidian distances between groups defined for the reference output of each panel, using group predicted allelic frequencies provided by Structure.
Relationship between flowering time, D8idp, and genetic structure:The relationship between population structure and flowering time was investigated using the linear regression model,
Tj¼a01
Xk1
i¼1 aigij1ej
(GLM procedure in SAS 1989), whereTjstands for the trait
value of genotypej,aofor the intercept,gijfor the proportion
of the genotypejgenome attributed to groupi(kgroups in total),aifor the effect of groupi, andejfor the residual. The
effect of population structure on the trait was quantified with the determination coefficient (R2). Average value of groupi was estimated asa01aifori6¼kand asa0for groupk.
The effect of population structure on flowering time under long-day conditions was evaluated on the whole inbred panel using the 90 Structure outputs, while only the reference output was considered for the first-cycle inbred panel and landrace panel. Effect of genetic structure on flowering time under short-day conditions and on photoperiod sensitivity was also evaluated for the three panels with Structure reference outputs.
The effect of population structure onD8idprepartition was investigated using the logistic regression model (LOGISTIC procedure in SAS 1989):
LogitðSNPjÞ ¼a01
Xk1
i¼1
aigij1ej:
SNPjstands for theD8-deletionallele frequency in genotype
j,i.e., 0 or 1 for inbred lines. Max-rescaled pseudo-R2of logistic regression was used to quantify the association between pop-ulation structure andD8idp. Estimates ofD8-deletionfrequency in Structure groups were calculated as
fiðD8-deletionÞ ¼
1
11ea0ai fori6¼k and
fkðD8-deletionÞ ¼
1 11ea0:
This was calculated for each of the 90 outputs obtained for the whole inbred panel and for reference output only for the first-cycle inbred panel. SinceD8-deletionfrequency varies in a continuous way in landrace pooled samples, population structure effect onD8idpandD8-deletionfrequency in landrace groups were calculated using linear regression as for pheno-typic traits.
Association betweenD8idpand flowering time was investi-gated using both linear (GLM procedure) and logistic (LOGISTIC procedure) regressions (SAS 1989), and test significance was evaluated using Student’s and chi-square tests for linear and logistic regressions, respectively. In both cases, the proportions of individual genome attributed to each group were included in the statistical model as covariates, accounting fork1 d.f.D8idpeffect on flowering time was estimated from the corresponding linear regression coeffi-cients. We tested association between D8idp and flowering time under long-day conditions on the 90 outputs obtained for the whole inbred panel (see our companion technical note, available on request from the corresponding author), to ex-amine test stability. This association was also tested on landrace and first-cycle inbred panels for reference outputs only.
Association betweenD8idpand the two other traits (flow-ering time under short-day conditions and photoperiod sensitivity) was tested for the whole inbred panel and on the tropical landrace subpanel using reference outputs.
RESULTS
Flowering time variation: Flowering time variation among inbred lines was measured under long (15 hr 30 min) and short (13 hr 10 min) day conditions, allowing us to assess genotype and location effects and their inter-action. For the inbred line experiment, genotype effect on flowering time under long day conditions was highly significant (mean square ¼ 70,430; P , 0.0001). We observed very contrasted flowering times in the whole inbred panel, from 808 degree days (dd) (FV268) to 1647 dd (H16), with a mean value of 1043 dd and a standard deviation of 155 dd. We found no significant effect of repetition, a high repeatability (Pearson’s correlation coefficient of 0.95 between observations for the geno-types in the two replicates within a location), and a high heritability (0.97). Genotype-by-location interaction (mean square ¼1415,P, 0.0001) was significant but low compared to genotype effect. It was thus not con-sidered in further analyses.
Under short-day conditions, flowering time varied significantly among lines (mean square¼20,787;P,
0.0001), from 782 dd (AP1) to 1329 dd (Ky228), with mean of 1020 dd and standard deviation of 97 dd. We observed a lower repeatability (Pearson’s correlation coef-ficient of 0.79) than that for trials in long-day conditions. This and the fact that a single trial could be considered lead to a lower heritability (0.85). Results for flowering time under short-day conditions and photoperiod sensitivity should therefore be considered with caution. Photoperiod sensitivity evaluation showed contrasted behaviors of the tested inbred lines: photoperiod-sensitive lines with more temperature requirements under long days than under short days (up to 131.90 ddhr1 for inbred EM1197), photoperiod-insensitive
materials (e.g., 0.80 ddhr1for inbred FC201), and
also lines with less temperature requirements under long days than under short days (up to74.40 ddhr1
development due to a lack of adaptation to environ-mental conditions (e.g., air dryness) rather than to the effect of day length. The mean value of photoperiod sensitivity was 0.64 ddhr1and the standard deviation
was 42.00 ddhr1.
Flowering times under long- and short-day conditions were significantly correlated to each other (R2¼0.45;
P ,0.0001). Photoperiod sensitivity was correlated to flowering time under long-day conditions (R2¼0.45;
P ,0.001) but not to flowering time under short-day conditions (R2¼0.01;P¼0.058).
Diversity at SSR loci and structure analysis:For the 55 SSR loci used to characterize inbred lines, we scored a total of 358 alleles for the whole inbred panel, of which 330 were present in the first-cycle inbred panel. The average number of detected alleles per locus was 6.5 for the whole inbred panel and 6.0 for the first-cycle inbred panel. Average diversity (Ht) was 0.61 for both the whole inbred panel and the first-cycle inbred panel. For the sake of comparison, note that the landrace panel genotyped for 24 SSR showed on average 7.7 alleles per locus and an average diversity of 0.63 (Dubreuil
et al.2006). Considering only the 18 SSR common to the landrace and inbred panels, average diversities per locus were 0.62, 0.64, and 0.62 for the whole inbred panel, the first-cycle inbred panel, and the landrace panel, respec-tively. Detailed diversity statistics are presented, for each locus, in Table 1.
SSR polymorphisms were used to assess the genetic structure of the three panels using the Structure soft-ware. A detailed analysis of the stability of the results obtained for different runs of Structure for the same group number was conducted for the inbred panels (see our companion technical note, available from the cor-responding author on request). For the three panels, Table 2 describes the best output for each group number based on goodness-of-fit criteria (see our companion technical note). The designation of a given group (j) was based on the origins of the materials with a high genome proportion attributed to this group (gij.0.80).
Two-group models discriminated between a ‘‘Flint’’ group (early materials from both European and American origins) and a ‘‘non-Flint’’ group, for each of the three panels. The three-group models subdivided the Flint group into a ‘‘Northern Flint’’ group and a ‘‘European Flint’’ group for both landrace and first-cycle inbred panels, whereas it subdivided the non-Flint group into ‘‘tropical’’ and ‘‘Corn Belt Dent’’ groups for the total panel. Similarly, a further increase in group number led mostly to group subdivisions. Interestingly, Northern Flint materials from European or American origins were never split in any panel and group number, con-firming their very high similarity. Similarly, some south-ern Spanish materials always remained clustered with tropical material.
Among the best outputs for each number of groups, we determined the best model for each panel using the
goodness-of-fit criterion. As discussed in our compan-ion technical note (available on request from the corre-sponding author), this led unambiguously to five groups for first-cycle inbreds, the origin of which appeared highly consistent with former knowledge (see discussion).
A similar pattern was observed for landraces. However, in the latter panel, while highest goodness-of-fit was observed for eight groups, seven- and eight-group models differed only by an additional group of four obviously unrelated landraces. We therefore considered the seven-group output more relevant. Model choice was less straightforward for the whole inbred panel due to the lack of a clear stabilization of the statistics with the increase in group number (see our companion techni-cal note). The two possible best outputs (five and seven groups) showed a high consistency with knowledge on material pedigrees. The output with the smallest group number (five groups) was chosen as advised in the Structure documentation. Beyond the optimal group number, Structure tended to generate small groups of heteroclite material in landrace and first-cycle inbred panels (Table 2). On the contrary, for the whole inbred panel, additional groups corresponded to line families [groups of related inbreds with a high contribution of one or few major progenitor(s)]. This was observed in the seven-group output, for instance, for lines related to the two major progenitors F2 and F7 issued from the Lacaune population.
For the reference outputs, Fst showed contrasted
values between groups, indicating variable differentia-tion levels from the ancestral pool (Table 2). Tropical groups for both inbred panels as well as ‘‘Mexican’’ and ‘‘Caribbean’’ groups for the landrace panel showed very lowFst-values, indicating that allelic frequencies of these
tropical groups are very close to those of the maize ancestral genetic pool that have generated the materials analyzed here. On the contrary, groups shaped by recent breeding such as that of inbreds related to Stiff Stalk materials showed high Fst-values, indicating strong
differentiation. The Northern Flint group also dis-played high Fst-values in the three panels, consistent
with its established high divergence from other materi-als (Doebleyet al.1986).
TABLE 1
Diversity of SSR markers in three maize panels: (i) 275 landraces, (ii) 153 first-cycle inbred lines issued from landraces, and (iii) 375 inbred lines
Name Motif Chr.bin
Landrace panel First-cycle inbred panel Whole inbred panel
Allele no. Ht Gst Allele no. Ht Gst Allele no. Ht Gst
phi427913 Trinucleotide 1.01 6 0.620 0.194 7 0.609 0.282
phi056 Trinucleotide 1.01 7 0.657 0.120
phi109275 Tetranucleotide 1.03 7 0.790 0.131 8 0.794 0.129
phi002 Tetranucleotide 1.08 2 0.467 0.026 2 0.446 0.046
phi335539 Trinucleotide 1.08 3 0.244 0.035 3 0.180 0.055
phi308707 Trinucleotide 1.09 11 0.755 0.074 6 0.723 0.069 6 0.686 0.077
phi064 Tetranucleotide 1.11 12 0.878 0.049 15 0.886 0.073
phi227562 Trinucleotide 1.11 9 0.738 0.120 7 0.762 0.034 7 0.770 0.069
phi402893 Trinucleotide 2.00 10 0.587 0.029 11 0.613 0.060
phi96100 Tetranucleotide 2.00 12 0.765 0.104
phi083 Tetranucleotide 2.04 12 0.853 0.116 7 0.782 0.045 7 0.774 0.109
phi251315 Trinucleotide 2.07 5 0.481 0.171 5 0.405 0.186
phi127 Tetranucleotide 2.08 12 0.726 0.130 4 0.645 0.087 5 0.673 0.141
phi427434 Trinucleotide 2.08 6 0.696 0.160 6 0.696 0.152
phi101049 Tetranucleotide 2.08 13 0.813 0.041 13 0.830 0.080
phi453121 Trinucleotide 3.00 8 0.734 0.041 9 0.742 0.074
phi104127 Tetranucleotide 3.01 3 0.583 0.061 4 0.603 0.092
phi029 Hexanucleotide 3.04 9 0.651 0.056 8 0.703 0.082 9 0.703 0.102
phi102228 Tetranucleotide 3.04 3 0.617 0.178 3 0.599 0.093 3 0.569 0.076
phi053 Tetranucleotide 3.05 10 0.742 0.049 10 0.711 0.108
phi046 Tetranucleotide 3.08 2 0.470 0.103 2 0.478 0.073 2 0.500 0.130
umc1136 Trinucleotide 3.10 10 0.773 0.078 11 0.777 0.061
phi072 Tetranucleotide 4.00–4.01 8 0.722 0.133 7 0.768 0.016 10 0.774 0.058
phi213984 Trinucleotide 4.01 3 0.152 0.055 3 0.268 0.101
phi308090 Trinucleotide 4.04–4.05 3 0.494 0.057 3 0.516 0.080
dupssr34 Trinucleotide 4.07 16 0.806 0.030 19 0.858 0.080
phi093 Tetranucleotide 4.08 8 0.616 0.088
phi076 Hexanucleotide 4.11 5 0.653 0.030 5 0.664 0.024
nc130 Trinucleotide 5.00 3 0.506 0.120
umc1496 Trinucleotide 5.00 10 0.754 0.028 10 0.770 0.097
phi024 Trinucleotide 5.01 5 0.701 0.080 5 0.694 0.101
phi331888 Trinucleotide 5.02 6 0.437 0.054 5 0.684 0.052 5 0.643 0.068
phi109188 Tetranucleotide 5.03 10 0.625 0.030 11 0.627 0.067
phi330507 Trinucleotide 5.04 3 0.365 0.024 3 0.449 0.080
phi085 Pentanucleotide 5.07 13 0.774 0.182
umc1133 Tetranucleotide 6.01 6 0.722 0.043 6 0.712 0.086
phi389203 Trinucleotide 6.03 4 0.488 0.021 4 0.454 0.063
phi031 Tetranucleotide 6.04 8 0.742 0.115 5 0.738 0.101 5 0.690 0.123
phi078 Tetranucleotide 6.05 8 0.659 0.065 11 0.643 0.109
phi089 Tetranucleotide 6.08 4 0.614 0.095 5 0.652 0.114
phi112 Dinucleotide 7.01 10 0.695 0.210 9 0.711 0.114 11 0.669 0.114
phi034 Trinucleotide 7.02 6 0.691 0.061 8 0.692 0.065
phi069 Trinucleotide 7.05 8 0.639 0.081 4 0.670 0.146 5 0.687 0.159
phi051 Trinucleotide 7.06 6 0.721 0.028 6 0.695 0.083
phi116 Heptanucleotide 7.06 6 0.731 0.116 7 0.743 0.140
phi115 Hexanucleotide 8.03 5 0.548 0.181 2 0.479 0.136 3 0.498 0.096
phi121 Trinucleotide 8.04 3 0.146 0.032 3 0.215 0.266
phi014 Trinucleotide 8.04 8 0.546 0.090 6 0.527 0.066 6 0.474 0.068
phi015 Tetranucleotide 8.08 8 0.562 0.055 8 0.619 0.080
phi233376 Trinucleotide 8.09 8 0.793 0.031 8 0.776 0.058
phi033 Trinucleotide 9.01 7 0.405 0.025 7 0.446 0.044
phi065 Pentanucleotide 9.03 4 0.650 0.092 4 0.648 0.130
phi032 Tetranucleotide 9.04 4 0.670 0.026 4 0.677 0.029
phi448880 Trinucleotide 9.04 4 0.345 0.050 4 0.424 0.060
phi108411 Tetranucleotide 9.05 3 0.465 0.113 5 0.602 0.046 5 0.557 0.071
phi041 Tetranucleotide 10.00 12 0.663 0.144
Flint landraces. On the other hand, inbred lines related to Italian landraces were attributed to the European Flint group in the inbred analysis. In the joint analysis of landraces and inbreds, some of them were attributed to an Italian Flint group whereas others were considered as the result of admixture between Italian Flint and Pyrenees–Galicia Flint groups. Spanish inbred lines attributed to the Tropical group in the inbred line analysis were attributed mainly to the Caribbean group, while South American inbreds like ARGL256 and ZN6 showed an admixture between Andean and Italian Flint groups. A single inbred (P9COS6) had .50% of its genome originating from the Mexican group. These relationships permit inferences of filiations from land-race to first-cycle inbred groups (Figure 1, arrows). Afterward, relationships between population structure of the first-cycle inbred panel and the whole inbred panel were determined from the genetic distances be-tween the corresponding groups (Table 3). Adding lines from advanced breeding generations to the first-cycle inbred lines led to the identification of a new dent subgroup (‘‘Stiff Stalk’’) in addition to the four main groups determined for the first-cycle inbred panel (Northern Flint, European Flint, Corn Belt Dent, and Tropical), the allelic frequencies of which remained stable. However, it can be noted that the small ‘‘Pop-corn’’ inbred group identified from the first-cycle in-bred panel clustered with the Corn Belt Dent group in the whole inbred panel.
Relationship between population structure, flower-ing time, and D8idp: In the whole inbred panel, population structure showed a highly significant (P,
0.0001) and very strong association with flowering time under long-day conditions from 3- to 10-group outputs (Table 4). It explained on average (over runs for the same group number) from 42.9% (3 groups) to 54.7% (10 groups) of flowering time variation. For 3–10 groups, different runs of Structure with the same group number led to stable results (standard errors from 0 to 3%). For 2 groups, genetic structure showed a
contrast-ing effect on flowercontrast-ing time variation dependcontrast-ing on group composition. Two-group outputs can be classified into two categories (see our companion technical note available on request from the corresponding author) that correspond to two very different genetic structures. For some outputs, the two groups correspond to Flint and non-Flint materials. Population structure explained in this case 24% of flowering time variation. Conversely, for the other outputs, Flint and tropical materials clus-tered into a single group. The genetic structure de-scribed by these outputs failed to explain flowering time variation (R2¼0.2%).
For the first-cycle inbred and landrace panels, struc-ture effect on flowering time under long-day conditions was calculated only for reference outputs. The five-group model for the first-cycle inbred panel and the seven group model for the landrace panel explained, respectively, 39.4 and 66.8% of flowering time variation under long-day conditions. The estimation of average group flowering time (Table 5) showed the same trend in the three panels. Northern Flint, Pyrenees–Galicia Flint, and, to a lesser extent, Italian Flint groups in the landrace panel displayed the earliest flowering time. Tropical groups, including Mexican, Caribbean, and Andean landrace groups, displayed the latest flowering time, while Dent groups (Corn Belt Dent and Stiff Stalk in the whole inbred panel) exhibited an interme-diate flowering time. The largest differences between groups were 387 dd between Tropical and Northern Flint groups in the whole inbred panel and 706 dd between Caribbean and Pyrenees–Galicia Flint in the landrace panel.
Population structure effect on flowering time under short-day conditions and on photoperiod sensitivity was calculated for the whole inbred panel and for a tropical landrace subpanel using reference outputs. Structure effect on flowering time under short-day conditions was significant (P , 0.0001) for both inbred lines (R2¼
0.26) and tropical landraces (R2¼0.25). For the sake of
comparison, genetic structure effect on flowering time
TABLE 1
(Continued)
Name Motif Chr.bin
Landrace panel First-cycle inbred panel Whole inbred panel
Allele no. Ht Gst Allele no. Ht Gst Allele no. Ht Gst
umc1319 Trinucleotide 10.01 5 0.526 0.059 5 0.579 0.109
phi059 Trinucleotide 10.02 7 0.617 0.053 6 0.622 0.107 6 0.596 0.134
phi96342 Tetranucleotide 10.02 6 0.601 0.035 7 0.597 0.092
phi062 Trinucleotide 10.04 3 0.470 0.246 2 0.464 0.092 2 0.491 0.112
phi084 Trinucleotide 10.04 5 0.493 0.073 3 0.506 0.023 4 0.498 0.112
Average 7.7 0.632 0.120 6.0 0.614 0.066 6.5 0.617 0.098
D8idp 1.09 2 0.439 0.407 2 0.464 0.468 2 0.375 0.388
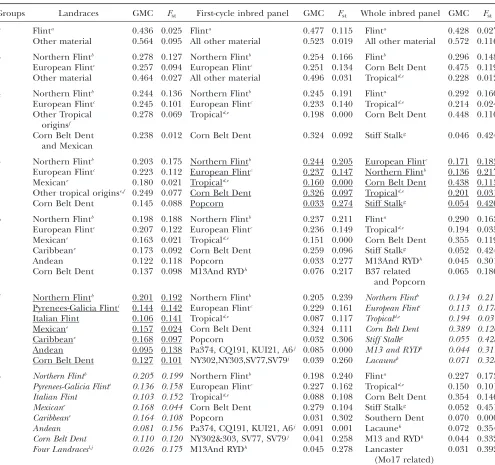
TABLE 2
Group composition in Structure outputs with best goodness-of-fit, depending on the number of groups (Groups) for the three panels (landraces and first-cycle inbred panel and whole inbred panel)
Groups Landraces GMC Fst First-cycle inbred panel GMC Fst Whole inbred panel GMC Fst
2 Flinta 0.436 0.025 Flinta 0.477 0.115 Flinta 0.428 0.027
Other material 0.564 0.095 All other material 0.523 0.019 All other material 0.572 0.116
3 Northern Flintb 0.278 0.127 Northern Flintb 0.254 0.166 Flintb 0.296 0.148
European Flintc 0.257 0.094 European Flintc 0.251 0.134 Corn Belt Dent 0.475 0.119
Other material 0.464 0.027 All other material 0.496 0.031 Tropicald,e 0.228 0.012
4 Northern Flintb 0.244 0.136 Northern Flintb 0.245 0.191 Flinta 0.292 0.160
European Flintc 0.245 0.101 European Flintc 0.233 0.140 Tropicald,e 0.214 0.024
Other Tropical originsf
0.278 0.069 Tropicald,e 0.198 0.000 Corn Belt Dent 0.448 0.110
Corn Belt Dent and Mexican
0.238 0.012 Corn Belt Dent 0.324 0.092 Stiff Stalkg 0.046 0.424
5 Northern Flintb 0.203 0.175 Northern Flintb 0.244 0.205 European Flintc 0.171 0.183
European Flintc 0.223 0.112 European Flintc 0.237 0.147 Northern Flintb 0.136 0.217
Mexicane 0.180 0.021 Tropicald,e 0.160 0.000 Corn Belt Dent 0.438 0.113
Other tropical originse,f 0.249 0.077 Corn Belt Dent 0.326 0.097 Tropicald,e 0.201 0.031
Corn Belt Dent 0.145 0.088 Popcorn 0.033 0.274 Stiff Stalkg 0.054 0.426
6 Northern Flintb 0.198 0.188 Northern Flintb 0.237 0.211 Flinta 0.290 0.163
European Flintc 0.207 0.122 European Flintc 0.236 0.149 Tropicald,e 0.194 0.035
Mexicane 0.163 0.021 Tropicald,e 0.151 0.000 Corn Belt Dent 0.355 0.119
Caribbeane 0.173 0.092 Corn Belt Dent 0.259 0.096 Stiff Stalkg 0.052 0.424
Andean 0.122 0.118 Popcorn 0.033 0.277 M13And RYDh 0.045 0.301
Corn Belt Dent 0.137 0.098 M13And RYDh 0.076 0.217 B37 related
and Popcorn
0.065 0.186
7 Northern Flintb 0.201 0.192 Northern Flintb 0.205 0.239 Northern Flintb 0.134 0.217
Pyrenees-Galicia Flinti 0.144 0.142 European Flintc 0.229 0.161 European Flintc 0.113 0.178
Italian Flint 0.106 0.141 Tropicald,e 0.087 0.117 Tropicald,e 0.194 0.037
Mexicane 0.157 0.024 Corn Belt Dent 0.324 0.111 Corn Belt Dent 0.389 0.120
Caribbeane 0.168 0.097 Popcorn 0.032 0.306 Stiff Stalkg 0.055 0.428
Andean 0.095 0.138 Pa374, CQ191, KUI21, A6j 0.085 0.000 M13 and RYDh 0.044 0.311
Corn Belt Dent 0.127 0.101 NY302,NY303,SV77,SV79j 0.039 0.260 Lacaunek 0.071 0.328
8 Northern Flintb 0.205 0.199 Northern Flintb 0.198 0.240 Flinta 0.227 0.173
Pyrenees-Galicia Flinti 0.136 0.158 European Flintc 0.227 0.162 Tropicald,e 0.150 0.101
Italian Flint 0.103 0.152 Tropicald,e 0.088 0.108 Corn Belt Dent 0.354 0.146
Mexicane 0.168 0.044 Corn Belt Dent 0.279 0.104 Stiff Stalkg 0.052 0.451
Caribbeane 0.164 0.108 Popcorn 0.031 0.302 Southern Dent 0.070 0.000
Andean 0.081 0.156 Pa374, CQ191, KUI21, A6j 0.091 0.001 Lacaunek 0.072 0.354
Corn Belt Dent 0.110 0.120 NY302&303, SV77, SV79j 0.041 0.258 M13 and RYDh 0.044 0.332
Four Landracesl,j 0.026 0.175 M13And RYDh 0.045 0.278 Lancaster
(Mo17 related)
0.031 0.392
Each Structure group is designated from the origin of the material with a high genome proportion attributed to this group (gij.0.80).
When a group does not correspond to a unique genetic origin, its composition is detailed in footnotes. Group mean contribution (GMC) indicates the mean proportion of the genome originating from this group, over all individuals.Fst, analogous to Wright’sFstthat measures divergence from ancestral genetic pool. Italics, group number showing optimal goodness-of-fit; underlines, reference output.
a
Including Flint from both northern America, northern Europe, and southern Europe, except southern Spain.
b
Northern Flint from both northern America and northern Europe.
c
From southern France, Italy and northern Spain.
d
Including all tropical origins and southern Spanish.
e
Includes southern Spanish material.
fFrom Andean, Caribbean, southern America and some southern Spanish. gRelated toB14, CM105 and CM174.
hMinnesota 13 and Reid Yellow Dent, including Wf9, A3, SDP254 and, for whole inbred panel, W117. iFrench Pyrenees and northern Spain (Galicia).
jGroup including miscellaneous material.
kOriginating from Lacaune landraces like F2 and F7.
under long-day conditions for the tropical landrace subpanel was found significant (R2¼0.33;P,0.0001).
In the whole inbred panel, the Northern Flint group remained the earliest (926 dd) and the Tropical group the latest (1081 dd) flowering material under short-day conditions. However, the difference in flowering time between these two extreme groups was reduced (155 dd) in short-day conditions, when compared to long-day conditions (387 dd). Structure effect on photoperiod sensitivity was significant for both tropical landraces (R2¼ 0.41;P , 0.0001) and inbreds (R2¼ 0.08;P ¼
0.0001). In the inbred panel, the only photosensitive group (132 ddhr1) is the tropical one, while other
groups are photoperiod insensitive (17 to4 ddhr1).
Population structure showed a significant and very strong effect onD8idppolymorphism distribution in the whole inbred panel using 3- to 10-group Structure outputs (Table 4), with max-rescaled pseudo-R2
averag-ing 0.37 (3 groups) to 0.47 (9–10 groups). Different
runs of Structure for the same group number exhibited stable results (standard errors varying from 0.013 to 2.2%). As observed for flowering time under long-day conditions, two-group outputs showed contrasted max
-rescaled pseudo-R2values, depending on their group
composition. Outputs discriminating Flintvs.non-Flint showed very high max-rescaled pseudo-R2values (0.35)
while outputs gathering Flint and Tropical material exhibited lower max-rescaled pseudo-R2values (0.12).
The first-cycle inbred reference output showed a max-rescaled pseudo-R2of 0.51 and the landrace reference
output showed a max-rescaled pseudo-R2 of 0.55.
Estimated frequencies of D8-deletion in the landrace panel, in the first-cycle inbred panel, and in the whole inbred panel for reference outputs are presented in Table 5. Northern Flint and Tropical groups displayed contrasted frequencies for D8idp. In the whole inbred panel, the deletion was rare in the Tropical group (1.9%) while predominant in the Northern Flint group
Figure1.—Models for population structure at three steps of maize selection history: landraces (seven groups), first-cycle
in-breds (five groups), and whole inbred panel (five groups). Groups for each panel are represented by colors as indicated at the bottom. For the inbred panels, each inbred line is represented by a vertical line divided into colored segments, the length of which indicates the proportion of the genome attributed to the different groups. For the landrace panel, each population is represented by the mean proportions estimated for the five inbred lines simulated to represent it. Solid arrows stand for filiation relationship between clusters and have been established on the basis of either Structure assignments (in the joint study of landraces and first-cycle inbreds) or genetic distances between groups of inbred line panels (Table 3). Dashed arrows indicate lower contributions [less than three inbred lines with a high genome proportion (gij.0.80) attributed to a group obtained in the Structure joint
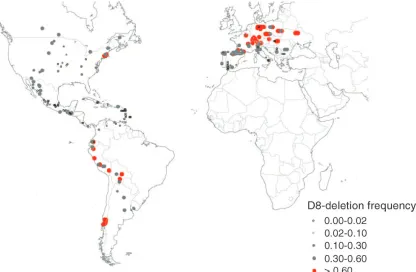
(82%). In the landrace panel, while the contrasted frequency ofD8-deletionbetween Northern Flint (83.0%) and tropical groups Caribbean (2.0%) and Mexican (4.0%) remained strong, we also observed a high fre-quency of theD8-deletionin the Andean group (58.0%) that gathers material originating from elevated places (on average 2200 m) of Andean tropical regions (Peru, Ecuador, and Bolivia). To illustrate these results, the de-letion frequency in landraces was represented according to the population geographical coordinates (Figure 2). The D8-deletion prevails in the landraces originating from northern Europe, northern North America, south-ern South America, and the Andean tropical region.
D8idp Gstwas 0.388 in the whole inbred panel and 0.407
in the landrace panel, which is higher than that ob-served for any SSR (Table 1).
Association betweenD8idpand flowering time under long-day conditions was highly significant for the whole inbred panel, when ignoring genetic structure, with both logistic and linear regressions (P ,0.0001). The
D8-deletionwas associated in this case to a 130-dd earlier flowering (relative to the D8-insertion). This association was also significant when considering two-group Struc-ture outputs as covariates (P , 0.01). However, two contrasting patterns were observed among two-group outputs. The D8-deletion allele was associated on aver-age with 148 dd earlier flowering when Flint material was clustered with Tropical material and only with 54 dd earlier flowering when Flint material was separated from Tropical material. Note that the deletion was associated with early flowering time. Using logistic re-gression with three or more groups yielded 79% sig-nificant association tests (63 of 80) while 4% of these tests (3 of 80) exhibitedP-values. 0.1. Linear regres-sion always showed largerP-values than logistic regres-sion. Linear regression yielded 19% significant tests (15 of 80) and 36% tests (29 of 80) withP-values.0.1. Mean
P-values obtained for each group number are presented in Table 4. For models with three or more groups, the
D8-deletion was associated with a 29- to 37-dd earlier flowering (Table 4).
Association betweenD8idpand flowering time under long-day conditions was also tested for the first-cycle inbred line and landrace panels using reference out-puts. No significant association was found on the first-cycle inbred panel, potentially due to the smaller size of this sample. However, when not taking structure into account, significant association was found in the first-cycle inbred panel (P¼0.01 for both linear and logistic regressions). Conversely,D8idpand flowering time un-der long-day conditions were very strongly associated
TABLE 4
Relationship between population structure and flowering time (FT) under long-day conditions (R2), association between
population structure andD8idp(pseudoR2), and association betweenD8idpand flowering time taking population
structure into account (P-value for both linear and logistic regressions), within the whole inbred panel
Linear regression Logistical regression
Structure effect on FT: D8–FT association test Structure effect onD8idp: D8–FT association test:
Groups R2 P Effecta Pseudo-R2 P
2 0.14 (0.12) 0.0072 (0.0061) 91.18 (48.64) 0.26 (0.12) 0.0023 (0.0019)
3 0.43 (0.00) 0.0448 (0.0004) 37.03 (0.08) 0.37 (0.00) 0.0113 (0.0001)
4 0.47 (0.03) 0.0903 (0.038) 31.25 (4.31) 0.40 (0.01) 0.0349 (0.0261)
5 0.48 (0.03) 0.1013 (0.0425) 30.17 (3.94) 0.42 (0.01) 0.037 (0.0281)
6 0.51 (0.02) 0.1078 (0.0211) 28.66 (2.15) 0.44 (0.00) 0.0395 (0.0151)
7 0.52 (0.01) 0.0933 (0.0261) 29.99 (2.54) 0.44 (0.01) 0.0329 (0.0157)
8 0.52 (0.00) 0.0926 (0.0212) 29.91 (1.99) 0.46 (0.02) 0.0394 (0.0156)
9 0.53 (0.01) 0.0924 (0.0344) 30.17 (3.36) 0.47 (0.02) 0.0491 (0.0265)
10 0.55 (0.01) 0.0636 (0.0361) 33.17 (4.26) 0.47 (0.02) 0.0326 (0.0345)
Statistics are calculated over 10 replicates for each group number. Mean (standard error) is shown.
a
D8-deletioneffect on flowering time in degree days. TABLE 3
Genetic distances between groups defined from the first-cycle panel and the whole inbred panel reference Structure
outputs (Figure 1)
Whole inbred panel
NF EF Dent Tropical SS
First-cycle inbred panel
NF 0.026 0.131 0.157 0.175 0.265
EF 0.149 0.058 0.143 0.121 0.262
Dent 0.161 0.144 0.044 0.094 0.211
Tropical 0.143 0.109 0.084 0.062 0.233 Popcorn 0.181 0.169 0.140 0.155 0.277
(P¼0.0007) in the landrace panel. In this case, the D8-deletion was associated with a 145-dd earlier flowering time. No association betweenD8idpand flowering time under long-day conditions was detected on the tropical landrace subpanel.
Still taking Structure reference outputs into account, no association betweenD8idpand flowering time under short-day conditions was detected either on the tropical
landrace panel or on the whole inbred panel. Associa-tion between D8idp and photoperiod sensitivity was close to significance (logistic regression:P¼0.052) in the whole inbred panel using reference Structure out-put. When considering all the outputs from 3–10 groups as covariates, 25% of the association tests showed a P -value ,0.05 with logistical regression and 28.9% with linear regression. No association was found between
Figure2.—Geographical distribution ofD8-deletionfrequency among landraces.
TABLE 5
Average flowering time under long-day conditions (FT) and averageD8-deletionfrequency for each group of the three panels (landrace, first-cycle inbred, and whole inbred)
Landrace panel First-cycle inbred panel Whole inbred panel
FT D8-deletion FT D8-deletion FT D8-deletion
NF 704.5 0.83 876.7 0.87 891.4 0.82
PGF 651.9 0.27
EF 940.3 0.47 911.0 0.56
Italian 794.8 0.22
Dent 917.6 0.22 1068.5 0.06 1036.7 0.09
Stiff Stalk 1059.5 0.38
Mexican 1112.3 0.04
Caribbean 1357.6 0.02
Andean 1306.9 0.58
Tropical 1129.6 0.13 1278.5 0.02
Popcorn 1168.8 0.00
photoperiod sensitivity andD8idpin the tropical land-race subpanel.
DISCUSSION
Effect of history and recent selection on population structure: The average amount of genetic diversity at SSR markers showed low variation among the three panels that were analyzed: (i) the total collection of 375 inbred lines (whole inbred panel), (ii) the subcollection of 153 first-generation inbred lines issued from land-races (first-cycle inbred panel), and (iii) a collection of 275 traditional landraces (landrace panel). Average allele number per locus varied from 6.0 to 7.7 and genetic diversity from 0.61 to 0.64. These numbers are comparable to the ones from previous studies in maize
(Senioret al.1996; Taraminoand Tingey1996; Luand
Bernardo 2001; Matsuoka et al. 2002a). However,
diversity in our study was lower than that reported by Liu et al. (2003) on a collection of 260 diverse maize
inbred lines: 21.7 alleles per locus on average and an average genetic diversity of 0.82. This discrepancy is probably due to the presence in Liuet al.’s (2003) article
of dinucleotide SSR that have high mutation rates
(Vigourouxet al.2002).
The most clear-cut trend observed in the population structure of all three panels that we analyzed is the splitting of Northern Flint (and related material such as European Flint or Pyrenees–Galicia Flint) from the rest of the collection. This is in accordance with previous work showing the striking divergence of Northern Flint from Corn Belt Dent and some tropical material on the basis of isozyme loci (Doebley et al. 1986). This
genetic feature of Northern Flint was not reported by
Thornsberryet al. (2001) and Liuet al. (2003)
prob-ably because they focused mostly on Corn Belt Dent and tropical diversity. A second important result is the orga-nization of tropical landraces into three groups that can be referred to as Mexican, Caribbean, and Andean. Mexican and Caribbean groups showed a low differen-tiation relative to the assumed ancestral gene pool (Table 2), which is consistent with their geographical proximity with the domestication center. The Andean group appeared clearly isolated and was more differen-tiated than other tropical material, as reported by
Matsuoka et al. (2002a). This is consistent with the
ancient introduction of maize in core Andes (Freitas
et al. 2003). Contrary to tropical landraces, tropical inbred lines did not display any genetic structure, for both inbred panels. This may be due to the heteroge-neous origins of these lines (southern Spain, southern America, Mexican Tuxpeno, and highlands) and to the fact that they were derived mostly from synthetic populations with a broad genetic basis (Reifet al.2003).
The finding of southern Spanish landraces clustering with tropical material (Caribbean and Mexican) as well as the clustering of northeastern European material
with U.S. Northern Flints is consistent with the hypoth-esis of a double introduction of maize in Europe proposed by Rebourg et al. (2003) and Dubreuil
et al. (2006). This remains true whatever the group number considered in Structure runs, confirming the close proximity between these European and American materials (Rebourget al.2003). The rest of European
material, spread mainly in central and northern Spain, France, and Italy, appeared as a distinct genetic cluster that does not have any counterpart in America. This material appeared as a single European Flint group for inbred lines and as two distinct Pyrenees–Galicia Flint and Italian Flint groups for landraces. This supports the hypothesis of Rebourg et al. (2003) that this material
results from the hybridization of populations derived from Tropical and Northern Flint introductions in Europe. Similarly, Corn Belt Dent is known to result from the hybridization between Northern Flint and Southern Dent (Doebley et al. 1988). Interestingly,
populations derived from these two independent hy-bridizations between Northern Flint material and late materials from tropical origins are identified by Struc-ture as individualized groups (European Flint, Pyrenees– Galicia Flint, and Corn Belt Dent, see Table 2). The signature of admixture between parental populations is thus not detected using the Structure software. This may be due to the accumulation of numerous recombination events and/or genetic drift, resulting in a strong differ-entiation of the derived populations.
Results obtained from the whole inbred panel, as compared to those observed for the first-cycle inbred and landrace panels, show that population structure has been further shaped by modern breeding achieved during the last half-century. Indeed, inbred lines related to the Iowa Stiff Stalk synthetic group cluster together in the whole inbred panel (Table 2, Stiff Stalk group), whereas initial Corn Belt Dent material appears as a single homogeneous group within the landrace panel. This is consistent with the current structuring of U.S. hybrid programs into Stiff Stalk and non-Stiff Stalk materials (Duvick et al. 2004). In addition, the
devel-opment of new breeding populations by crossing exist-ing inbred lines together (Gerdes and Tracy 1993)
also led to some highly related ‘‘families’’ of inbred lines that are detected as individual groups when running the Structure software for high group numbers. As a con-sequence, the Structure software shows no clear stabili-zation of the goodness-of-fit criteria as group number increases for the whole inbred panel (see our compan-ion technical note, available from the corresponding author on request), making it difficult to conclude for any group number and composition. This effect of re-latedness among inbred lines on the stability of Struc-ture outputs is similar to that described by Liu et al.
(2003).
in maize has been known for long time (Bonhomme
et al. 1994; Gouesnard et al. 2002) and is illustrated
by the range of variation found in this study (more than a twofold variation in degree days needed to reach flowering time in long-day conditions, from the earli-est to the latearli-est genotype). Strong correlations were ob-served in the whole inbred panel between population structure (five groups reference output) and (i) flower-ing time under long-day conditions (R2 ¼ 0.47), (ii)
flowering time under short-day conditions (R2¼0.26),
and (iii) photoperiod sensitivity (R2¼0.08), although to
a lesser extent. This effect of population structure was even larger for landrace flowering time under long-day conditions (R2¼0.67), which may be due to the effect
of recent selection that tended to eliminate very early types from European and Corn Belt genetic pools (A.
Charcosset, personal communication). These results
show that groups established on the basis of neutral markers (SSR) are strongly differentiated for their flowering time determination.
Geographical variation of a phenotypic trait such as flowering time may be the result of adaptation and/or genetic drift. The very high correlation of population structure and flowering time under long-day conditions (R2 ¼0.47) and the clear consistency between group
average flowering time and local climatic characteristics preclude that this differentiation is the effect of genetic drift only. For instance, in the whole inbred panel, the largest between-group difference in precocity is that observed between Northern Flint and Tropical materi-als, Northern Flints flowering 387 dd earlier. Northern Flint is a genetic pool created by Native Americans and cultivated in eastern North America up to cool regions of the Saint Laurent bay (Dubreuilet al.2006) at the
time of its discovery by Europeans. Following the discovery, the Northern Flint group was crossed with tropical or subtropical materials by North American colonists and Europeans, leading to new temperate material, Corn Belt Dent and European Flint/Pyrenees– Galicia Flint, respectively, that are adapted to interme-diate climates. In the landrace panel, the Pyrenees– Galicia Flint group that includes materials originating from the Pyrenees Mountains appears on average as early as the Northern Flint group, whereas Corn Belt Dent material is later than its Northern Flint parental pool. This is consistent with local climatic character-istics, the Corn Belt being warmer on average than the Pyrenees Mountains. These results call for a detailed investigation of the growing season length,i.e., the dura-tion of maize cultivadura-tion possible given the local environ-mental conditions, at the geographical origins of the landraces. This investigation should ideally consider possible variation in climate through history (see, for instance, Haug et al. 2003). The investigation of the
relationship between growing season length, flowering time, population structure, and the frequency of poly-morphism potentially involved in flowering time
varia-tion should bring more precise elements into the maize adaptation process.
Dwarf8 association with flowering time and its
possible role in maize adaptation to temperate climate:
In this study, we confirmed the association between
D8idpand flowering time in panels of inbred lines and landraces representing American, European, and trop-ical maize diversity. These are wider maize samples than the panel used by Thornsberry et al. (2001), who
mainly worked on Corn Belt Dent and tropical inbred material. More recently, this association was reinvesti-gated in a 71 elite European inbred line panel by
Andersenet al. (2005), who found a very strong
asso-ciation (P,0.0001) betweenD8idpand flowering time. This association, however, was no longer significant after correction for population structure. We confirmed in the present study a strong association betweenD8idp
and flowering time in the panels when not correcting for population structure. After correcting for popula-tion structure, this associapopula-tion remained highly signifi-cant for the landrace panel but was no longer signifisignifi-cant for the first-cycle inbred panel. For the whole inbred line panel, association was significant with logistic re-gression and close to significance with linear rere-gression. Considering that the direction of the effect was known
a priori (Thornsberryet al.2001), unilateral tests
in-deed would have led to average P-values from 0.03 to 0.05 for 4–10 groups. Altogether, these results illustrate that the power of association test while correcting for population structure is a burning issue.
Maize flowering time variation among panels from diverse origins certainly represents an extreme situation in this respect, because the genes involved in this trait have played a key role in defining population structure. When correcting for population structure, population structure estimates consume part of the effect of the candidate gene that is correlated to it. When consider-ing linear regression, the power of the test is directly related to the fraction of the variation explained by the candidate polymorphism after correction for popula-tion structure, i.e., the partial R2. Given that the
re-maining variation contains environmental variation, extreme situations may occur where there is no longer any genetic variation to be explained. In this study, flowering time measured for inbred lines under long-day conditions has a high heritability (97%) and popula-tion structure explains approximately half of genetic variation (38 and 49% for the first-cycle and whole inbred panels, respectively). In such a situation, taking into account population structure will increase the power of the test for genes in which the polymorphism is loosely linked to population structure and conversely decrease it in the case of a strong association with population structure. The association between D8idp
relevancy of association studies for other traits more loosely related to population structure.
Another consequence of the strong correlation be-tween population structure and D8idp is to make it difficult to estimateD8idpeffect on flowering time. We propose that the lower bound of theD8-deletioneffect on flowering time under long-day conditions is 29 dd (estimated when accounting for population structure for the whole inbred panel) and the upper bound is
130 dd (estimated when not accounting for popula-tion structure). It can be noted that theD8-deletioneffect on flowering time calculated on landraces is stronger (145 dd accounting for population structure) than that on inbred lines. This could be due to epistatic interactions betweenDwarf8and other loci that differ in allelic frequencies and/or genetic effects between the inbred and landrace panels.
In addition to investigating association, this study provides us with two other elements supporting that
Dwarf8is a QTL for flowering time. First,Dwarf8seems to have been submitted to diversifying selection. Di-versifying selection on DNA markers is usually detected by comparing differentiation levels (estimates of Fst)
obtained in large data sets (Beaumont and Nichols
1996; Vitaliset al.2001). The differentiation level in
the whole inbred panel forD8idp(Gst¼0.388) is higher
than that for all neutral SSR markers (maximal Gst
-value: 0.282 for markerphi427913). A strong differen-tiation ofD8idpis also found in the two other panels, thus making it very unlikely that the higherGst-value of
D8idpis the result of drift alone. The second element is the predominance of the early allele (D8-deletion) in the earlier material (82% in the whole inbred panel Northern Flint group) and the predominance of the late allele in the later material (98.1% in the whole inbred panel tropical group). This is in accordance with the results of Andersenet al.(2005), who found that the
early allele (T, corresponding to the D8-deletion) was fixed among a flint group identified by Structure. Altogether, the results obtained here support the implication ofDwarf8polymorphism in flowering time variation in maize. Further analysis of the contribution ofDwarf8to the dynamics of maize adaptation should include a comprehensive study of the correlation between D8idp frequencies and the growing season length at the scale of the geographical origins of the landraces. Also, additional investigations should be performed with the other polymorphisms ofDwarf8to investigate their possible role on the flowering time phenotype. In particular, it is important to discriminate between the effect of the polymorphisms located in the ORF region (including D8idp) and the effect of the MITE element located in the promoter region because these polymorphisms were found to be linked both by
Andersen et al. (2005) and by Thornsberry et al.
(2001). Finally, showing that maize lines transformed with the different alleles of Dwarf8 exhibit altered
flowering time would be the conclusive experimental evidence for the functional role of theDwarf8gene.
The high frequency of theD8-deletionallele is shared by Northern Flint and Andean materials, which other-wise appear as very distant. It is worth noting that Andean material is very particular. It has been reported
by Gouesnardet al. (2002) that, although very late on
average (see Table 5), Andean materials are on average less sensitive to photoperiod than other tropical materi-als. Archaeological studies (Freitaset al.2003) revealed
that South American maize diversity is subdivided into two main components, highland maize from core Andes and lowland maize, and that these two maize types originate from two different introductions from Meso-america. The introduction of maize in core Andes dates back to 4500 before the present (BP), whereas lowland material was introduced after 2000 BP (Freitas et al.
2003). A relevant question would be to know whether theD8-deletionallele was at a high frequency in ancient material when introduced in core Andes, and thus has been inherited from a Mesoamerican ancestral material that no longer exists as suggested by Jaenicke-Despre` s
et al.(2003), or if theD8-deletionincreased in frequency as a result of drift or adaptation to high altitudes from lowland material.
Finally, although Dwarf8 polymorphism may be re-sponsible for more than the 29-dd variation revealed by association genetics corrected for population structure, it explains only part of the extreme difference (387 dd) between early Northern Flint and late tropical inbreds. Numerous independent QTL potentially involved in flowering time variation in maize have been reported and synthesized through meta-analysis into 62 consen-sus QTL widely distributed on all 10 chromosomes
(Chardonet al.2004). Large efforts are presently
un-derway in several groups to identify candidate genes and/or to clone these QTL (Salvi et al. 2002). The
investigation of the association between their molecular polymorphism and flowering time, as well as that of their differentiation between contrasted genetic groups, should prove extremely useful to better understand the genetic control of flowering time and climatic adapta-tion in maize.