University of Windsor University of Windsor
Scholarship at UWindsor
Scholarship at UWindsor
Electronic Theses and Dissertations Theses, Dissertations, and Major Papers
11-7-2015
Multiobjective Optimization of Low Impact Development
Multiobjective Optimization of Low Impact Development
Stormwater Controls Under Climate Change Conditions
Stormwater Controls Under Climate Change Conditions
Kyle Barry Claver Eckart University of Windsor
Follow this and additional works at: https://scholar.uwindsor.ca/etd
Recommended Citation Recommended Citation
Eckart, Kyle Barry Claver, "Multiobjective Optimization of Low Impact Development Stormwater Controls Under Climate Change Conditions" (2015). Electronic Theses and Dissertations. 5491.
https://scholar.uwindsor.ca/etd/5491
This online database contains the full-text of PhD dissertations and Masters’ theses of University of Windsor students from 1954 forward. These documents are made available for personal study and research purposes only, in accordance with the Canadian Copyright Act and the Creative Commons license—CC BY-NC-ND (Attribution, Non-Commercial, No Derivative Works). Under this license, works must always be attributed to the copyright holder (original author), cannot be used for any commercial purposes, and may not be altered. Any other use would require the permission of the copyright holder. Students may inquire about withdrawing their dissertation and/or thesis from this database. For additional inquiries, please contact the repository administrator via email
i
Multiobjective Optimization of Low Impact Development Stormwater Controls Under
Climate Change Conditions
By
Kyle Barry Claver Eckart
A Thesis
Submitted to the Faculty of Graduate Studies
through the Department of Civil and Environmental Engineering
in Partial Fulfillment of the Requirements for
the Degree of Master of Applied Science
at the University of Windsor
Windsor, Ontario, Canada
2015
ii
Multiobjective Optimization of Low Impact Development Stormwater Controls Under Climate
Change Conditions
By
Kyle Barry Claver Eckart
APPROVED BY:
__________________________________________
Dr. P. Henshaw
Civil and Environmental Engineering
__________________________________________
Dr. K. Tepe
Electrical and Computer Engineering
__________________________________________
Dr. T. Bolisetti, Advisor Civil and Environmental Engineering
iii
Author's Declaration of Originality
I hereby certify that I am the sole author of this thesis and that no part of this thesis has been
published or submitted for publication.
I certify that, to the best of my knowledge, my thesis does not infringe upon anyone’s copyright
nor violate any proprietary rights and that any ideas, techniques, quotations, or any other material
from the work of other people included in my thesis, published or otherwise, are fully
acknowledged in accordance with the standard referencing practices. Furthermore, to the extent
that I have included copyrighted material that surpasses the bounds of fair dealing within the
meaning of the Canada Copyright Act, I certify that I have obtained a written permission from the
copyright owner(s) to include such material(s) in my thesis and have included copies of such
copyright clearances to my appendix This permission was received via emails between the
authors and me. The material taken from other sources is as follows:
Material taken from a different thesis (Rahman, 2007): Table 3-1 and 3-2
From the SWMM User Guide (Rossman, 2010): Figures 4-2, 4-3, and 4-4
From the SWMM Applications Guide (Gironás et al., 2009): Figure 4-7
I declare that this is a true copy of my thesis, including any final revisions, as approved by my
thesis committee and the Graduate Studies office, and that this thesis has not been submitted for a
iv
Abstract
A coupled optimization-simulation model was developed by linking the U.S. EPA
Stormwater Management Model (SWMM) to the Borg Multiobjective Evolutionary Algorithm
(Borg MOEA). The coupled model is capable of performing multiobjective optimization which
use SWMM simulations as a tool to evaluate potential solutions to the optimization problem. For
this research, the optimization-simulation tool was used to evaluate low impact development
(LID) stormwater controls. LID is becoming increasingly prevalent as a climate change
adaptation strategy. A SWMM model was developed, calibrated, and validated for a sewershed
in Windsor, Ontario. LID stormwater controls were tested under both historical and climate
change conditions. LID implementation strategies were optimized using the
optimization-simulation model for 30 different scenarios with the objectives of minimizing peak flow in the
stormsewers, reducing total runoff, and minimizing cost. The results of these simulations
v
Dedication
This thesis is dedicated to my family.
vi
Acknowledgements
First and foremost I would like to acknowledge my advisor, Dr. Tirupati Bolisetti. His
guidance has been incredibly valuable in my journey to complete this thesis. Over three years he
has generously shared his knowledge and wisdom and his time, helping me whenever I needed.
Dr. Bolisetti's patience and support allowed me to learn and grow as a person while completing
my graduate studies. Dr. Bolisetti only wants the best for his students and I have been fortunate
to have him as an advisor.
Next, I would like to acknowledge Karina Richters, the City of Windsor's Supervisor for
Environmental Sustainability and Climate Change, whose collaboration made this research
possible.
The valuable feedback provided and patience shown by my committee members Dr. Paul
Henshaw and Dr. Kemal Tepe has also been an important contribution to the completion of a high
quality thesis.
I must also acknowledge Dr. David Hadka and Dr. Reed who developed and shared the
Borg MOEA, a vital component of this thesis, as well all those who contribute to the development
of the SWMM model and provide support for its use.
Luke Meyers and Vimal Jesudhas also deserve many thanks. Their time and expertise
was vital to writing the code necessary to build the optimization-simulation system.
Two people very important to me have also provided me with assistance, simply out of
their generosity, in order to help me to complete my thesis and preserve my mental health in
trying times. Those people are my wonderful Mom, and Ashley Imeson. I would also like to
thank anyone else that helped me with any part of my thesis. These people include Craig Irwin,
Aojeen Issac, Baldhir Singh, Aakash Bagchi, Rafal Marynowski, Sai Praneeth, Vinod Chilkoti,
vii
Finally, I would like to thank all of my friends at Engineers Without Borders Canada.
Part of the incredible learning experience I have had has been provided by EWB. EWB has given
viii
Table of Contents
Author's Declaration of Originality ... iii
Abstract ... iv
Dedication ... v
Acknowledgements ... vi
List of Tables ... xiv
List of Figures ... xvii
List of Abbreviations ... xxi
1 Introduction ... 1
1.1 Background ... 1
1.2 Research Objectives ... 5
1.3 Thesis Organization ... 6
2 Literature Review ... 8
2.1 Introduction to Low Impact Development ... 8
2.1.1 Design Principles ... 8
2.1.2 Adoption of LID ... 11
2.1.3 Improving Adoption of LID ... 13
2.1.3.1 Community Engagement... 13
2.1.3.2 Municipal and Consulting Professionals ... 14
2.1.4 Location Dependencies of LID ... 16
2.2 Evaluation of Low Impact Development ... 17
2.2.1 LID Case Studies ... 17
2.2.1.1 Overview ... 17
2.2.1.2 Hydrology ... 18
2.2.1.3 Water Quality ... 22
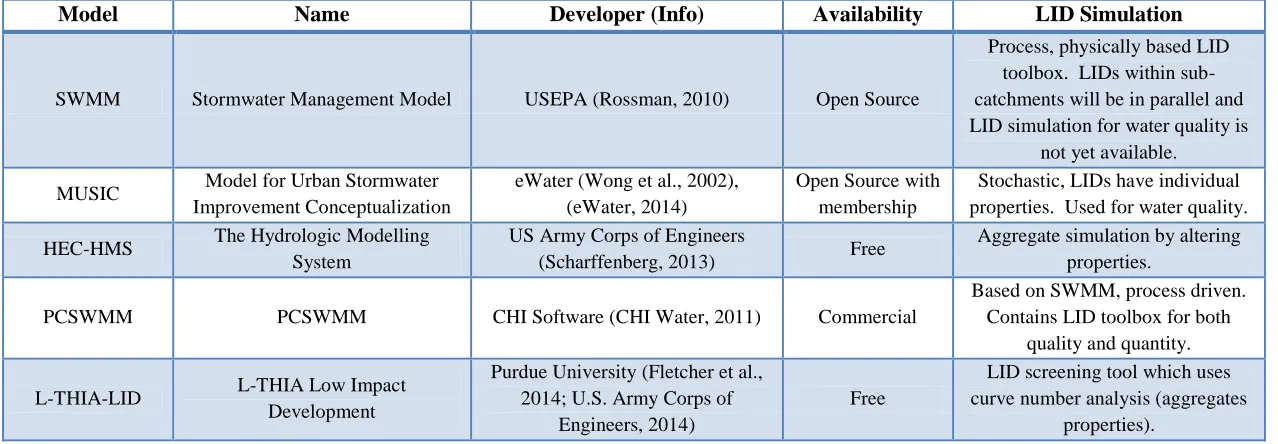
2.2.2 Computer Modeling of LID ... 25
2.2.2.1 Overview ... 25
2.2.2.2 LID Representation in Models ... 27
2.2.2.3 Hydrology ... 29
2.2.2.4 Water Quality ... 32
2.2.2.5 Optimization ... 35
ix
2.2.4 Monitoring and Evaluation and Research Gaps ... 39
2.3 Conclusions ... 42
3 Study Area Description ... 43
3.1 Introduction ... 43
3.2 Stormwater Challenges ... 43
3.3 Location and Land Cover ... 43
3.4 Sewer Network... 47
3.5 Soils and Slopes ... 49
3.6 Climate ... 53
4 Hydrological Model ... 55
4.1 Stormwater Management Model ... 55
4.1.1 Overview ... 55
4.1.2 Infiltration and Runoff ... 57
4.1.2.1 Overview ... 57
4.1.2.2 Green-Ampt ... 57
4.1.2.3 Horton's Equation... 58
4.1.2.4 Curve Number Method ... 58
4.1.3 Routing ... 59
4.1.4 LID Representation ... 60
4.1.5 Objectives of Model Development ... 62
4.2 Data ... 62
4.2.1 Precipitation Data ... 62
4.2.1.1 Available Data ... 62
4.2.1.2 Selection of Events ... 63
4.2.1.3 Selection of Rain Gauges ... 65
4.2.2 Flow Monitoring Data ... 67
4.3 Model Development ... 67
4.3.1 Subcatchments ... 67
4.3.2 Conduits ... 69
4.3.3 Nodes ... 69
4.3.4 Other Properties ... 69
4.3.5 Sensitivity Testing ... 70
x
4.4 Results and Discussion ... 78
4.4.1 Calibration Events ... 78
4.4.1.1 Calibration for the events from 7/15/13 to 7/23/13 ... 78
4.4.1.2 Calibration for the events from 10/4/13 to 10/7/13 ... 82
4.4.2 Validation Events ... 85
4.4.3 Comparison of Peak Flows ... 88
4.5 Summary and Conclusions ... 90
5 Design of LID Controls ... 91
5.1 Overview ... 91
5.2 LID Design Strategy ... 91
5.3 Rain Barrels ... 92
5.3.1 Design ... 92
5.3.2 Costing ... 95
5.4 Rain Gardens and Bioretention Units ... 95
5.4.1 Design ... 95
5.4.2 Costing ... 101
5.5 Infiltration Trenches ... 103
5.5.1 Design ... 103
5.5.2 Costing ... 106
5.6 Permeable Pavement ... 107
5.6.1 Design ... 107
5.6.2 Costing ... 110
5.7 Grassed Swales ... 112
5.7.1 Implementation in SWMM ... 112
5.7.2 Design ... 113
5.7.3 Performance of Swales... 115
5.8 LID Underdrain Coefficients ... 116
5.9 Initial Saturation Testing ... 118
5.10 LID Combinations ... 120
6 Optimization ... 122
6.1 Objectives of Optimization ... 122
6.2 Single Objective Optimization ... 122
xi
6.3.1 Overview ... 123
6.3.2 Benefits of Using Multiobjective Optimization ... 123
6.3.3 Pareto Dominance ... 125
6.3.3.1 Dominance and Non-Dominated ... 125
6.3.3.2 Pareto-Optimal Set ... 126
6.3.3.3 Pareto Front ... 126
6.4 Genetic Algorithms ... 127
6.4.1 Overview ... 127
6.4.2 Weaknesses of GAs ... 129
6.4.3 Advantages of GAs ... 130
6.5 Borg MOEA ... 130
6.5.1 Overview ... 130
6.5.2 Dominance, Population, and Archive ... 131
6.5.3 Generating New Solutions ... 132
6.6 Optimization Methodology ... 133
6.6.1 Overview ... 133
6.6.2 Layout of Optimization System ... 133
6.6.3 Objective Functions ... 135
6.6.4 Decision Variables ... 136
6.6.5 Verification of Optimization ... 138
6.6.6 Borg Parameters ... 139
7 Development of Scenarios ... 144
7.1 Overview ... 144
7.2 Climate Change and Design Storms ... 144
7.2.1 Climate Change Scenario ... 144
7.2.2 Development of Design Storms ... 145
7.3 LID Adoption Scenarios ... 146
7.4 Summary of Scenarios ... 151
8 Results and Discussion ... 152
8.1 Overview ... 152
8.2 Individual LID Testing ... 153
8.2.1 Peak Flow and Total Runoff ... 153
xii
8.3 Retrofit, Low LID Adoption ... 160
8.3.1 All Solutions ... 160
8.3.2 Non-dominated Peak Flow Solutions ... 162
8.3.3 Non-dominated Runoff Solutions ... 166
8.4 Retrofit, High LID Adoption ... 168
8.4.1 All Solutions ... 168
8.4.2 Non-dominated Peak Flow Solutions ... 171
8.4.3 Non-dominated Runoff Solutions ... 172
8.5 New Development, Low LID Adoption ... 173
8.5.1 All Solutions ... 173
8.5.2 Non-dominated Peak Flow Solutions ... 175
8.5.3 Non-dominated Runoff Solutions ... 176
8.6 New Development, High LID Adoption ... 177
8.6.1 All Solutions ... 177
8.6.2 Non-dominated Peak Flow Solutions ... 179
8.6.3 Non-dominated Runoff Solutions ... 182
8.7 New Development, Unrestricted LID Adoption ... 185
8.7.1 All Solutions ... 185
8.7.2 Non-dominated Peak Flow Solutions ... 188
8.7.3 Non-dominated Runoff Solutions ... 189
8.8 Comparisons of Scenarios ... 190
8.9 Cost and Sizing ... 194
8.9.1 Peak Flow Cost-Effective Solutions ... 194
8.9.1.1 Retrofit, Low LID Adoption ... 195
8.9.1.2 Retrofit, High LID Adoption ... 196
8.9.1.3 New Development, Low LID Adoption... 197
8.9.1.4 New Development, High LID Adoption ... 198
8.9.1.5 New Development, Unrestricted LID Adoption ... 199
8.9.2 Total Runoff Cost-Effective Solutions ... 200
8.9.2.1 Retrofit, Low LID Adoption ... 200
8.9.2.2 Retrofit, High LID Adoption ... 202
8.9.2.3 New Development, Low LID Adoption... 203
xiii
8.9.2.5 New Development, Unrestricted LID Adoption ... 205
8.10 Extended Duration Tests (July15th event) ... 206
8.11 Summary ... 209
9 Conclusions ... 210
References ... 214
Appendix A: SWMM Input File ... 227
Appendix B: Sewer Maps ... 291
Appendix C: Rainfall Files ... 301
Appendix D: Additional LID Design Information ... 314
Appendix E: Borg Problem Setup ... 322
Appendix F: Tables of Solutions ... 325
Appendix G: IDF Curves ... 412
xiv
List of Tables
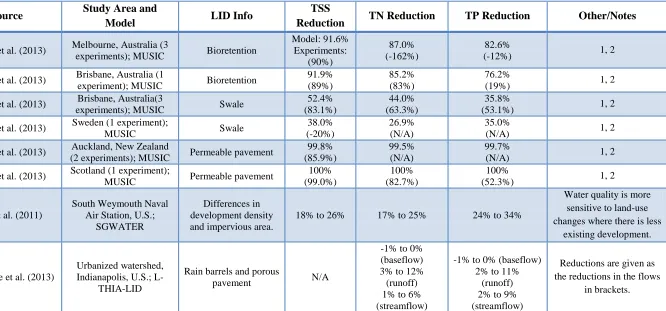
Table 2-1 Water quantity and hydraulics from field studies ... 21
Table 2-2 Percent reductions in pollutant loading observed in field studies of LIDs ... 24
Table 2-3 LID representation in modelling ... 28
Table 2-4 Hydrologic and hydraulic performance of LIDs in simulation ... 33
Table 2-5 Percent reductions in pollutant loading from simulated LIDs ... 34
Table 3-1 Brookston Clay properties (Rahman, 2007) ... 49
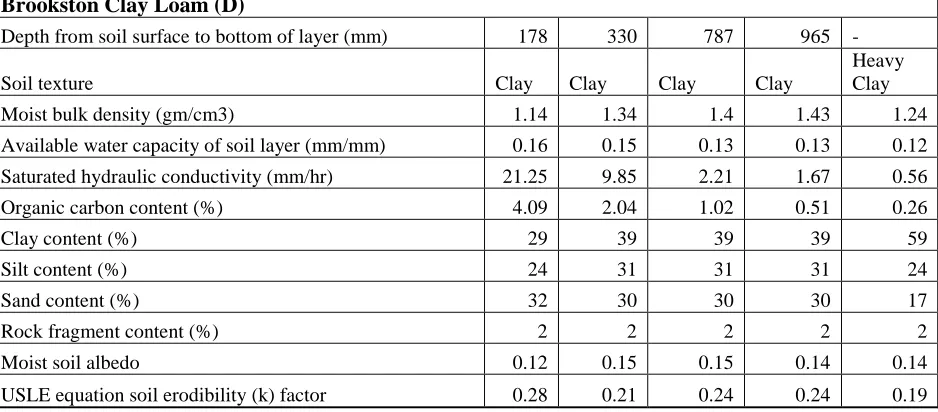
Table 3-2 Brookston Clay Loam properties (Rahman, 2007) ... 50
Table 3-3 Monthly pan evaporation (mm) ... 54
Table 4-1 Recorded rain events ... 64
Table 4-2 SWMM calibration parameters used in previous studies ... 77
Table 4-3 Calibration statistics for the events from July 15th to 24th ... 82
Table 4-4 Calibration statistics without zeros for the events from July 15th to 24th ... 82
Table 4-5 Calibration statistics for the events from October 4th to 7th ... 85
Table 4-6 Calibration statistics without zeros for the events from October 4th to 7th ... 85
Table 4-7 Comparison of peak flows and times to peak... 89
Table 5-1 Rain barrel storage layer parameters ... 92
Table 5-2 Rain barrel underdrain parameters ... 94
Table 5-3 Rain barrel subcatchment parameters ... 94
Table 5-4 Rain barrel costing ... 95
Table 5-5 Rain garden and bioretention surface layer parameters ... 97
Table 5-6 Rain garden and bioretention soil layer parameters ... 97
Table 5-7 Rain garden and bioretention storage layer parameters ... 98
Table 5-8 Rain garden and bioretention underdrain parameters ... 100
Table 5-9 Rain garden and bioretention subcatchment parameters ... 101
Table 5-10 Bioretention and rain garden costing ... 102
Table 5-11 Infiltration trench surface layer parameters... 103
Table 5-12 Infiltration trench storage layer parameters... 104
Table 5-13 Infiltration trench underdrain parameters ... 104
Table 5-14 Infiltration trench subcatchment parameters ... 105
Table 5-15 Infiltration trench costing ... 106
Table 5-16 Permeable pavement surface layer parameters ... 107
Table 5-17 Pavement layer parameters ... 108
Table 5-18 Permeable pavement storage layer parameters ... 108
Table 5-19 Permeable pavement underdrain parameters ... 109
xv
Table 5-21 Permeable pavement costing ... 111
Table 5-22 Infiltration trench underdrain coefficient ... 116
Table 5-23 Bioretention underdrain coefficient ... 117
Table 5-24 Permeable pavement underdrain coefficient ... 117
Table 5-25 Rain garden saturation test ... 118
Table 5-26 Bioretention saturation test ... 119
Table 5-27 Infiltration trench saturation trench ... 119
Table 5-28 Permeable pavement saturation trench ... 119
Table 5-29 Routing schemes for runoff from impervious surfaces to LID controls ... 121
Table 6-1 Decision variables ... 138
Table 6-2 Epsilon values used for optimization ... 142
Table 6-3 Changes to Borg operation parameters ... 143
Table 7-1 Typical public adoption rates of LID controls ... 147
Table 7-2 Maximum adoption rates of each LID control by percent of houses or subcatchments ... 148
Table 7-3 LID acronyms ... 150
Table 7-4 Number of units for infiltration trench in each adoption scenario ... 150
Table 7-5 Number of units for rain garden in each adoption scenario ... 150
Table 7-6 Number of units for bioretention in each adoption scenario ... 150
Table 7-7 Number of adopting houses for rain barrels and permeable pavement in each adoption scenario ... 151
Table 8-1 Performance summary of individual LID types fully adopted ... 154
Table 8-2 Total runoff for single LID controls during the July 15th series of events ... 156
Table 8-3 Sizing decision variable values for the peak flow reduction, cost-effective solutions from the retrofit-low scenario ... 195
Table 8-4 Sizing decision variable values for the peak flow reduction, cost-effective solutions from the retrofit-high scenario ... 196
Table 8-5 Sizing decision variable values for the peak flow reduction, cost-effective solutions from the new development-low scenario ... 197
Table 8-6 Sizing decision variable values for the peak flow reduction, cost-effective solutions from the new development-high scenario ... 198
Table 8-7 Sizing decision variable values for the peak flow reduction, cost-effective solutions from the new development-unrestricted scenario ... 199
Table 8-8 Sizing decision variable values for the total runoff reduction, cost-effective solutions from the retrofit-low scenario ... 201
xvi
xvii
List of Figures
Figure 3-1 Study area location ... 45
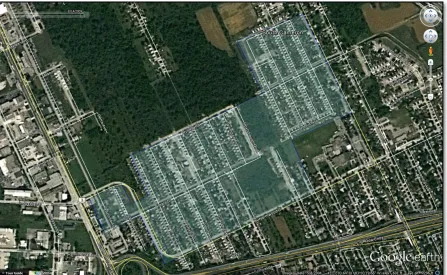
Figure 3-2 Google Earth image of study area, 2007 ... 45
Figure 3-3 Google Earth image of study area, 2009 ... 46
Figure 3-4 ArcGIS map of study area land cover ... 47
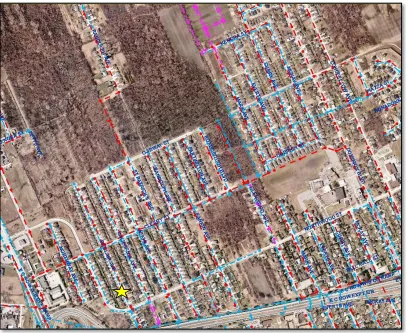
Figure 3-5 Sewer map of study area ... 48
Figure 3-6 ArcGIS map of study area soils ... 51
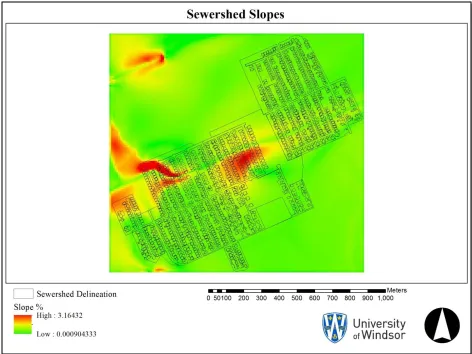
Figure 3-7 ArcGIS map of study area slopes ... 52
Figure 3-8 ArcGIS digital elevation map ... 53
Figure 4-1 Screenshot of SWMM model ... 56
Figure 4-2 SWMM infiltration scheme (Rossman, 2010, p.56) ... 57
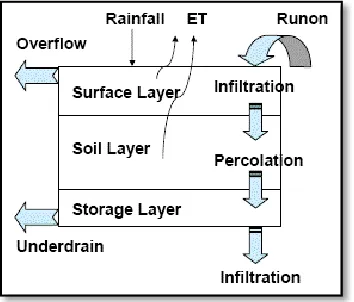
Figure 4-3 SWMM LID processes (Rossman, 2010, p.60) ... 61
Figure 4-4 SWMM LID routing scheme (Rossman, 2010, p.55) ... 62
Figure 4-5 Rain gauge locations (Provided by the City of Windsor, 2014) ... 63
Figure 4-6 Comparison of rain gauges for the July 15th event ... 66
Figure 4-7 SWMM subcatchment width (Gironás et al., 2009, p.17) ... 69
Figure 4-8 Sensitivity of the model hydrograph to subcatchment % zero ... 72
Figure 4-9 Sensitivity of the model hydrograph to subcatchment % imperviousness ... 73
Figure 4-10 Sensitivity of the model hydrograph to subcatchment curve number ... 74
Figure 4-11 Sensitivity of the model hydrograph to subcatchment width ... 75
Figure 4-12 Calibration of the SWMM model for the events from July 15th to 24th, 2013 ... 80
Figure 4-13 Modeled and observed hydrographs for the events from July 15th to 24th, 2013 ... 81
Figure 4-14 Calibration of the SWMM model for the events from October 4th to 7th, 2013 ... 83
Figure 4-15 Modeled and observed hydrographs for the events from October 4th to 7th, 2013 ... 84
Figure 4-16 Modeled and observed hydrographs for the events from Augusts 26th to 31st, 2013 ... 86
Figure 4-17 Modeled and observed hydrographs for the events from October 30th to November 1st, 2013 .. 87
Figure 6-1 Example of a pareto-optimal front ... 127
Figure 6-2 General GA Scheme ... 129
Figure 6-3 Coupled optimization-simulation model framework ... 134
Figure 6-4 Overview of optimization-simulation scheme ... 135
Figure 6-5 Convergence test with peak flow reduction displayed ... 140
Figure 6-6 Convergence test with total runoff reduction displayed ... 141
Figure 7-1 Cumulative rainfall for each storm scenario ... 146
xviii
Figure 8-2 Hydrographs for the implementation of single LID types during the July 15th series of events
(2nd set) ... 158
Figure 8-3 Hydrograph for the implementation of swales during the July 15th series of events ... 159
Figure 8-4 Peak flow reduction, by percentage, for the retrofit-low scenario ... 161
Figure 8-5 Total runoff reduction, by percentage, for the retrofit-low scenario ... 162
Figure 8-6 Solutions non-dominated in peak flow reduction or cost for the retrofit-low scenario ... 163
Figure 8-7 Explanation for the changes in peak flow reduction performance in the retrofit-low scenario . 165 Figure 8-8 Solutions non-dominated in total runoff reduction or cost for the retrofit-low scenario ... 166
Figure 8-9 Explanation for changes in total runoff reduction in the retrofit-low scenario ... 167
Figure 8-10 Peak flow reduction, by percentage, for the retrofit-high scenario ... 170
Figure 8-11 Total runoff reduction, by percentage, for the retrofit-high scenario ... 170
Figure 8-12 Solutions non-dominated in peak flow reduction or cost for the retrofit-high scenario ... 171
Figure 8-13 Solutions non-dominated in total runoff reduction or cost for the retrofit-high scenario ... 172
Figure 8-14 Peak flow reduction, by percentage, for the new development-low scenario ... 174
Figure 8-15 Total runoff reduction, by percentage, for the new development-low scenario ... 174
Figure 8-16 Solutions non-dominated in peak flow reduction or cost for the new development- low scenario ...175
Figure 8-17 Solutions non-dominated in total runoff reduction or cost for the new development-low scenario ... 176
Figure 8-18 Peak flow reduction, by percentage, for the new development-high scenario ... 178
Figure 8-19 Total runoff reduction, by percentage, for the new development-high scenario... 178
Figure 8-20 Solutions non-dominated in peak flow reduction or cost for the new development-high scenario . ... 179
Figure 8-21 Explanation of changes in peak flow reduction for the new development-high scenario ... 181
Figure 8-22 Solutions non-dominated in total runoff reduction or cost for the new development-high scenario ... 182
Figure 8-23 Explanation of changes in total runoff reduction for the new development-high scenario ... 184
Figure 8-24 Peak flow reduction, by percentage, for the new development-unrestricted scenario ... 186
Figure 8-25 Total runoff reduction, by percentage, for the new development-unrestricted scenario ... 186
Figure 8-26 Explanation of raw results for peak flow reduction in the new development-unrestricted scenario ... 187
Figure 8-27 Solutions non-dominated in peak flow reduction or cost for the new development- unrestricted scenaro ... 189
Figure 8-28 Solutions non-dominated in total runoff reduction or cost for the new development- unrestricted scenario ... 190
xix
Figure 8-30 Non-dominated total runoff reduction, for each LID implementation scenario, during the
historical 100 year storm ... 193
Figure 8-31 Mean cost breakdown of the peak flow reduction, cost-effective solutions from the retrofit- low scenario ... 195
Figure 8-32 Mean cost breakdown of the peak flow reduction, cost-effective solutions from the retrofit-high scenario ... 196
Figure 8-33 Mean cost breakdown for the peak flow reduction, cost-effective solutions from the new development-low scenario ... 197
Figure 8-34 Mean cost breakdown for the peak flow reduction, cost-effective solutions from the new development-high scenario ... 199
Figure 8-35 Mean cost breakdown for the peak flow reduction, cost-effective solutions from the new development-unrestricted scenario ... 200
Figure 8-36 Mean cost breakdown of the total runoff reduction, cost-effective solutions from the retrofit-low scenario... 201
Figure 8-37 Mean cost breakdown of the total runoff reduction, cost-effective solutions from the retrofit-high scenario ... 202
Figure 8-38 Mean cost breakdown of the total runoff reduction, cost-effective solutions from the new development-low scenario ... 203
Figure 8-39 Mean cost breakdown of total runoff reduction, cost-effective solutions from the new development-high scenario ... 204
Figure 8-40 Mean cost breakdown of the total runoff reduction, cost-effective solutions from the new development-unrestricted scenario ... 205
Figure 8-41 Hydrographs of typical peak flow reduction, cost-effective solutions tested during the July 15th series of events ... 207
Figure 8-42 Hydrographs of typical total runoff reduction, cost-effective solutions tested during the July 15th series of events ... 208
Figure D 1 Conceptual LID layout for a single lot ... 315
Figure D 2 Section view sketch of infiltration trench ... 316
Figure D 3 Conceptual infiltration trench plan view sketch ... 317
Figure D 4 Conceptual rain garden design ... 318
Figure D 5 Conceptual bioretention unit design ... 319
xx
Figure G 1 Environment Canada IDF curve for Windsor Airport ... 413
Figure G 2 IDF CC Tool curve for historical data... 414
Figure G 3 IDF CC Tool curve for RCP 8.5 data ... 415
xxi
List of Abbreviations
BMP = Best management practice
BMPDSS = Best management practice decision support tool
BR = Bioretention
C = Clay, i.e., Brookston clay
CN = Curve number
CSO = Combined sewer overflow
EA = Evolutionary algorithm
EPA = United States Environmental Protection Agency
GA = Genetic algorithm
GIS = Global information system
IDF = Intensity-duration-frequency (related to IDF curves)
IPCC = Intergovernmental panel on climate change
IT = Infiltration trench
IUSM = Integrated urban stormwater management
IUWM = Integrated urban water management
L = Loam, i.e., Brookston clay loam
LID = Low impact development
LIUDD = Low impact urban design and development
MOEA = Multiobjective evolutionary algorithm
PP = Permeable pavement
RB = Rain barrel
RG = Rain garden
S = Sand, i.e., Berrien sand
SCS = Soil conservation society (related to curve number method)
SuDS = Sustainable drainage system
SWM = Stormwater management
SWMM = Stormwater management model (EPA model)
WQV = Water quality volume
1
1
Introduction
1.1
Background
Urban stormwater management (SWM) has major ecological, economical and social
importance. Methods for urban stormwater management must evolve to meet the increased
demands resulting from urbanization, climate change and budgetary constraints
The traditional approach to urban stormwater management has been to use curbs, gutters,
other grey infrastructure and sewers to convey the stormwater through a centralized system as
rapidly and safely as possible. This approach, which looks to separate urban residents from the
water management systems, generally does not contribute to sustainable urban development
(Mitchell, 2006; van Roon, 2007; Wong and Eadie, 2000). Modern stormwater management
objectives are evolving and now often include protecting water quality, maintaining the health of
aquatic ecosystems and utilizing stormwater as a resource (Wong and Eadie, 2000). This is
consistent with a desire for development which is ecologically, economically, and socially
sustainable (van Roon, 2007). Visitacion et al. (2009) conducted interviews with 47 stormwater
experts in the Puget Sound region of Washington, U.S. The aggregate ranking as to the opinion
of the importance of stormwater impacts, in order of decreasing significance, was: water quality,
effects on biota, effects on habitat, and flooding (Visitacion et al., 2009). The stresses of climate
change and increasing urbanization make it even more difficult to manage the impacts listed by
the authors.
Increased urbanization stresses urban stormwater management systems and consequently
urban watersheds. "Urban and rural practices in New Zealand, the United States, Canada, and
Australia over the past 40 years have radically changed the hydrology of catchments, streams and
estuaries" (van Roon, 2005). For example, in Puget Sound watershed urbanization between 1972
and 1996 resulted in a 37% reduction in forest cover (van Roon, 2005). Urbanization is likely to
2
periods of base flow to periods of stormflow, and increased daily variation in streamflow"
(Konrad and Booth, 2005). Development alters the water balance, decreasing infiltration and
consequently groundwater recharge and increasing stormwater runoff (Wong, 2006). In fact, it is
well understood that urbanization leads to decreased infiltration and base flow, and increased
runoff and discharge from sewer outlets. Modelling with the forecasted land use changes to the
Muskegon River watershed, located on the eastern coast of Lake Michigan, predicts
watershed-wide runoff to increase by 12% relative to 1978 under an urban sprawl scenario (Tang et
al.,2005). In Watford Connecticut a study was conducted on a 2.0 ha subdivision in a drainage
basin contributing to a small estuary. The subdivision, built using traditional stormwater
infrastructure, increased the impervious portion of the site from 1% to about 32%. This resulted
in annual runoff increasing from 0.1 cm to over 50 cm and significant increases in nitrogen and
phosphorus export occurred as well (Dietz and Clausen, 2008). The authors of this paper
reasoned that the extreme response to development may have resulted from the small study area
and these changes would likely be dampened (although still significant) in larger watersheds as
has been reported in other studies including Jennings (2002).
The most significant impacts from accelerated stormwater runoff are generally associated
with damage to aquatic ecosystems (Jennings et al., 2012). Ecosystems in urban streams will be
altered and can only be restored with the reestablishment of pre-development hydrologic
processes (Konrad and Booth, 2005). This damage can be caused by physical degradation, the
transport and subsequent accumulation of toxic contaminants in receiving waters and organisms,
and the transportation of nutrients which might lead to algae growth and eutrophication (Shuster
et al., 2008; van Roon, 2007; Wong and Eadie, 2000). These concerns, as well as property
damage from flooding, usually exceed the costs of stormwater management (Visitacion et al.,
2009). Reports after 2007 floods in the United Kingdom suggested that upwards of two-thirds of
the urban flooding resulted from the failings of urban drainage systems, especially during extreme
3
593,955 miles of streams and rivers in the U.S. (about 16% of the total length) found that 44%
were impaired (USEPA, 2009). In this case impaired means that the stream or river could not
support at least one of their designated uses. It was also reported that the urban runoff was a
factor in the impairment of 22,559 miles, unspecified nonpoint source pollution in 34,556 miles,
and municipal sewage discharges in 35,302 miles. Sewer overflows are relevant because in many
cases, urbanization has led to problems with combined sewer overflows and/or basement and
street flooding (Stovin et al., 2012). The Ontario (Canada) Ministry of the Environment
estimated a total volume of 18 billion litres of CSOs in 2006 and 8 billion litres in 2007 making
CSOs the largest single source of water pollution into Ontario water bodies (Ecojustice, 2009).
CSOs continue to be a major problem today (Ecojustice, 2013). These problems worsen with
increased urbanization, population growth, and climate change (Stovin et al., 2012; Visitacion et
al., 2009).
IPCC (2007) showed widespread scientific consensus that the evidence shows "warming
of the climate system is unequivocal." More recently the milestone of 400 ppm CO2 was passed
in Hawaii and experts believe significant warming is inevitable (Borenstein, 2013). Climate
change is a topic of great concern for stormwater management. Many cities, New York, Toronto
and London to name just a few, are utilizing green infrastructure as part of climate change
adaptation strategies. EBNFLOW (2010) reports that future climate changes may significantly
alter the water budget for Ontario, Canada and stress water infrastructure. In Windsor, Ontario,
Canada a city climate change adaptation plan cited that climate change would pose a substantial
risk to city operations by increasing demand in all areas due to an increase in severe storms and
"an increased chance of flooding to basements, roads and other infrastructure” (The City of
Windsor, 2012).
The concerns regarding hydrologic disturbance are consistent with observed and
predicted climate change impacts. The IPCC reports varying precipitation changes but finds it
4
from heavy falls) has increased in most areas" and very likely (>90% probability of occurrence)
that heavy precipitation events will become more frequent (IPCC, 2007).
Climate change is expected to cause an intensification of the global water cycle. One result is
that runoff is widely expected to increase through the 21st century (Huntington, 2006). For
Toronto, Ontario, Cobbina (2007) studied climate change impacts on precipitation and runoff
using time series analysis and found that an increased amount of small precipitation events would
increase the runoff but no significant trend for extreme weather events. Franczyk and Chang
(2009), while modelling the Rock Creek Basin in Oregon U.S., concluded that the combination of
land-use change and climate change would amplify runoff even relative to what was found by
studies examining only one of those factors. Semadeni-Davies et al. (2008) simulated (using the
MOUSE urban drainage model) the impacts of several climate change and urban development
scenarios on the combined sewer network of Helsingborg, Sweden. They found that both
urbanization and climate change would increase combined sewer overflows (CSOs) with the
worst case scenario (including both factors) seeing a 450% increase in the volume of CSOs and a
10-fold increase in the release of ammonia (Semadeni-Davies et al., 2008).
Denault et al. (2006) examined the impacts of changes to the precipitation patterns
(becoming more intense for short storms) in the Mission/Wagg Creek watershed in British
Columbia, Canada using regression analysis and the U.S. EPA Storm Water Management Model
(SWMM). Their results indicated that with proper planning infrastructure could be adequately
upgraded at a reasonable cost to account for urbanization and climate change. However, they
also found that the increased runoff would likely damage stream health as increases in runoff
might be similar to the effects of increasing the impervious or urbanized area (Denault et al.,
2006), which is known to have a negative effect on stream health (Morley and Karr, 2002). The
intensities of the rainfall in many parts of world are projected to be increasing. However, though
the number of intense rainfall events appears to be increasing, the intensities do not seem to be
5
be spatially diverse, the literature does seem consistent in re-affirming that it will add additional
stress to urban stormwater management challenges, especially with the additional factor of
increased urbanization.
In their 2008 paper, Dietz and Clausen observed significant improvements in stormwater
management with the application of low impact development (LID). Low impact development is
an approach to stormwater management which is gaining popularity, especially as a climate
change adaptation strategy. The LID philosophy incorporates various types of green
infrastructure, natural features, and ecologically considerate development planning in order to
improve hydrological systems impacted by urban stormwater. Low impact development is
explained further in Chapter 2. Developing low knowledge on low impact development is a key
component of this thesis.
1.2
Research Objectives
The first primary objective of this research was to develop an optimization-simulation
model which can be used to generate important information about low impact development
(LID). More specifically the model should be able to conduct multiobjective optimization so that
cost-benefit curves can be easily generated. The model will also allow users to analyze the
significance of various design parameters for LID controls. The optimization-simulation model is
to be created by linking the stormwater management model (SWMM) to a genetic algorithm, the
Borg Multi-Objective Evolutionary Algorithm (MOEA) (Hadka and Reed, 2013).
The second primary objective is to evaluate the use of LID stormwater controls as a
climate change adaptation strategy. In order to do this, design storms must be created based off
of both historical rainfall data and projected rainfall data under a future climate change scenario.
Then, the performance of low impact development can be tested in each case and the results
compared.
Another requirement for testing both LIDs and the optimization-simulation model is the
6
Ontario. The model must also be calibrated and validated. The use of this model allows for the
secondary objective of learning about the effectiveness of LID implementation in this area,
information that is otherwise lacking.
1.3
Thesis Organization
The body of the thesis contains nine chapters. Chapters 1 and 2 provide an introduction
to the stormwater management problems which necessitate this research, as well as an
introduction to low impact development technologies. Chapter 2 includes the results of past
research done on LIDs as well as information on the different methods used to study them.
Chapter 3 provides information on the study area, a sewershed in Windsor, Ontario, that was used
as the basis for the SWMM model. This information is used in Chapter 4 which discusses the
development of the SWMM model. More specifically, Chapter 4 includes a discussion of the
SWMM model, information on the development of the model used in this research, and a
description of the calibration and validation of the model. Chapter 5 discusses the design of the
LID stormwater controls that were used in the model. The end of the chapter includes the results
of some sensitivity testing conducted in order to adjust some design parameters. Also included is
a discussion of how the runoff from impervious surfaces is divided between the different LID
types. Chapter 6 provides an introduction to multiobjective optimization, genetic algorithms, and
the Borg MOEA. It also discusses how the Borg algorithm is linked with the SWMM model to
create the optimization-simulation model and discusses the setup of the optimization component
of the simulations conducted in this research. Chapter 7 discusses the development of the
scenarios used in the simulations. That includes the development of a climate change scenario
and the construction of design storms. LID control adoption and implementation is also
discussed in this chapter. Chapter 8 presents the results of the optimization-simulation scenarios
as well as the results of some additional tests. The results include cost benefit curves, cost
breakdowns, LID sizing information, and hydrographs where various LID strategies are tested
7
for the results are provided. Chapter 9 summarizes the work completed and presents the
conclusions drawn from the research.
Following the main body of the thesis is a set of appendices. Appendix A contains one
the SWMM input file used for one of the scenarios. Appendix B contains the sewer maps used to
design the routing network in the SWMM model. Appendix C contains the contents of the
rainfall files used for each of the optimization-simulations scenarios. Appendix D contains
additional information on the design of the LID controls discussed in Chapter 5. This includes
some conceptual drawings for some of the LID controls. Appendix E contains the code for the
Borg problem set-up from one of the scenarios. In this you can also see the cost functions for that
scenario. Appendix F contains solutions produced in the simulations or used for further analysis.
This includes the raw (sorted) results of each of the 30 optimization-simulation scenarios.
8
2
Literature Review
2.1
Introduction to Low Impact Development
2.1.1 Design Principles
The use of green infrastructure and infiltration techniques in urban development and
stormwater management falls under the umbrella of "low impact development (LID)" in North
America. Other philosophies similar in their treatment of stormwater management are low
impact urban design and development (LIUDD, which is actually a more comprehensive
philosophy) in New Zealand, water sensitive urban design (WSUD) in Australia, and sustainable
urban drainage systems (SuDS) in Europe. These approaches might also include strategies such
as integrated urban stormwater management (IUSM) and integrated urban water management
(IUWM). Henceforth, in some cases, this paper may refer to any one of these approaches as low
impact development or LID and is almost always referring to LID in the context of SWM.
Fletcher et al. (2014) discuss the development and application of these and other terminology
used in the urban drainage field. LID is designed to be more sustainable and look to address the
issues discussed in proceeding sections along with some other negative ecological, economical
and social impacts of traditional urban development (van Roon and Knight, 2004; van Roon,
2007; Wong and Eadie, 2000). At its most ambitious, LID aims to return developed watersheds
to pre-development hydrological conditions (i.e. to mimic natural water cycles or achieve
hydrologic neutrality) (Damodaram et al., 2010; Shuster et. al., 2008; van Roon, 2005; van Roon,
2007). LID is also often used as a retrofit designed to reduce the stress on urban stormwater
systems and/or adapt to climate changes. LID relies heavily on infiltration and evapotranspiration
to achieve these hydrologic objectives (van Roon, 2007). The resulting changes, or lack thereof
for new sustainable development, in hydrologic patterns would allow streams to maintain flow
9
"Water Sensitive Urban Design (WSUD) practices encompass the full spectrum of
planning and engineering practices" (Wong and Eadie, 2000). To achieve sustainable urban
environments, the complete urban water cycle (including stormwater, wastewater, and potable
water) should be taken into consideration along with both anthropogenic and ecological needs
(Mitchell, 2006; van Roon and Knight-Lenihan, 2004; van Roon, 2011). Within this system, the
most sustainable solutions will come from considering the human environment as part of the
natural environment rather than the reverse (van Roon, 2005). Both the ecological and economic
value of land must be recognized in the designing of sustainable SWM systems (CVC, 2010). It
is desirable to take a systemic approach which views all of the aforementioned components as
part of a system which is also linked to the community and broader ecological systems (Mitchell,
2006). Considering the whole systems allows opportunities within the system to be maximized.
LID approaches to SWM often rely upon a variety of decentralized, source control
solutions. The solutions are generally applied on small spatial scaled but can be part of broader
LID strategies. Hydrologicaly, LID measures can be generally classified as either distributed
source controls, more centralized on-site controls, and downstream conveyance controls (Zhou,
2014). Using LID approach can reduce urban runoff (Shuster et al., 2008), and reduce
downstream flooding and damage to water quality (van Roon, 2011). Specific examples of
solutions used as part of LID include green roofs, rain gardens (bioretention cells), soakaways,
swales, permeable pavements, infiltration basins, ponds, rain barrels or cisterns, tree box filters,
curbless roads with swales, downspout disconnection other green infrastructure and natural
solutions and even community education (Debusk and Hunt, 2011; Shuster et al., 2008; Stovin et
al., 2012).
In areas which are already heavily urbanized it might be most feasible simply to retrofit
existing infrastructure such as parking lots, roads, sidewalks and buildings (Damodaram et al.,
2010). In fact, it is very important to be able to retrofit in order to accommodate areas which are
10
might provide additional capacity for infiltration in urban areas but this capacity might be limited
depending on many factors which are spatially variable (Shuster et al., 2008). LID measures can
usually be built into these public spaces without compromising their primary function (CVC,
2010). Another infiltration strategy is to direct runoff from impervious surfaces to pervious
surfaces or retention facilities (Brander et al., 2004). Clustering development at a higher density
in order to leave open more natural land, which might be used for infiltration and
evapotranspiration, is considered an LID practice (van Roon, 2005; Williams and Wise, 2006).
Interestingly, van Roon (2005) reported that some older urban development in New Zealand,
which was built before curb and channel drainage systems were common practice, already has
some LID characteristics. For example, grassed swales or ditches, which are considered to be a
green infrastructure, are common in developments where there isn't a curb drainage system.
Treatment trains consisting of LID solutions in series or parallel can also be effective in
managing runoff (Brown et al., 2012; CVC, 2010). A combination of LID and piped systems or
best management practices (BMPs) can be very effective (Ashley et al., 2011; Damodaram et al.,
2010; Damodaram and Zechman, 2013). Flood retarding basins might also be retrofitted with
wetlands to improve water quality (Wong and Eadie, 2000). To clarify BMPs are usually
measures such as detention ponds used to control runoff. They can be structural or non-structural
and are sometimes considered to be included as LID measures or vice-versa. In any case, LID
uses mechanisms such as infiltration and evapotranspiration and it is very important that specific
LID solutions are carefully matched and scaled for a given application and location (Shuster et
al., 2008). Evapotranspiration does not play a large role in stormwater management but is more
significant in regards to some of the other benefits offered by LID technologies.
Although this review focuses on stormwater management, it is important to remember
that one of the things that makes green infrastructure attractive is that it can offer many benefits.
For example, the City of Toronto, Canada commissioned a study on the costs and benefits of
11
included reduced stormwater runoff, reduced energy consumption, reduced urban heat island
effect, improved air quality and reduced emissions (Banting et al., 2005). Charlesworth (2010)
and City of Portland Bureau of Environmental Services (2010) both reported similar benefits as
well as improvements to community liveability and public health. Providing habitats for wildlife
is another potential benefit (CVC, 2010; CNT, 2010). Green roofs and other green infrastructure
might also provide social capital such as improved aesthetics, park space or citizen involvement
in the community. Some suggested further reading in order to get a more complete view of the
benefits of green infrastructure is CNT (2010), van Roon and van Roon (2009), Moore (2011),
(CNT, 2010) and Ashley et al. (2011b). When taking a systemic approach to the design of the
urban stormwater system, all of these factors should be considered. These additional benefits of
green infrastructure might also help encourage the public to increase support for LID.
2.1.2 Adoption of LID
LID principles are widespread but not yet frequently utilized in most places. Climate
change has been a major driver for LID strategies. Municipalities are planning for future climate
changes and starting to see the effects of more intense storms which, in many places, have already
increased in frequency. LIUDD was founded as a nationwide research and implementation
programme in New Zealand (van Roon et al., 2006). In Australia, where water is in short supply,
the focus has been largely on the recycling and reuse of stormwater and wastewater (van Roon,
2007). "Where resource scarcity or receiving water impacts are drivers for innovation, and this is
combined with a willingness to work with, rather than against, natural processes, innovative
design of greenfield developments follows" (van Roon, 2011, p.334). Mitchell (2006) also
reviewed LID in Australia and found that the most common reason for adopting such practices
was the reduction of negative environmental impacts, particularly related to water resources, and
particularly when project constraints demanded innovative solutions.
van Roon (2007) concluded that there had been widespread use of LIUDD in
12
and developers, but there was not yet a larger, comprehensive approach to adopting LIUDD. A
USEPA memorandum (USEPA, 2011) related to their release of a green infrastructure strategic
agenda encourages communities to use green infrastructure and outlines their plans to partner
with communities to assist them with this. The City of Lancaster, Pa., U.S., has cited this
memorandum in their plans to use integrated green infrastructure to manage water issues. These
issues include CSOs (about 45% of the city drains into a combined sewershed) and water
pollution (Katzenmoyer et al., 2013).
Several major cities around the world are using LID solutions, often as strategies for
climate change adaptation. One of the cities previously mentioned, Toronto, has a mandatory
downspout disconnection (Toronto, 2007) and a by-law regarding mandatory implementation of
green roofs (Toronto, 2009). USEPA (2010) provides a good overview of the development of
green infrastructure across the U.S. They also cite changing regulatory frameworks as well as
asset management decisions (using green infrastructure to reduce strain on grey infrastructure) as
major drivers for the adoption of green infrastructure projects. Portland and Seattle are both
leaders in LID largely because of strict stormwater regulations and rainfall profiles which are well
suited for green infrastructure (Gallo et al., 2012). Portland has also developed tools which can
be used to simplify the design of stormwater facilities.
Wise et al. (2010) reported that, in the U.S., Portland, Seattle, Philadelphia, Kansas City,
New York, Washington, Louisville and more have included green infrastructure in their control
plans for combined sewer overflows (one of the regulatory areas mentioned in the EPA report).
Ashley et al. (2011) adds that in Melbourne, Australia retrofitting with SWMS "is seen as
synonymous with greening and enhancing quality of life". The Environment Agency in the
United Kingdom actively promotes LID (SuDS in their case) (Woods-Ballard et al., 2007). So it
seems that more comprehensive strategies and policies related to LID are being developed. This
13
LID practices (Binstock, 2011; CVC, 2010). The next section will discuss some of the challenges
which must be overcome as LID continues to become more mainstream.
2.1.3 Improving Adoption of LID
2.1.3.1 Community Engagement
When using a decentralized, source control approach to stormwater management,
community involvement becomes much more important. Montalto et al. (2013) developed an
agent based model to represent the decision making of property owners and stochastically
simulate LID adoption in a 175 ha neighbourhood in South Philadelphia. Their results
highlighted the importance of stakeholder engagement and the importance of considering both the
physical and social characteristics of an area targeted for LID adoption.
Shuster et al. (2008) suggested that decentralized stormwater management should be
achieved through guided public participation and local partnerships which might also help to shift
the public perception of stormwater towards valuing it as a resource rather than just viewing it as
a nuisance or waste product. For example, measures, such as downspout disconnection, rain
barrels, and rain gardens among others require widespread public participation in order to be
impactful. This can be a challenge because it might take a great deal of education to get citizens
to recognize the long-term effects stormwater can have on ecology, human health and quality of
life (Visitacionet al., 2009). Jennings et al. (2012) considered that one might encourage the
public to collect rooftop runoff with rain barrels by promoting them as a water source for urban
gardening.
A common approach is financial incentive programs, such as rebates or fees; however,
Roy et al. (2008) reported that these programs are most often flawed. This was not the case with
a demonstration project in the Shepard Creek watershed of Cincinnati OH, where reverse auctions
(paying people to take parcels, with people bidding down the amount they will receive as an
incentive) were used to encourage residents to adopt LID measures such as rain barrels and rain
14
response rate with about 60% of the bids being for $0. The $0 bids would indicate that those
citizens do value LID as they did not require the added incentive of being paid. Based on the
results of this program (Shuster and Rhea, 2013) concluded that novel economic incentive
programs could successfully initiate the adoption of distributed LID measures in suburban area.
One city previously mentioned, Melbourne, has been a leader in engaging organizations
and the community around the adoption of LID (Roy et al., 2008). Lloyd et al. (2002) reported
on a survey of 300 property owners and prospective home buyers from four LID site
developments in Melbourne. More than 90% of respondents were in favour of landscaped and
grassed bio-filtration systems for stormwater management and more than two-thirds thought they
would improve neighborhood aesthetics (Lloyd et al., 2002). Overall the responses received still
indicated a lack of understanding on the benefits of LID. Cote and Wolfe (2014) surveyed
property owners in Kitchener, Ontario, Canada regarding the use of permeable surfaces. They
found that the greatest barriers were awareness, cost, and technological acceptance. The
characteristics commonly seen to drive adoption were a perceived need for improved stormwater
management and the will to take ownership of said issue, as well as a willingness to seek out
information and perform maintenance (Cote and Wolfe, 2014). Frame and Vale (2006) suggested
that the largest barriers to sustainable development are of a social or political nature rather than
technical challenges.
2.1.3.2 Municipal and Consulting Professionals
There are also significant barriers to LID becoming more accepted by professionals in
risk adverse fields, such as engineering, utility operation and management, and public planning.
Some of the common barriers which can lead to this risk (real or perceived) are a lack of
familiarity with new practices, uncertainty about maintenance and who is responsible for
maintenance, and liability issues (Binstock, 2011). Roy et al. (2008) also found problems with
the distribution of responsibility and authority over water management within many watersheds.
15
2012). Similarly, one might implement LID for stormwater purposes without accounting for all
of the other potential benefits. In Australia, many water utility managers were not confident
enough in the long term benefits to their systems to adjust existing systems in order to take full
advantage of the benefits of LID (Mitchell, 2006). Visitacion et al. (2009) found that most
managers of stormwater programs lack the cost and benefit information they need to make
rational funding decisions. To progress towards resolving these issues there should be a
commonly agreed upon method or framework for examining the potential environmental, social,
and economic costs and benefits of water system alternatives over multiple time frames (Mitchell,
2006). It is also important for contractors working on low impact development projects to have
knowledge and experience (Line et al., 2012; Roy et al., 2008; van Roon, 2007).
Lloyd et al. (2002) surveyed stormwater professionals as to what barriers to WSUD
(LID) ranked 'high' or 'very high' in terms of importance. The response showed a lack of an
effective regulatory and operating environment (76% ranked high or very high importance) as the
most important followed by limited quantitative data on long-term performance and best practices
(75%), insufficient information on operation and maintenance and structural best practices (70%),
institutional fragmentation of responsibilities (67%), lacking culture and technical skills within
local governments and water corporations (52%), lack of ability to factor externality costs into
life cycle cost analysis (52%), lack of information of market acceptance of residential properties
with WSUD (52%), and poor construction management leading to reduced effectiveness (39%)
(Lloyd et al., 2002, p.25). One example of sharing LID information between professionals is the
International Stormwater BMP Database http://www.bmpdatabase.org/. This is an open access
Microsoft Access database which contains details from over 500 BMP studies.
Binstock (2011) suggested that funding from higher levels of government would be one
effective method by which to reduce the risk for municipalities experimenting with LID. In
England LID is still not incentivized over traditional grey infrastructure solutions (Stovin et al.,
16
Washington and Maryland have requirements for LID use; however, regulations regarding LID
use should be flexible (Binstock, 2011). Sometimes engineering standards and guidelines can
prevent the adoption of LID (Roy et al., 2008). For example, in some locations roads might be
required to have continuous curbs, stormwater detention basins might be required, and any
ponding might be discouraged.
Roy et al. (2008) suggested that LID policies might be easier to implement in response to
downstream water goals. The previously mentioned case of green infrastructure use in Lancaster,
Pa. (Katzenmoyer et al., 2013) was initiated largely by regulatory requirements that were put in
place to protect downstream water quality. Smullen et al. (2008) also suggested that a key barrier
would be adopting a set of practical targets for CSO and stormwater regulations. In any case
successful implementation of LID practices will require a multidisciplinary approach and
successful coordination between different government agencies (likely at multiple levels of
government), community groups, and the private sector (Brown, 2005; Roy et al., 2008; Wong
and Eadie, 2000). van Roon (2011) suggested "champions of the approach" would be required to
provide leadership and move LID practice forward.
2.1.4 Location Dependencies of LID
LID solutions for SWM can be very location dependant. Since LID measures generally
rely on infiltration and evapotranspiration, their effectiveness will be impacted by such things as
soil type/conditions, what types of plants will grow, the amount of sunlight, rainfall patterns and
other meteorological and hydrological properties. Simulation results from Xiao et al. (2007)
found that the physical properties and effective depth of soil were particularly impactful on
infiltration and surface runoff processes. Brander et al. (2004, p.961), when talking about
infiltration basins in New York City, commented that site selection is "complicated by the need
for favorable underlying soils and sufficient depths to groundwater." For these reasons
professionals often require successful demonstration projects in their own community before they
17
could be obtained from pilot projects, is still lacking (Binstock, 2011). A study into the costs of
LID projects by the U.S. EPA (2007) found that site-specific factors influenced the outcomes.
CVC (2010) includes guidelines for LID design based on site-specific parameters.
Gilroy and McCuen (2009) developed a model in the Matlab language to simulate rainfall
and runoff processes from lot-sized microwatersheds and test various combinations of cisterns
and bioretention cells (LID measures). They found that the location of the cisterns and
bioretention cells was critical. They provided many suggestions based on their findings including
placing bioretention facilities in areas that drain impervious surfaces, for small more frequent
storms the bioretention pits and cisterns can be independent but they might need to be in series
for larger storms, peak discharge depends heavily on portions of the watershed not controlled by
the LID measures, and total runoff volumes and peak rates do not seem to depend on the spatial
separation of LID measures (Gilroy and McCuen, 2009, p.235). Rainfall patterns also impact the
effectiveness of LID solutions and the size designs which will need to be implemented (Gallo et
al., 2012; Jennings et al., 2012). Qin et al. (2013) modelled the effects rainfall patterns on LID
measures in an urbanizing catchment in Shenzhen, China using SWMM. Rainfall volume,
duration, and the time-to-peak ratio all impacted the performance of grassed swales, green roofs
and permeable pavement. For example swales performed best when the peak intensity was early
whereas permeable pavement performed best with a time-to-peak ratio of 0.5 and green roofs
performed best with an even slightly later peak.
2.2
Evaluation of Low Impact Development
2.2.1 LID Case Studies
2.2.1.1 Overview
This section describes some of the research done in monitoring and analysis on actual
LID projects. In order to get further information and summaries of results the Credit Valley
Conservation report (CVC, 2010) and the review paper done by Ahiablame et al. (2012) are both
18
Another way to find additional case studies would be to search for research regarding specific
LID solutions rather than the topic of LID itself. Summary tables of the results of reviewed
papers are provided in the following sections.
2.2.1.2 Hydrology
Some of the primary goals of LID are to reduce stormwater runoff, reduce peak flows and
to mimic pre-development hydrological conditions in watersheds. Debusk and Hunt (2011)
compared streamflow from three small, undeveloped watershed to bioretention outflow from four
cells, all in the Piedmont region of North Carolina. Their comparison showed very similar
patterns of flow rates and volumes between the shallow interflow-produced streamflow of natural
watersheds and the outflow from the bioretention cells. That result is significant because one of
the main principles of LID is mimicking natural hydrological patterns.
Another demonstration project in which the timing of flows were considered is in
Lynbrook Estate, Melbourne, and studied by Lloyd et al. (2002). The project incorporated 32
hectares consisting of 271 medium density allotments and parklands. Roof and road runoff
systems were collected by grassed and landscaped swales with underlying gravel filled trenches
with the system eventually feeding into wetlands. A paired catchment storm event monitoring
program was established in adjacent sub-catchments to compare the conventional (piped) and
LID (bio-filtration) systems. It was found that runoff from the LID catchment was between 51%
and 100% less than the conventional system, peak discharges from the LID system were
consistently lower, stormwater was delayed by an average of 10 minutes compared to the
conventional system, and the LID system consistently had a shorter duration stormwater
discharge (Lloyd et al., 2002, p.22).
For the case of Watford, Connecticut, previously discussed in section 1.1, a LID
subdivision was compared to the one with traditional stormwater management. The LID
measures included replacing asphalt roads and gutters with Ecostone® paver road (permeable) and
19
added, rain gardens were used, and houses were constructed in a clustered layout. Monitoring
and analysis of this site revealed that, due to the LID measures, the runoff did not increase even
as the impervious area increased from zero to 21% (Dietz and Clausen, 2008). Mayer et al.
(2012) ran an extensive six year before and after study (three years before, three after) of 1.8 km2
Shepherd Creek watershed near Cincinnati, Ohio. They monitored hydrological and ecological
indicators in the watershed in which they ran a program which saw the installation of 83 rain
gardens and 176 rain barrels onto what amounted to over 30% of the properties (the reverse
auction that was a component of this study was mentioned in section 2.1.3.1). They found the
LID measures had a "small but statistically significant effect of decreasing stormwater quantity at
the sub-watershed scale" (Mayer et al., 2012, p.65). This result assumes significance as most of
the studies conducted are on a smaller scale and the cumulative impacts of LID on a watershed
have not been as frequently evaluated. As a part of the same study Shuster and Rhea (2013) also
found that LID practices made a difference as the distributed stormwater controls added detention
capacity to the system. They also highlighted the importance of transportation surfaces as a focus
point to maximize the efficiency of further retrofits and that swales may be a good method for
said retrofit (Shuster et al., 2010; Shuster and Rhea, 2013).
Line et al. (2012) conducted a comparison between three commercial sites, one with no
stormwater control measures, one with a wet detention basin and one with LID measures
(including eight bioretention cells, 0.53 ha of pervious concrete and two constructed stormwater
wetlands) in the Piedmont and Coastal Plain regions of central North Carolina. The LID
measures throughout the whole site did have a positive impact; however, there were problems
with the LID stormwater controls. These included the lack of a drawdown orifice in the
stormwater wetland and undersized and clogged bioretention cells. These problems reduced the
ability of the LID measures to reduce runoff (Line et al., 2012). Bergman et al. (2010) evaluated
two infiltration trenches in Copenhagen over 15 years and observed a significant decrease in the