http://dx.doi.org/10.4236/jcc.2016.43014
Channel Error Estimation Methods
Comparison under Different Conditions
for Multichannel HRWS SAR Systems
Tingting Jin1,2, Xiaolan Qiu1, Donghui Hu1, Chibiao Ding1
1Institute of Electronics, Chinese Academy of Sciences, Beijing 100190, China 2University of Chinese Academy of Sciences, Beijing, 100190, China
Received 2 November 2015; accepted 26 February 2016; published 2 March 2016
Abstract
Multichannel synthetic aperture radar (SAR) in azimuth can resolve the contradiction between high resolution and wide swath faced with traditional SAR imaging. However, channel errors will degrade the performance of imaging. This paper compares the performances of four channel error estimation algorithms under different clutter distributions and SNR conditions. Further, explana-tions are given for performance differences of the four algorithms, which provide evidence for method selection in engineering applications.
Keywords
Synthetic Aperture Radar (SAR), High Resolution and Wide Swath (HRWS), Multi-Channel in Azimuth, Channel Error Estimation
1. Introduction
Conventional SAR system suffers from the limitation of achieving high resolution and wide swath (HRWS) si-multaneously [1]-[10]. Multichannel in azimuth HRWS SAR, combined with digital beam forming (DBF) tech-nique [2] [7], can effectively deal with this problem. Channel mismatch, caused by central electronic equipment, antenna array and satellite platform, and so on, will seriously affect the image quality in multichannel SAR sys-tems. So channel error estimation and compensation becomes very crucial [2].
applications.
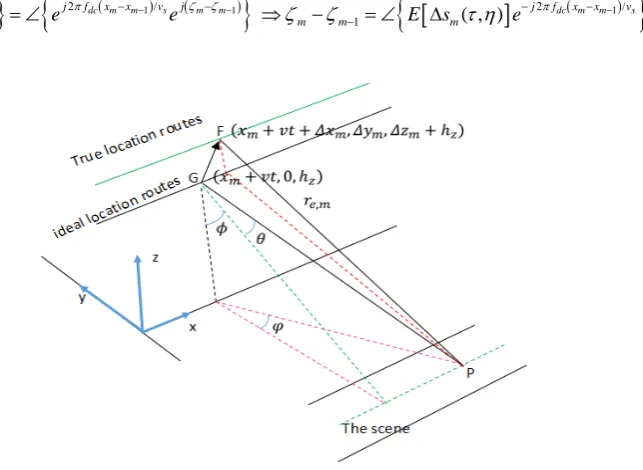
2. Echo Model
The geometric model of an actual multi-channel SAR system is shown in Figure 1. ∆xm, ∆ym and ∆zm
de-note the antenna position measurement error along X, Y, and Z axis, respectively.
Taking the channel errors caused by several factors into account [2], the total magnitude error and phase error of the mth channel can be denoted as Γc m, and ζm. Echo of the mth channel can be expressed as:
(
)
( ) ( )
(
) (
)
, , ,mexp(j ) ,
4 , ,
exp( ) dxdy
m m
c m r c m r
s
c r m
x x x
S f x y H f g
v
j f f R x y
c
η ζ σ η
π η
− − ∆
= Γ −
− +
⋅
∫∫
, (1)
where
(
)
(
)
2 2 2, ,
m m m s z
R x yη = x−x − ∆ −x vη +y +h . (2)
3. Error Estimation Methods
Since channel magnitude errors can be estimated and compensated by simple channel balancing [5], this paper mainly concerns channel phase error estimation methods.
3.1. Time-Domain Correlation Method (TDCM)
The TDCM is presented in [3]. This estimation algorithm is operated in time-domain. Firstly, the echoes re-ceived by adjacent channels are multiplied in time-domain to get the interferometry
( )
( )
*( )
* 1 ( 1)1 1
, , , , m , m j m m
m m m m m
s s
x x
s s s s s e
v v
ζ ζ
τ η τ η τ η τ η τ η − − −
− −
∆ = = + +
, (3)
where sm( , )τ η is the echo of the mth channel, and η denoted the slow-time.
From the principle of the average cross correlation method in the baseband Doppler centroid estimation, there is
( )
{
}
{
2 ( 1)/ ( 1)}
{
[
]
2 ( 1)/}
1
, j fdcxm xm vs j m m ( , ) j fdcxm xm vs
m m m m
E s τ η e π − − e ζ −ζ − ζ ζ − E s τ η e− π − −
[image:2.595.173.495.472.707.2]∠ ∆ = ∠ ⇒ − = ∠ ∆ , (4)
where fdc is the Doppler centroid.
Assume that the first channel is the reference channel, phase error of the mth channel is
(
1)
1 m
m i i
i
ζ ζ ζ−
=
=
∑
− . (5)3.2. Orthogonal Subspace Method (OSM)
The OSM is presented in [4]. This algorithm utilizes the orthogonality between the signal subspace and noise subspaces after eigenvalue decomposition, which is processed in Doppler domain.
Channel phase errors are estimated by minimize the cost function:
arg min ( a ) ( a )
a I
H H a i n n a i G i I
J G S S G
=−
=
∑
⋅ ⋅ , (6)where ai is the array steering vector, and Ga is a square matrix whose diagonal elements are phase errors in
exponential form. Sn corresponds to the noise subspace, whose column vectors are noise eigenvectors.
Let the first channel be the reference channel, and denote w=[1, 0..., 0]T. The estimation of phase errors can be expressed as
1 1 1 1 a T w G diag w w − ∧ −
Ω
=
Ω
, (7)
where. 1
(
(a ))
(a ) IH H
i n n i
i I
diag S S diag
=−
Ω =
∑
(8)3.3. Signal Subspace Comparison Method (SSCM)
The SSCM is expressed in [5]. This algorithm makes use of the fact that the space spanned by the signal sub-space eigenvectors is the same as the sub-space spanned by the array steering vector
( )
{
a a}
{
1, , N}
span G ⋅A f =span u u . (9)
Let U ={u , u ,... u }1 2 N (10)
According to the uniqueness of orthogonal projection operator, we can get
(
H)
1 H(
H H)
1 H HU U U − U =GA A G GA − A G . (11)
Let V =UUH, Q=G G G
(
H)
−1GH, then
1
( )
* 1
1 1 11 1 1 1
1
0 , m 1,..., M
m
j m
m mm m m m m
m
V
V G Q G V Q e
Q
ζ −ζ ζ ζ
− = − = ⇒ − = ∠ = . (12)
3.4. Antenna Pattern Method (APM)
The APM is expressed in [6]. This algorithm estimates the channel phase errors by combining with the antenna pattern.
Let B=Ga⋅A, C=BH. Ignoring the effect of noise, from the first column of the correlation matrix, there is
(
)
(
(
)
)
2 2 * 2
1 , 1 , 1 1 , 1
1 1 1
exp exp 2 1
2
N N N
m
m mn s n n mn s n n m s n n a p
n n n
x
r b c b b j c j f L n f
v
σ σ ζ ζ σ π
= = = ∆ = = = − + − + − •
∑
∑
∑
. (13)Then the relative phase error of the mth channel can be expressed by
(
)
(
)
1 1 2 , 1exp 2 1
2
m
m N
m
s n a p
n
r x
j f L n f
v ζ ζ σ π = − = ∠ ∆ + − + − •
∑
4. Performance Comparison and Analysis
In this section, experiment is done to compare the performance of the above mentioned four algorithms. The pa-rameters are listed in Table 1, where M is the number of channels, La is the antenna size in azimuth, λ is the
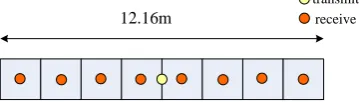
wavelength, PRFM is the pulse repetition frequency, and vs is the velocity of platform. Figure 2 shows a brief
illustration of transmitting and receiving of the SAR system.
To compare the four methods discussed above, we use two indexes: estimation deviation and the maximum azimuth ambiguity-to-signal ratio (AASRMAX). Estimation deviation means the bias between the real phase error and the estimated phase error. AASRK is the ratio of power of kth (k = 1 - 8) ambiguity component to power of the ambiguity free signal after phase error estimation and compensation [3], i.e.
10 log K K
P AASR
S
= ⋅ . (15)
Besides, AASRMAX is the maximum of AASRK (k = 1 - 8).
4.1. Estimation Performance Versus SNR
In this section, clutters are assumed to be Gaussian distribution, and SNR varies from 0 dB to 20 dB. The esti-mation deviations of eight channels are illustrated in Figure 3. The maximum estimation deviations and AASRMAX are listed in Table 2 for different SNR.
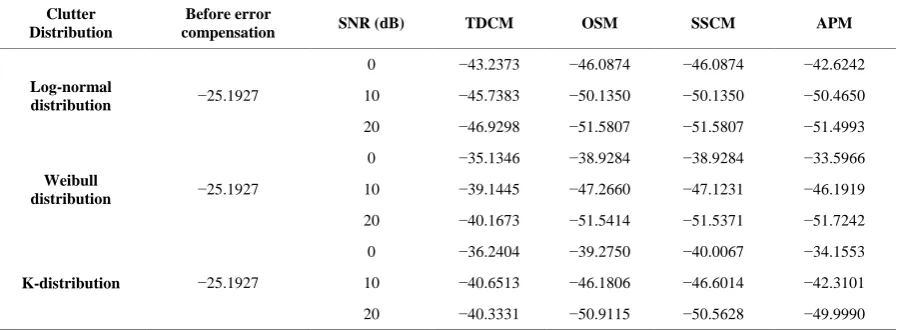
4.2. Performance Comparison under Different Clutter Distributions
In engineering application, clutter scenario does not obeyideal Gaussian distribution. Log-normal distribution, Weibull distribution and K-distribution are mainly considered as sea clutter model when HRWS SAR detects the seasurface.
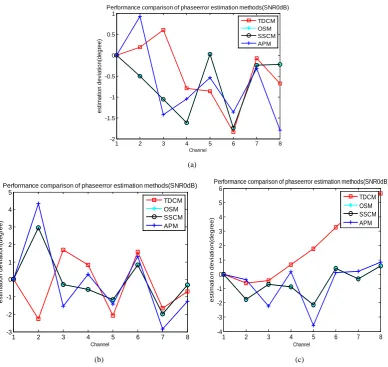
This section mainly compares the performance of the four algorithms when clutter obeys Log-normal distri-bution, Weibull distribution and K-distridistri-bution, respectively. The estimation deviations of eight channels under SNR = 0 dB are illustrated in Figure 4. The maximum estimation deviations and AASRMAX for different clutter distributions and different SNR are listed in Table 3 and Table 4, respectively.
4.3. Analysis of the Results
Without eigenvalue decomposition and matrix inversion, the computational load of TDCM is the lowest. How-ever, TDCM works worse than the other three algorithms under all simulated clutter distributions and SNR, for the deviation is cumulative when the phase error accumulates.
APM also does not need eigenvalue decomposition and matrix inversion, which is characterized by light computational load. But this method only applies to uniform distribution scenes. When the clutter obeys Weibull distribution and K-distribution, it works worse than OSM and SSCM under low SNR conditions (0 - 10 dB). While under high SNR conditions (>10 dB), the differences of APM, OSM, and SSCM are very small. The fre-quency spectrums of Weibull distribution and K-distribution are not quite homogeneous, so the performance of APM deteriorates when the noise is relatively large. For Gaussian distribution and Log-normal distribution clut-ters, the scenarios are homogeneous, so APM works as well as OSM and SSCM.
12.16m
[image:4.595.221.401.594.645.2]transmit receive
Figure 2. Illustration of transmitting and receiving of eight-channel SAR system.
Table 1. Parameters of multi-channel SAR system.
M La (m) λ (m) PRFM (Hz) vs (m/s)
[image:4.595.86.538.689.723.2]Table 2. Maximum estimation deviations and AASRMAX for four algorithms.
Performance indicator SNR (dB) TDCM OSM SSCM APM
Maximum estimation deviations (degree)
0 −4.5426 1.3959 1.3959 −2.0650
5 −4.2495 0.8181 0.8181 −0.9042
10 −4.0334 0.4654 0.4654 0.4852
20 −3.2007 −0.2280 −0.2280 −0.2215
AASRMAX (dB)
0 −38.0153 −42.6855 −42.6855 −39.9564
5 −37.3947 −45.9853 −46.3163 −44.2362
10 −38.2960 −49.5419 −49.5419 −50.0598
[image:5.595.87.538.272.427.2]20 −39.4288 −51.4076 −51.4076 −51.3883
Table 3. Maximum estimation deviations for four algorithms under three clutter distributions.
Clutter Distribution SNR(dB) TDCM OSM SSCM APM
Log-normal distribution
0 −1.8387 −1.7378 −1.7378 −1.7966
10 −1.1058 −0.5793 −0.5793 −0.5430
20 −0.8439 −0.2104 −0.2104 −0.1943
Weibull distribution
0 −2.2719 2.9642 2.9642 4.3430
10 3.3355 0.8791 0.8791 1.0050
20 4.2251 0.2599 0.2599 0.2721
K-distribution
0 5.6282 −2.1395 −2.1395 −3.5778
10 4.7262 −0.7711 −0.7711 −0.8575
20 3.9462 −0.2767 −0.2767 −0.2820
Table 4. AASRMAX for four algorithms under three clutter distributions.
Clutter Distribution
Before error
compensation SNR (dB) TDCM OSM SSCM APM
Log-normal
distribution −25.1927
0 −43.2373 −46.0874 −46.0874 −42.6242
10 −45.7383 −50.1350 −50.1350 −50.4650
20 −46.9298 −51.5807 −51.5807 −51.4993
Weibull
distribution −25.1927
0 −35.1346 −38.9284 −38.9284 −33.5966
10 −39.1445 −47.2660 −47.1231 −46.1919
20 −40.1673 −51.5414 −51.5371 −51.7242
K-distribution −25.1927
0 −36.2404 −39.2750 −40.0067 −34.1553
10 −40.6513 −46.1806 −46.6014 −42.3101
20 −40.3331 −50.9115 −50.5628 −49.9990
The OSM and SSCM use the signal subspace and noise subspaces after eigenvalue decomposition of the cor-relation matrix, respectively. Assuming L Doppler bins are used to estimate the phase errors, the computational load of OSM and SSCM are 2 LM3 and LM3 + M3, respectively. Their performances are best under all simulated clutter distribution and SNR conditions.
[image:5.595.89.538.458.623.2](a) (b)
Figure 3. Estimation deviations of eight channels versus SNR for the time-domain correlation method (dashed
red), the orthogonal subspace method (dashed green), the signal subspace comparison method (dashed black), the antenna pattern method (dashed blue). SNR = 0 dB corresponds to Figure 3(a), and SNR = 10 dB corres-ponds to Figure 3(b).
(a)
[image:6.595.120.509.317.684.2](b) (c)
Figure 4. Estimation deviations of eight channels under SNR = 0 dB. Log-normal distribution clutter
corres-ponds to Figure 4(a), Weibull distribution clutter corresponds to Figure 4(b), and K-distribution clutter cor-responds to Figure 4(c).
1 2 3 4 5 6 7 8
-5 -4 -3 -2 -1 0 1 2
Performance comparison of phaseerror estimation methods(SNR0dB)
Channel es ti m at ion dev iat ion( degr ee) TDCM OSM SSCM APM
1 2 3 4 5 6 7 8
-4.5 -4 -3.5 -3 -2.5 -2 -1.5 -1 -0.5 0 0.5
Performance comparison of phaseerror estimation methods(SNR10dB)
Channel es ti m at ion dev iat ion( degr ee) TDCM OSM SSCM APM
1 2 3 4 5 6 7 8
-2 -1.5 -1 -0.5 0 0.5 1
Performance comparison of phaseerror estimation methods(SNR0dB)
Channel es ti m at ion dev iat ion( degr ee) TDCM OSM SSCM APM
1 2 3 4 5 6 7 8
-3 -2 -1 0 1 2 3 4 5
Performance comparison of phaseerror estimation methods(SNR0dB)
Channel es ti m at ion dev iat ion( degr ee) TDCM OSM SSCM APM
1 2 3 4 5 6 7 8
-4 -3 -2 -1 0 1 2 3 4 5 6
Performance comparison of phaseerror estimation methods(SNR0dB)
5. Conclusion
In this paper, four channel error estimation methods for multichannel HRWS SAR system are compared under different SNR conditions and clutter distributions. From the simulation results, we can conclude that the estima-tion deviaestima-tions are not relevant to real phase error distribuestima-tion, and only relate to SNR and the clutter distribu-tion. In addition, the performance of time-domain correlation method is poorer than the other three methods. For Doppler-domain methods, the APM works as well as the OSM and SSCM for homogeneous clutter scenes, but worse than OSM and SSCM for heterogeneous surfaces. OSM and SSCM work best for all clutter scenes.
References
[1] Gebert, N., Krieger, G. and Moreira, A. (2009) Digital Beamforming on Receive: Techniques and Optimization Strate-gies for High-Resolution Wide-Swath SAR Imaging. IEEE Transactions on Geoscience and Remote Sensing, 45, 564- 592.
[2] Zhang, S.X., Xing, M.D., Xia, X.G., Liu, Y.Y., Guo, R. and Bao, Z. (2013) A Robust Channel-Calibration Algorithm for Multi-Channel in Azimuth HRWS SAR Imaging Based on Local Maximum-Likelihood Weighted Minimum En-tropy. IEEE Transactions on Image Processing, 22, 5294-5305. http://dx.doi.org/10.1109/TIP.2013.2274387
[3] Liu, Y.Y., Li, Z.F., Suo, Z.Y. and Bao, Z. (2013) A Novel Channel Phase Bias Estimation Method for Spaceborne Along-Track Multi-Channel HRWS SAR in Time-Domain. IET International Radar Conference, China.
[4] Liu, Y.Y., Li, Z.F., Suo, Z.Y. and Bao, Z. (2010) Adaptive Two-Step Calibration for High Resolution and Wide-Swath SAR Imaging. IET Radar Sonar Navigation, 4, 548-559.
[5] Yang, T.L., Li, Z.F., Liu, Y.Y. and Bao, Z. (2013) Channel Error Estimation Methods for Multichannel SAR Systems in Azimuth. IEEE International Geoscience and Remote Sensing letters, 10, 548-552.
http://dx.doi.org/10.1109/LGRS.2012.2212873
[6] Yang, T.L., Li, Z.F., Liu, Y.Y., Suo, Z.Y. and Bao, Z. (2013) Channel Error Estimation Methods for Multi-Channel HRWS SAR Systems. IEEE International Geoscience and Remote Sensing Symposium, Australia, 4507-4510.
[7] Kim, J.-H., Younis, M., Prats-Iraola, P., Gabele, M. and Krieger, G. (2013) First Spaceborne Demonstration of Digital Beamforming for Azimuth Ambiguity Suppression. IEEE Transactions on Image Processing, 55, 579-590.
http://dx.doi.org/10.1109/tgrs.2012.2201947
[8] Gebert, N., de Almeida, F.Q. and Krieger, G. (2011) Airborne Demonstration of Multichannel SAR Imaging. IEEE Geoscience and Remote Sensing Letters, 8, 963-967. http://dx.doi.org/10.1109/LGRS.2011.2144563
[9] Zhang, S.X., Xing, M.D., Xia, X.G., Zhang, L., Guo, R., Liao, Y. and Bao, Z. (2014) Multichannel HRWS SAR Im-aging Based on Range-Variant Channel Calibration and Multi-Doppler-Direction Restriction Ambiguity Suppression. IEEE Transactions on Geoscience and Remote Sensing, 52, 4306-4327. http://dx.doi.org/10.1109/TGRS.2013.2281329