International Journal of Emerging Technology and Advanced Engineering
Website: www.ijetae.com (ISSN 2250-2459, ISO 9001:2008 Certified Journal, Volume 9, Issue 4, April 2019)
142
Seperation of Binary Solid Mixtures by Fluidization
A. Suryanarayana
1, B. Srinivasulu
2, A.V. Naidu
3, G. Sujeet Kumar
4, G. Manikanta
5, S. Pullaiah
6, M. Prabhakar
7Dept. of Chemical Engg., RRS College of Engg. & Tech., Muthangi (V), Patancheru (M), Hyderabad, Telangana State, India
Abstract--Fluidization is an operation by which the granular solids are transformed into a fluid like state through contact with a fluid. When a liquid or gas is passed at a very low velocity through a bed of solid particles, the particles do not move, and the pressure drop is given by the Ergun equation. If the fluid velocity is steadily increased, the pressure drop and the drag on individual particle increase and the particles start to move and become suspended in the fluid.
Separation of mixtures of solids is done by: 1-screening, 2-Froth flotation, 3-Jigging, 4-wilfley table, 5-cyclone separator etc. In this work, Fluidization is tried to separate the solid mixtures of different sizes and densities. There is not much literature on this separation process.
Equations are formulated to calculate the separation amount based on dimensional analysis and experiments. The error in using these equations is less than 15%. This work is useful to separate large amounts of solid mixtures in industries and in business houses using cylindrical columns.
I. INTRODUCTION
Fluidization is an operation by which free granular solids are transformed into a fluid like state through contact with a fluid. If the fluid velocity is steadily increased, the pressure drop and drag on individual particle increased and eventually the particles start to move and become suspended in the fluid.
The chief advantages of Fluidization are that it ensures contact of the fluid with all parts of the solid particles, prevents segregation of the particles by thoroughly agitating the bed, minimizing the temperature variations even in a large reactors and ensures high heat and mass transfer rates. Fluidization finds applications in catalytic cracking reactors in the petroleum industry, drying and sizing of crystals, transporting solids, coating metal surfaces with plastic materials, in roasting ores and synthesis reactions.
The disadvantages of fluidization are: greater power requirements, high leakage of solid particles, serious erosion of pipe lines and containers and the need for bigger reactors. In this work, fluidization is tried to separate the binary solid mixtures. Equations are developed based on dimensional analysis and various variables involved in the operation.
II. FORMULATION OF EQUATIONS:
The various variables involved are: 1-size of the small size particles(ds),2-size of the big size particle (db ),3-density of small size particles(ss),4-density of big size particle(sb),5-minimum fluidization velociy(Gmf ),6-operating fluidization velocity(G),7-total height of bed(ht) and 8-diameter of the column (Dc).hs is the height of small size particles(1,2,3,4,5).
hs=f (ht , ds, db, Gmf, G, ss, sb, Dc )---(1)
Applying Rayleigh‟s method of dimensional analysis, equation(1) can be written as:
hs = k ht a
ds b
db c
, Gmf d
,G e
ss f
, sb g
, Dc h
---(2)
Putting dimensions on both sides (L, M, and T), equating the dimensions and collecting powers gives,
hs/Dc=k1 [(ht /Dc)a (ds/Dc)b (db/Dc)c (Gmf/G)e (sb/ss)g]m ----(3)
The values of k1, a, b, c, e, g, and m are found by conducting the experiments.
Using the same equations (1) and (2) and applying Rayleigh‟s method using dimensional analysis, another form of equation obtained is:
hs/ht = k2 [(ds/ht)b (db/ ht)c (Dc/ht)h (Gmf/G)e (sb/ss)g]n ---(4)
The values of b, c, d, e, g, n, and k2 are obtained by the experiments.
III. EXPERIMENTATION
The Experimental set up consists of 1-Air blower, 2 – heating arrangement (not used), 3 –orfice meter (for flow rate of air measurement), 4 – U – tube manometer (for air flow measurement), 5 – switch board and indicators (temperatures, voltage, current),6-flow control valve(for air), 7 – fluidization column, 8 – screen to hold solids in the column.
International Journal of Emerging Technology and Advanced Engineering
Website: www.ijetae.com (ISSN 2250-2459, ISO 9001:2008 Certified Journal, Volume 9, Issue 4, April 2019)
143
The observations of the left side, hs/Dc are noted. Plotting log values of hs/Dcand ht/Dc gives the value(a) as a slope (Straight line relation). This procedure is repeated for b, c, e, g values. Lastly the values of k1 and m are obtained by experiments(6).IV. RESULTS AND DISCUSSION
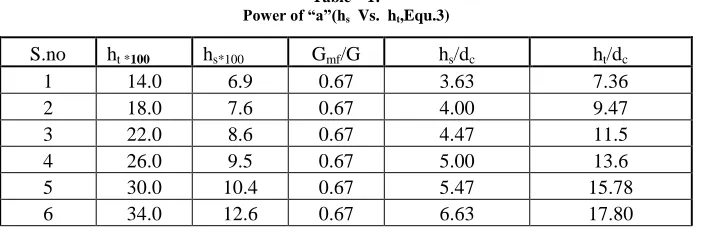
For Equation 3:The observations for power of „a‟ are shown in the table-1. The observations for power of „c‟ are shown in the table-2. The observations for power of „b‟ are shown in the table-3.
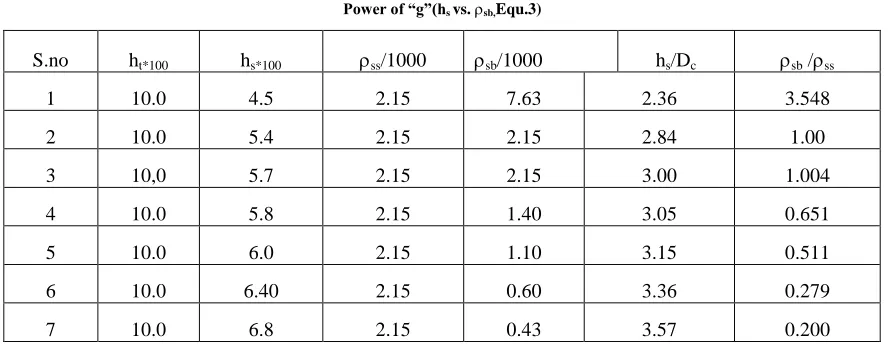
[image:2.612.133.484.294.410.2]The observations for power of „e‟ are shown in the table-4. The observations for power of „g‟ are shown in the table-5. The observations for power of „k1‟ and „m‟ are shown in the table-6. Finally the comparison of equation
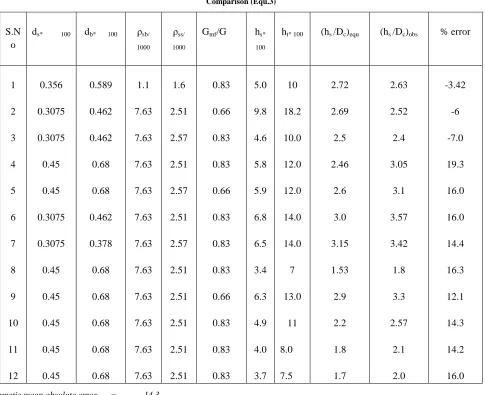
values and observed values of h s/D c are shown in table – 7.
The values obtained for equation 3 are: a=1.07,b=-0.35,c=-0.30,e=-0.43,g=0.08,k1=0.07 and m=0.93.
The final correlated equation is (for equation 3):
hs/Dc=0.07 (ht /Dc)0.995 (ds/Dc)-0.325 (db/Dc)-0.279 (Gmf/G)-0.399 (sb/ss)
0.074 ---(5)
Table – 1: Power of “a”(hs Vs. ht,Equ.3)
S.no ht *100 hs*100 Gmf/G hs/dc ht/dc
1 14.0 6.9 0.67 3.63 7.36
2 18.0 7.6 0.67 4.00 9.47
3 22.0 8.6 0.67 4.47 11.5
4 26.0 9.5 0.67 5.00 13.6
5 30.0 10.4 0.67 5.47 15.78
6 34.0 12.6 0.67 6.63 17.80
Dc=0.019,ds=0.00068,db=0.001107, ρss =1600,ρsb=1600,Material:Sand,a=0.567
Table – 2: Power of “c”(hs Vs.db,Equ.3)
S.no ht*100 hs*100 db*100 Gmf/G hs/dc
1 8.0 3.0 0.356 0.67 1.57
2 8.0 3.5 0.21 0.67 1.84
3 8.0 4.0 0.1107 0.67 2.10
4 8.0 4.3 0.068 0.67 2.31
5 8.0 4.7 0.045 0.67 2.48
6 8.0 4.9 0.039 0.67 2.57
Dc=0.0190, ds=0.00032, ρss=1600, ρsb=1600,Material:Sand,c=-0.2457
Table – 3: Power of “b”(hsVs. Dc,Equ.3)
S.no ht*100 hs*100 ds*100 Gmf/G
1 8.0 4.0 0.21 0.67
2 8.0 4.4 0.1107 0.67
3 8.0 4.8 0.068 0.67
4 8.0 5.0 0.045 0.67
5 8.0 5.3 0.039 0.67
6 8.0 5.5 0.032 0.67
International Journal of Emerging Technology and Advanced Engineering
Website: www.ijetae.com (ISSN 2250-2459, ISO 9001:2008 Certified Journal, Volume 9, Issue 4, April 2019)
143
Table – 4:Power of “e”(hsVs.Gmf/G,Equ.3)
S.no ht*100 hs*100 Gmf/G hs/dc
1 8.0 3.5 0.67 1.84
2 8.0 3.7 0.50 2.10
3 8.0 3.8 0.4 2.00
4 8.0 4.1 0.33 2.15
5 8.0 4.3 0.28 2.26
6 8.0 4.5 0.25 2.31
Dc=0.0190, ds = 0.00378, db= 0.00462, ss =7630, sb=7630,Material:Sand, e=-0.238
Table – 5: Power of “g”(hs vs.sb,Equ.3)
S.no ht*100 hs*100 ss/1000 sb/1000 hs/Dc sb /ss
1 10.0 4.5 2.15 7.63 2.36 3.548
2 10.0 5.4 2.15 2.15 2.84 1.00
3 10,0 5.7 2.15 2.15 3.00 1.004
4 10.0 5.8 2.15 1.40 3.05 0.651
5 10.0 6.0 2.15 1.10 3.15 0.511
6 10.0 6.40 2.15 0.60 3.36 0.279
7 10.0 6.8 2.15 0.43 3.57 0.200
Dc=0.0190, Gmf/G = 0.67, db= 0.0021,ds=0.00112,Materials:Steel,dolamite,Bengal gram, Berry seeds, sodium chloride; g=-0.141.
Table – 6: k1 and m values(Equ.3)
S no hs/Dc [(ht /Dc)a (ds/Dc)b (db/Dc)c (Gmf/G)e (sb/ss)g ]
1 2.08 4.46
2 2.68 5.00
3 3.38 5.75
4 3.54 6.02
5 3.71 6.76
6 1.90 3.68
7 3.80 7.58
8 3.89 7.94
9 4.07 8.10
10 4.26 8.40
11 4.46 8.59
12 4.57 8.99
[image:3.612.85.529.293.465.2]International Journal of Emerging Technology and Advanced Engineering
Website: www.ijetae.com (ISSN 2250-2459, ISO 9001:2008 Certified Journal, Volume 9, Issue 4, April 2019)
144
Table – 7: Comparison (Equ.3)S.N o
ds* 100 db* 100 ρsb/
1000
ρss/
1000
Gmf/G hs*
100
ht* 100 (hs /Dc)equ (hs /Dc)obs % error
1 2 3 4 5 6 7 8 9 10 11 12 0.356 0.3075 0.3075 0.45 0.45 0.3075 0.3075 0.45 0.45 0.45 0.45 0.45 0.589 0.462 0.462 0.68 0.68 0.462 0.378 0.68 0.68 0.68 0.68 0.68 1.1 7.63 7.63 7.63 7.63 7.63 7.63 7.63 7.63 7.63 7.63 7.63 1.6 2.51 2.57 2.51 2.57 2.51 2.57 2.51 2.51 2.51 2.51 2.51 0.83 0.66 0.83 0.83 0.66 0.83 0.83 0.83 0.66 0.83 0.83 0.83 5.0 9.8 4.6 5.8 5.9 6.8 6.5 3.4 6.3 4.9 4.0 3.7 10 18.2 10.0 12.0 12.0 14.0 14.0 7 13.0 11 8.0 7.5 2.72 2.69 2.5 2.46 2.6 3.0 3.15 1.53 2.9 2.2 1.8 1.7 2.63 2.52 2.4 3.05 3.1 3.57 3.42 1.8 3.3 2.57 2.1 2.0 -3.42 -6 -7.0 19.3 16.0 16.0 14.4 16.3 12.1 14.3 14.2 16.0
Arithmetic mean absolute error = 14.3
For Equation 4: The observations for power of “b”are shown in the table-8. The observations for power of “c”are shown in tabe-9. The observations for power of “e” are shown in tabe-10.
[image:4.612.65.550.149.544.2]International Journal of Emerging Technology and Advanced Engineering
Website: www.ijetae.com (ISSN 2250-2459, ISO 9001:2008 Certified Journal, Volume 9, Issue 4, April 2019)
143
Table – 8: Power of “b”(hs vs.ds,Equ.4)S. NO hs*100 ht*100 ds*100
1 6.0 10.5 0.613
2 5.5 10.5 0.462
3 4.0 10.5 0.378
4 3.5 10.5 0.290
Dc=0.0190,db= 0.00774,Gmf/G = 0.67,sb =7813,ss=7813,b=-0.75,Material:Steel
Table – 9: Power of “c”(hs vs.db,Equ.4)
S no hs*100 ht*100 db*100
1 5.2 10.5 0.774
2 6.0 10.5 0.613
3 6.5 10.5 0.460
4 6.7 10.5 0.370
5 7.3 10.5 0.290
Dc=0.0190, ds =0.0027,Gmf/G =0.67, sb =7813,ss=7813,Material:Steel,c=0.32
Table – 10:
Power of “e”(hs vs.Gmf/G,Equ.4)
S no hs*100 ht*100 Gmf*100 G*100 Gmf/G
1 11.5 25.0 2.9 4.35 0.66
2 11.9 25.0 2.9 5.80 0.50
3 12.3 25.0 2.9 7.25 0.40
4 12.5 25.0 2.9 8.70 0.33
5 12.7 25.0 2.9 10.10 0.28
6 12.9 25.0 2.9 12.0 0.25
Dc=0.0190,ds =0.0057,db= 0.0084,sb=1050,ss=1050,Material:Berry seeds, e=0.116
Table – 11: Power of “h”(hs vs.Dc,Equ.4)
S NO hs*100 ht*100 Dc*100
1 6.8 10.5 1.0
2 5.9 10.5 1.5
3 4.9 10.5 1.9
4 4.2 10.5 2.5
International Journal of Emerging Technology and Advanced Engineering
Website: www.ijetae.com (ISSN 2250-2459, ISO 9001:2008 Certified Journal, Volume 9, Issue 4, April 2019)
144
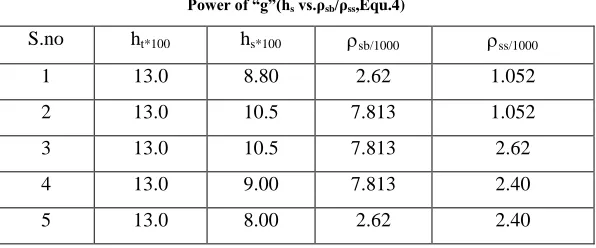
Table – 12: Power of “g”(hs vs.ρsb/ρss,Equ.4)S.no ht*100 hs*100 sb/1000 ss/1000
1 13.0 8.80 2.62 1.052
2 13.0 10.5 7.813 1.052
3 13.0 10.5 7.813 2.62
4 13.0 9.00 7.813 2.40
5 13.0 8.00 2.62 2.40
Dc=0.025, ds = 0.0030, db=0.00775, Gmf/G=0.67,g=0.14
Table – 13:
Power of k2 and n values(Equ.4)
S NO ds/ht db/ht Dc/ht Gmf/G sb/ss hs/ht
1 0.031 0.073 0.20 0.44 3.26 0.52
2 0.038 0.070 0.21 0.33 3.00 0.20
3 0.043 0.046 0.19 0.26 7.40 0.65
4 0.050 0.100 0.41 0.22 2.80 0.41
5 0.060 0.050 0.16 0.18 1.13 0.66
6 0.020 0.035 0.19 0.16 1.08 0.57
7 0.060 0.110 0.50 0.14 1.12 0.40
8 0.031 0.068 0.22 0.13 2.47 0.272
9 0.018 0.031 0.11 0.12 2.50 0.18
10 0.035 0.098 0.22 0.11 2.28 0.23
[image:6.612.158.456.148.272.2]International Journal of Emerging Technology and Advanced Engineering
Website: www.ijetae.com (ISSN 2250-2459, ISO 9001:2008 Certified Journal, Volume 9, Issue 4, April 2019)
[image:7.612.60.549.159.347.2]145
Table – 14: Comparison(Equ.4)S no hs/ht (Equ) hs/ht obs % Error 100x{(obs-Equ)/obs}
1 0.91 0.76 18.7
2 0.36 0.43 16.3
3 0.32 0.40 20.0
4 0.48 0.45 6.7
5 0.63 0.66 4.5
6 0.26 0.30 13.0
7 0.36 0.38 5.0
8 0.36 0.33 6.5
9 0.37 0.33 11.0
10 0.31 0.37 16.0
Arithmetic absolute Mean Error= 11.8
The values obtained for equation (4) are: b=-0.75, c=0.32, h=0.77, e=0.116, g=0.14, k2=0.205 and n=1.08.
The final form of equation (4) is:
hs/ht =0.205 (ds/ht)0.81 (db/ ht)0.346 (Dc/ht)0.832 (Gmf/G)0.125 (sb/ss)0.151---(6)
The comparison of experimental values and equation values for hs / Dc and hs / ht are shown in Figures 1 and 2. The absolute arithmetic mean error for hs / Dc and hs / ht are 14.3% and 11.8 % respectively.
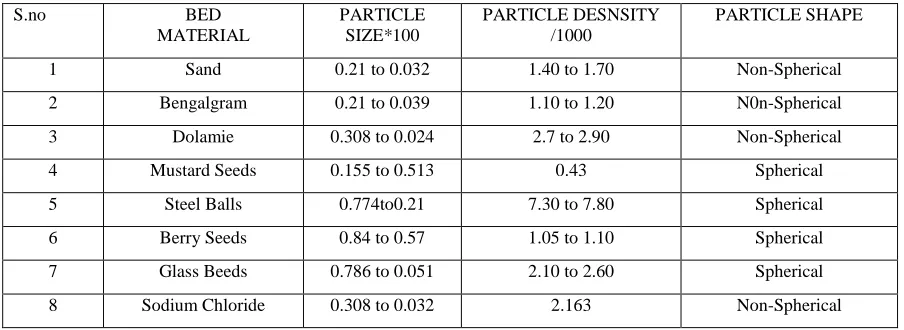
The scope of experiments is shown in Tabe-15.
Table – 15: SCOPE OF EXPERIMENTS
S.no BED
MATERIAL
PARTICLE SIZE*100
PARTICLE DESNSITY /1000
PARTICLE SHAPE
1 Sand 0.21 to 0.032 1.40 to 1.70 Non-Spherical
2 Bengalgram 0.21 to 0.039 1.10 to 1.20 N0n-Spherical
3 Dolamie 0.308 to 0.024 2.7 to 2.90 Non-Spherical
4 Mustard Seeds 0.155 to 0.513 0.43 Spherical
5 Steel Balls 0.774to0.21 7.30 to 7.80 Spherical
6 Berry Seeds 0.84 to 0.57 1.05 to 1.10 Spherical
7 Glass Beeds 0.786 to 0.051 2.10 to 2.60 Spherical
8 Sodium Chloride 0.308 to 0.032 2.163 Non-Spherical
[image:7.612.81.533.446.611.2]International Journal of Emerging Technology and Advanced Engineering
Website: www.ijetae.com (ISSN 2250-2459, ISO 9001:2008 Certified Journal, Volume 9, Issue 4, April 2019)
143
V. CONCLUSIONS
It looks that it is possible to utilize fluidization operation for separating solid mixtures to some extent. Equations are formulated to predict the heights of small solids and big solids in a cylindrical column after fluidization for a binary mixture of solids .This work can be extended to multi component solid mixtures and other conduits.
Nomenclature:
a,b,c,d,e,f,g,h,k,k1.k2,m,n = Constants Dc = Diameter of the Column, m ds = Diameter of small solids, m db = Diameter of big solids, m
hs = Height of small diameter solids, m hb = Height of big diameter solids, m ht = Height of total bed of solids, m Gmf = Minimum Fluidization velocity,
Kg/(m2.sec)(proportional to level difference in manometer) G = Operating Fluid velocity, Kg/(m2.sec)(proportional to level difference in manometer)
ss = Density of small solids, Kg/Cub.m.
sb = Density of big solids, Kg/Cub.m.
ss/sb, hs/dc, ds/Dc, ht/dc, db/Dc, Gmf/G=dimensionless X (in Equ 3) = (ht /Dc)a (ds/Dc)b (db/Dc)c (Gmf/G)e (sb/ss)g X (in Equ 4) = (ds/ht)b (db/ ht)c (Dc/ht)h (Gmf/G)e (sb/ss)g
REFERENCES
[1] Rowe,P.N.,Nienow,A.W. and Agbim,A.J., “A preliminary quantitative studyof particles segregation in gas fluidized beds of binary systems of near spherical particles, Trans.inst. Of chemical Engineer. 50,324(1972).
[2] Chen, J.L., and Keairns, D.L., “Particle segregation in a fluidized bed”, the Canadian Journal of Chemical Engineer, 53,395-402 (1975).
[3] Vaid, R.P. and Sen Gupta ,P., “Minimum fluidisation velocities in beds of mixed solids”, The Canadian Journal of Chemical Engineering, 56,292-296 (1978).
[4] Nienow, A.W. and Chiba, T., “Fluidization of dissimilar solids”, J.F.London, UK, P357-382 (1985).
[5] Song,N.,Chen Chung Kuo and May Yann Chen ,”Minimum fluidization velocity of binary mixtures”,Canadian Jurnal of Chemical Engineering,67,4(1989).