ANALYSIS OF EFFECT OF SUB COOLING PERFORMANCE
OF VAPOUR COMPRESSION REFRIGERATION SYSTEM
WITH COOLING LOAD VARIATION
Prayudi and Roswati Nurhasanah
Mechanical Engineering College of Engineering Technology - PLN Menara PLN Jl Lingkar Luar Barat Duri Kosambi Cengkareng Jakarta Barat Indonesia
E-Mail: [email protected]
ABSTRACT
One method to improve the performance of vapor compression refrigeration system using subcooling and environmentally friendly refrigerant. Hydrocarbon refrigerant is one of the environmentally friendly refrigerants that are proven to improve the performance of vapor compression system without sub-cooling. To that end, this for study aimed to analyze the effect is liquid-suction sub cooller and cooling load on the performance of the vapor compression refrigeration. Refrigerant R134a and R600a are used, the cooling load variations using lamps. Sub-cooling heat exchanger mounted between condenser and expansion. Variations in the mass amount of refrigerant through the sub-cooling is used the valve. The greater the sub-cooling temperature, the greater the temperature drop in the evaporator, and the cooling effect increases, and the cooling effect with refrigerant R600a is greater than R134a. The increase in compressor work is not affected by the magnitude of the cooling load, but is influenced by the amount of capacity sub-cooling. The greater the sub-cooling and cooling load, the greater the increase in compressor work. Use of sub-cooling effect COP increase and the increase COP R600a is greater than the COP R134a. Broadly speaking that R600a can be used as a substitute refrigerant R134a.
Keywords: liquid-suction subcooling, R134a, R600a and hydrocarbon refrigerant.
INTRODUCTION
Cooling machine is a device used to transfer heat from indoors to outdoors. In the vapor compression cycle, there are two cycles that occur, i.e. the ideal cycle and the actual cycle. In the ideal cycle all processes are considered capable of good and no harm. However, such a process cannot be executed, because in reality there are some irregularities such as the presence of both the pressure drop in the pipe and evaporator superheat which occurred in the compressor suction line and sub-cooling at the condenser outlet. In simple vapor compression cycle refrigerant phase out the condenser is saturated liquid [6]. To improve system performance, phase refrigerant is cooled further to become subcool phase. Zubair et al [1], there are three methods sub-cooling i.e. namely liquid-suction, dedicated and integrated subcool. Wood and Meyer [1] to reported the results of his research that the use of sub-cooler on the air conditioning and refrigerator can improve the performance of refrigeration systems up to 7.5%. Sukamto et al [1] in his research report that the use of liquid-suction subcooler on cooling machine using the working fluid R-22 can increase the coeffisients of performance (COP) to a variety of environmental temperature.
So that, Poltker and Predrag [2] and Boloji et al [8], in the research to reported that a theoretical and experimental study about the effect of condenser subcooling on the performance of vapor compression systems has been presented probably for the first time in
the open literature, to the best of the authors’ knowledge. This study showed that, as condenser subcooling increases, the COP undergoes a maximum as a result of a trade-off between increasing refrigerating effect, due to the reduction of the condenser exit temperature, and increasing specific compression work, due to the increase in the condensing pressure. The increase in condensing pressure was associated with the reduction of the air-refrigerant temperature difference and the air-refrigerant-side heat transfer coefficient once the two-phase region in the condenser is shrunken to accommodate the subcooled liquid region.
Research to find a replacement refrigerant R134a have been carried out by several previous researchers. Thangavel et al [3], Wongwices et al [7] to study also reported that a simulation analysis was performed theoretically for different refrigerant mixtures for vapour compression refrigeration system and from the analysis it is concluded that, In domestic refrigerators and industrial refrigeration systems, the mixture of R290 and R600a can be used as alternate refrigerant instead of R12 and R134a. R290 and R600a offer many desirable characteristics such as low operating pressure, mass flow rate and discharge temperature. The COP of these mixtures is close to the conventional refrigerants. [6].
is used for the performance analysis of alternative new refrigerants substitute (R152a, R170, R32, R32, R290, R600a, R1270) for R134a. Considering the comparison COP and pressure ratio of the tested refrigerants and also the main environmental impacts of ozone layer depletion and global warming, refrigerant R170 was found to be the most suitable alternative among refrigerants tested for R134a. COP of the system, increases with increase in evaporating temperature for a constant condensing temperature in the analysis.
Based on the above literature review, the study was conducted to determine the performance analysis thermodynamic vapour compression refrigeration using liquid-suction with subcooler with load variations and refrigerant R134a and R600a. Cooling load variations do that vapour compression refrigeration system is usually cooling load not constant.
CYCLE ANALYSIS WITH LIQUID-SUCTION SUB-COOLER
Basically there are three methods of subcooling in vapor compression refrigeration system, i.e. liquid-suction (Figure-1), dedicated and integrated. Liquid-suction subcooler is using a heat exchanger, the heat exchange of the liquid line (output condenser) to suction (compressor inlet). Dedicated subcooling is to use a separate refrigeration system with the main system. The additional refrigeration system capacity is much smaller than the primary refrigeration system, and function just lower the output temperature of the condenser. While integrated subcooling is using two refrigeration machines but only with a single condenser. Liquid-suction subcooling typically used on systems with small to medium capacity, while a dedicated and integrated subcooling applied to systems with moderate-to-large capacity [1]
Figure-1. Schematic subcooling liquid-suction subcooler.
From the scheme in Figure-1, Figure-2 illustrates a schematic diagram of the cycle refrigeration system with and without subcooling in the diagram T-h.
Referring to Figure-2, the percentage decline in the evaporator temperature (% T-evap) with liquid-suction subcooler cycle, use the formula,
% 100 T
T T %
ideal sub ideal x
Tevap
(1)
Based on Figure-2, COP cycle with subcooling (COP‘) is [2], [5]:
1 2
4 1 '
1 '
h h
h h w
w q
q COP COP
(2)
1 2
4 1
h h
h h w q COP
(3)
where q is refrigeration effect, w is work compressor, and h is enthalpy, Furthermore, the increase due to the use of subcooling refrigerasi effects (% Qe) refer to Figure-2, on the refrigeration system is expressed by the equation.
% 100 Q
Q Q Q %
ideal ideal sub
e x (4)
Figure-2. Schematic of cycles with and without
subcooling in a T-h diagram. [2]
In addition, the use of subcooling can also improve the working compressor. Referring to Figure-2 increased work the compressor (% W) is expressed by the equation [2], [5],
% 100 W
W W W %
ideal ideal sub x
(5)
increased cooling capacity and compressor work. When the quantity of capacity increase is greater than the increase in compressor work, there will be an increase in COP. Referring to Figure-2, an increase in COP (% COP) due to the use of subcooler is expressed by the equation, [1].
% 100 COP
COP COP
COP %
ideal ideal sub x
(6)
METHODOLOGY
With the approach of liquid-suction method subcooler Figure-1, Shell and Tube Heat Exchanger (HE) sub-cooler and test tool for the study are shown in Figure-3 below.
Figure-3. Shell and tube HE-subcooler.
Performance analysis of boundary conditions with the engine coolant liquid-suction method used compressor hermetic piston 220-240 Volt 50 hz FLA 123, condenser shell and coils air cooled condenser 230 v-50 Hz 0,62 A 90/25 W 1300/s, evaporator maximum pressure 21 bar, refrigerant used R-600a substitution R-134a. Three variations of subcooling are done by opening the valve. Load variations of lamps used 15 watt, 25 watt, 40 watt, 50 watt, 60 watt dan 80 watt. Setting time by taking the data 20 minutes after the engine is turned on.
RESULTS AND DISCUSSIONS
Effect on Evaporator Temperature
With refrigerant R134a, the evaporator temperature the actual cycle between 11,7 0C -13.4 0C, and
cycle with subcooling ranges 9.5 0C-11.5 0C if the valve
half open, and 8.5 0C-10.5 0C if the valve full open. For
refrigerant R600a, the evaporation temperature without subcooling ranges 6.8 oC-8.9 oC, and evaporation temperature with subcooling ranges 5.1 oC-6.5 oC if the
[image:3.612.320.525.99.300.2] [image:3.612.80.290.292.448.2]valve half open and 2.9 oC-4.9 oC if the valve full open (Figure-4).
Figure-4. Effect subcooling and cooling load on decrease
T-evap ( oC) for R134a, R600a.
Figure-4 shows the effect of a decrease in the evaporator temperatures are subcooling and cooling loads, where use R134a and R600a, the greater the cooling load increases subcooling and greater decrease in temperature. Figure 8 shows the percentage decrease in evaporation temperature with the formula (1).
Figure-5 shows the percentage decrease in evaporation temperature with the formula (1). Figure-4 shows that percentage reduction effect subcooling and cooling load the use of R600a and R 134a, where give percentage reduction a greater of the use of R134a, meaning that the use of subcooling very influential on the evaporator temperature decrease with greater use of R600a. Decrease average in evaporator temperature with refrigerant R600a at temperature 4.01 oC percentage is
[image:3.612.323.531.531.694.2]71.43%.
Figure-5. Effect subcooling and cooling load on decrease
T-evap (%) for R134a and R600a.
0 10 20 30 40 50 60 70 80
1.5 2 2.5 3 3.5 4 4.5
Load(watt)
dec
reas
e
T
-ev
ap
(o
C
)
1/2v-R134a 1v-R134a 1/2v-R600a 1v-R600a
0 10 20 30 40 50 60 70 80
10 20 30 40 50 60 70 80
Load(watt)
d
ec
reas
e
T
-ev
ap
(
%
)
Effect on Cooling Refrigeration
Figure-6 and Figure-7, show that effect subcooling and cooling load on increase Q-evap (kJ/kg) for R134a and R600a, calculation Qe, and the percentage increase Qe in the refrigeration effect derived from Figure-2, and equation 4. From the data processing if the cooling load increases, the cooling effect decreases.
Figure-6. Effect subcooling and cooling load on increase
Q-evap (kJ/kg) for R134a, R600a.
From Figure-6, for refrigerant R134a increase Qe with range 6.31 kJ/kg-8.43 kJ/kg if the valve open half, and 10.95 kJ/kg-12.78 kJ/kg if the valve full open, average up to 11.65 kJ/kg, and for R600a increase Qe with range 10.95 kJ/kg–18.22 kJ/kg if the valve open half and 16.85 kJ/kg-20.23 kJ/kg if the valve full open, average up to 18.94 kJ/kg.
Figure-7, show that percentage effect subcooling and cooling load on increase Q-evap for R134a, R600a, if subcooling and cooling load increases, the increased evaporation due subcooling effect. The increase in the cooling effect R600a is greater than the R134a, the average increase Q-e is 8.26% for R134a, and 6.90% for R600a, so that that the use subcooling for R600a means of a cooling effect that is better than using R134a.
Figure-7. Effect subcooling and cooling load on increase
Q-evap (%) for R134a and R600a.
Effect on Work Load Compressor
The calculation of the compressor work W and the percentage increase compressor work W (%W) derived from Figure-2, and the equation 5. Figure 8 and Figure-9 show that effect sub cooling on work load compressor.
Figure-8. Effect subcooling and cooling load on increase
W-comp (kJ/kg) for R134a, R600a.
Form Figure-8, show that average compressor work under ideal conditions with R134a is 35.57 kJ/kg, with subcooling increased to 36.71 kJ/kg if the valve half opening and 37.58 kJ/kg if the valve full open. With refrigerant R600a, under ideal conditions compressor work is 55.79 kJ/kg, with subcooling increased to 56.kJ/kg if the valve half open and 57.77 kJ/kg if the valve full open. From Figure-8 shows that the effect of subcooling and cooling load on the increase of W-comp (kJ / kg) for
0 10 20 30 40 50 60 70 80
6 8 10 12 14 16 18 20 22
Load(watt)
in
cr
eas
e
Q
-ev
ap
(k
J/
kg
)
1/2v-R134a 1v-R134a 1/2v-R600a 1v-R600a
0 10 20 30 40 50 60 70 80
4 5 6 7 8 9 10
Load(watt)
in
cr
eas
e
Q
-ev
ap
(%
)
1/2v-R134a 1v-R134a 1/2v-R600a 1v-R600a
0 10 20 30 40 50 60 70 80
0.5 1 1.5 2 2.5
Load(watt)
in
cr
ea
se
W-co
mp
(kJ/
kg
)
R134a, and R600a, and the greater the capacity of the compressor subcooling also the greater the gains.
Figure-9. Effect subcooling and cooling load on increase
W-comp (%) for R134a and R600a.
Figure-9, shows that the effect of subcooling and cooling load on the increase of W-comp (kJ/kg) for R134a, and R600a. From Figure-9 show that compressor work is the greater the capacity of the compressor subcooling also the greater the gains. The effect of subcooling and cooling load on the increase of W-comp (%) for R134a, and R600a. Figure-6, form the image can be concluded that the increase in compressor work is not affected by the magnitude of the cooling load, but is influenced by the amount of subcooling capacity. The greater the subcooling cooling loads, the greater the increase in compressor work.
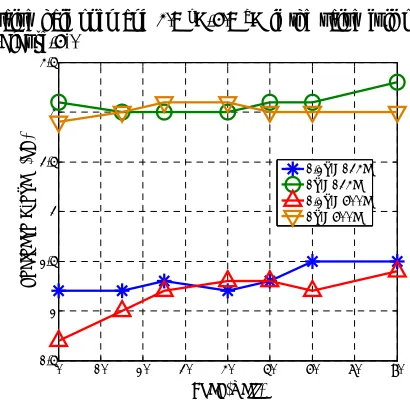
Effect on COP
The amount of COP calculated by the formula (2) and (3), and the increase in the COP calculated with the formula (6). Effect subcooling and cooling load on COP is presented in Figure-10 and Figure-11.
Figure-10. Effect subcooling and load cooling on increase
COP for R134a, R600a.
Form Figure-10, show that the increase in cooling load and subcolling will increase the value of the COP. Form Figure-10, average increase COP with use refrigerant R134a relatively small in ranges 0.06 if the valve open half to 0.11 if the valve full open, and use refrigerant R600a, average increase COP due to greater subcooling, the average 0.16 if the valve open half to 0.17 if the valve full open.
Figure-11. Effect subcooling and load cooling on COP
(%) for R134a and R600a.
Figure-11, show that effect subcooling on increase COP. Percentage increase in COP the use refrigerant R134a, the average is 2.10% if the valve half open 2.83% if the valve full open, and the percentage of increase COP use refrigerant R600a to 3.59% the valve half open to 3.49% if the valve full open. It can be concluded that the subcooling and cooling loads
0 10 20 30 40 50 60 70 80
2 2.5 3 3.5 4 4.5 5 5.5 6
Load (watt)
in
cr
e
ase
W
-c
om
p(
%
)
1/2v-R134a 1v-R134a 1/2v-R600a 1v-R600a
0 10 20 30 40 50 60 70 80
0.06 0.08 0.1 0.12 0.14 0.16 0.18 0.2 0.22
Load (watt)
in
cr
e
ase
C
O
P
1/2v-R134a 1v-R134a 1/2v-R600a 1v-R600a
0 10 20 30 40 50 60 70 80
1 1.5 2 2.5 3 3.5 4 4.5 5
Load (watt)
in
cr
e
ase
CO
P
(
%
)
significant effect on the increase in the COP, and use refrigerant R600a percentage increase in COP is larger than use refrigerant R134a.
CONCLUSIONS
The greater the subcooling temperature, the greater the temperature drop in the evaporator, and the cooling effect also increases, and greater use of R600a cooling effect compared to R134a. The increase in compressor work is not affected by the cooling load, but is influenced by the amount of subcooling capacity. The greater the subcooling cooling loads, the greater the increase in compressor work. Use of subcooling significant effect on the increase of the COP by using the refrigerant R600a compared to R134a. Broadly speaking that refrigerant R600a can be used as a substitute refrigerant R134a.
ACKNOWLEDGEMENTS
This research is part of a research grant funding through the Higher Education Research Lecturer decentralization scheme for Young Beginners fiscal year 2014 Contract No. 111/1/16 / LPPM /2014. To the authors would like to thank Dr. Ir. Supriadi Legino, as chairman of STT-PLN and Dr. Ir. Mohammad Hafiz, M.Eng. Sc, as Chairman of the Research Institute of STT-PLN.
REFERENCES
[1] Sukamto, A.P. Edi, Triaji Pangripto P, Sumeru, dan Henry Nasution, Analisis Energi Peningkatan Kinerja Mesin Pendingin Menggunakan Liquid Suction Subcooler Dengan Variasi Temperatur Lingkungan”, SNTMUT 2014, ISBN 978-602-70012-0-6, pp KE09-1-8.
[2] Poltker, Gustavo and Predrag S. Hrnjak, “Effect of Condenser Subcooling of the Performance of Vapor Compression Systems: Experimental and Numerical Investigation”, International Refrigeration and Air Conditioning Conference, July 16-19, 2012, Purdue e-Pubs, 2512.
[3] Thangavel, P. et al, “Simulation Analysis of Compression Refrigeration Cycle with Different Refrigerants”, International Journal of Engineering and Innovative Technology. Volume 2, Issue 10, April 2013, ISSN: 2277-3754 pp. 127-131.
[4] Baskaran, A and P. Koshy Mathews, A Performance Comparison of Vapour Compression Refrigeration System Using Eco Friendly Refrigerants of Low Global Warming Potential, International Journal of
Scientific and Research Publications, Volume 2, Issue 9, September 2012, ISSN : 2250-3153.
[5] Paharia, Ashish Kumar and Gupta, R.C.; “Effect of Sub Cooling and Superheting on Vapor Compression Refrigerant Systems Using R-22 Alternative Refrigerants”, International Journal of Emerging Trends in Engineering and Development, Issue 3, Vol 1, January 2013, ISSN : 2249-6149 pp. 521-531.
[6] Upadhyay, Neeraj, To study the effect of subcooling and diffuser on the coefficient of Performance of Vapour Compression Refrigeration System, Internatonal Journal of Research in Aeronatuical and Mecanical Engineering, ISSN : 2321-3051, Volume 2, Issue 6, Juni 2014, pp. 40-44.
[7] Wongwices, Somchai and Chimres, Nares, Experimental study of hydrocarbon mixture to replace HFC-134a in a domestic refrigerator, Energy Conversion and Management, Vol 45, Elvisar, 2005 pp. 85-100.
[8] Boloji, Bukola Olalekan, Effects of Sub-Cooling on the Perfformance of R12 Alternatives in a Domestic Refrigeration System, International Scecience Technology, Vol 15 No. 1 Januari-March, Thammasat, 2010, pp. 12-19.