Munich Personal RePEc Archive
Portfolio Selection Using Genetic
Algorithm
Sefiane, Slimane and Benbouziane, Mohamed
University of Relizane, Algeria„ Université de Tlemcen
2012
Online at
https://mpra.ub.uni-muenchen.de/41783/
1
Portfolio Selection Using Genetic Algorithm
Slimane Sefiane1 & Mohamed Benbouziane2
1- University of Relizane, Algeria , Email: [email protected] 2- University of Tlemcen, Algeria, Email : [email protected]
Abstract
The selection of optimal portfolios is the central problem of financial investment decisions. Mathematically speaking, portfolio selection refers to the formulation of an objective function that determines the weights of the portfolio invested in each asset as to maximize return and minimize risk. This paper uses the method of genetic algorithm (GA) to obtain an optimal portfolio selection. However, the GA parameters are of great importance in the procedure of convergence of this algorithm towards the optimal solution such as crossover. While, a five asset portfolio example is used in this paper to illustrate the validity and efficiency of genetic algorithm method, GA method can also be used however for a larger number of portfolio compositions. The results obtained confirm previous research studies about the validity and efficiency of genetic algorithm in selecting optimal portfolios.
JEL classification numbers: G11
Keywords: portfolio optimization, objective function, artificial intelligence methods, genetic algorithm.
Introduction
Portfolio optimization is one of the most challenging problems in the field of finance.
Choosing the weights of the portfolio to invest in each asset to meet the risk and return
expectations make this problem more crucial. In dealing with this problem, Harry Markowitz
1959 developed a quantitative model, also called mean-variance model. The mean-variance
model has been usually considered as either the minimization of an objective function
representing the portfolio variance (risk) for a given level of return or the maximization of an
objective function representing the portfolio return for a given level of risk. In this model
however, cardinality and bounding constraints are not considered (Fernandez and Gomez,
2007). To account for the limitations of the mean-variance model of Markowitz, some
2 Programming (LP) and Second-Order Cone Programming (SOCP) have been developed and
used (Davidson, 2011). However, these methods have some drawbacks in portfolio
optimization as are based on linear assumption and are therefore good for quadratic
objective functions (deterministic) with a single objective (Roudier, 2007). But the important
question that this paper is trying to answer is what if the objective function is not quadratic
and has more than one objective: Maximisation of return and minimisation of risk
simultaneously? .
Recently, some methods based on artificial intelligence such as Genetic algorithm
have been applied to overcome this problem. GAs are stochastic, heuristic techniques based
on the natural selection principles, and they can deal with nonlinear optimization problems
with non-smooth and even non-continuous objective, and continuous and/or integer
variables (Lin et al; 2005).
However, the choice of GA parameters such as the mutation
and crossover methods can influence the GA performance
(Bakhtyar et al, 2012
).For the application of GA, three crossover procedures which are: Single point, two points,
and arithmetic have been applied, while other procedures such as mutation and selection
could be applied also. The procedures of cross over are applied in order to know their
impact on the convergence time of GA towards the optimal solution. GAs derives most of
their power from cross over. Cross over, in combination with survival of the fittest
structures, allows the best components of differing solutions to combine to form even
better solutions (Mahfoud and Mani, 1996).
Although the use of GAs has progressed well in different fields like health, engineering,
electronics, robotic and so, such progress however, is still not well advanced in the field of
finance, especially in portfolio optimization problems. As such, this paper will shed more
light on the contribution that GA can make in solving portfolio optimisation problems.
Presentation of Genetic Algorithms and their Applications in Finance
Genetic algorithms (GAs) are stochastic optimization algorithms based on the
mechanisms of natural selection and Genetics (Holland, 1975) GA is now applied in many
diverse applications such as simulation parameterization, real time control and optimization
problem ( Sawati Binti, 2005). Gas have been applied successfully to real world problems and
exhibited; in many cases; better search efficiency compared with traditional optimization
3 According to Vallée and Yildizoglu (2003 ), the applications of genetic algorithm In
the field of finance have been booming in recent years and begin to integrate in finance
books. Pereira (2000), argues that Genetic algorithms are a valid approach to many practical
problems in finance which can be complex and thus require the use of an efficient and
robust optimization technique. Some applications of genetic algorithms to complex
problems in financial markets include: forecasting returns, portfolio optimization, trading
rule discovery, and optimization of trading rules.
Genetic algorithm has been successfully applied to different portfolio optimization.
For example, Laraschi et al. (1996) used the GAs to select an optimal portfolio. The GA was
used to find the weights of a portfolio stocks that minimize a certain level of risk for an
expected level of return. The study concluded on the effectiveness of the method including
notably with regards to the possibility of existing multiple equilibrium. Xia Lau Yang (2006),
applied GA method along with a dynamic portfolio optimized system to improve the
efficiency of the stock portfolio. The findings of the study showed that the GA is of higher
return compared to the other methods used in the study and simultaneously of less risk. In
their study Lin and Gen (2007), used Markowitz model as a basic math model, looked for
maximizing the return and minimizing the investing risk. Their findings proved the reliability
and efficiency of the genetic algorithm in optimizing the stock portfolio. Aranda and Iba
(2009) introduced a tree genetic algorithm that was used for the optimization of the stock
portfolio. The smaller stock portfolios were obtained here. In a study done on 146
companies at Tehran Stock Exchange, Garkaz (2011) applied GA to select the optimal stock
portfolio. The findings of the study proved the efficiency of the GA in optimizing of the stock
portfolio.
Optimization using genetic algorithm
A genetic algorithm is an iterative method for searching the optimum solution; it
manipulates a population with the constant size. This population consists of candidate
points called chromosomes. This algorithm leads to a competition phenomenon between
the chromosomes. Each chromosome is the encoding of a potential solution for the problem
to be solved, it made up of a set of elements called genes, which can take several values. At
each iteration (generation) a new population is created with the same size. This generation
consists of the better chromosomes "adapted" to their environment as represented by the
4 selective function. The conception of the new population is made by applying the genetic
operators which are selection, crossover and mutation.
Selection: The new individuals selection is made as follows: Calculate the reproduction probability for each individual
n
i i i i
f f p
1
Where: fi is the Fitness of the individuali. (a fitness function is needed to evaluate the quality of each candidate solution with regard to the task to be performed).
nis the size of the population. Each time a single chromosome is selected for the new population. This is achieved by generating a random number r from the interval [0, 1]. If
1
p
r
then select the first chromosome, otherwise select the ith chromosome such asi
i r p
p1 .
crossover : The crossover operator follows:
Population resulting from selection is divided into two parts. Each pair formed will undergo the crossover with a certain probabilityPc. Many different types of crossover exist in the
literature for example: single point crossover, two point crossover, and arithmetic crossover.
Mutation:
The individuals in the population after crossover will then undergo a process of mutation;
this process is to randomly change some bits, with a certain probability
P
mGenetic algorithms are more flexible than most search methods because they require only
information concerning the quality of the solution produced by each parameter set
(objective function values) and not like many optimization methods which require derivative
information, or even more, complete knowledge of the problem structure and parameters
(Bouktir et al, 2004).
There are some difference between Gas and traditional searching algorithms (Augusto et al,
2006). They could be summarized as follows:
1. they work with a coding of the parameter set and not the parameters themselves;
2. they search from a population of points and not a single point;
3. they use information concerning of (payoff) and not derivatives or other auxiliary
knowledge;
4. they use probabilistic transition rules and not deterministic rules.
5 In a GA application, evaluation is performed by means of the fitness function which depends
on the specific problem and the optimization objective of the GA (Petridis et al, 1998).
In achieving the aim of this paper, the objective function (fitness function) is modeled to find
the solution that scores less on the fitness scale, hence in this application, crossover
procedure with the least objective function should lead to better solution.
The aim is to choose weights of the portfolio invested in each asset to maximum return and minimum of risk.
The expected return of the individual assets i is presented as a polynomial of first degree:
i
i w r
w
E( ) i (1)
Where
i
w denotes the weight of the individual asset i.
i
r denotes the expected return of asset i.
Thus the total expected return of portfolio P can be written as:
n i i w E F 1 )
( ,and the
objective function of the portfolio return to be maximized can be written as follows:
n i i w E F 1 ) ( max (2) Where:n
is the i number of assets.The objective function of the Portfolio variance is presented as a polynomial of second degree: ) , cov( 2 )) ( ( ) ( 1 1 2 1 2 2 j i n i n i j j i i n i i
i w r ww r r
w
6
) (
2 i
r
: Variance of asset i)
,
cov(
r
ir
j : Covariance between asset i and asset jAnd the multi objective function to minimize is illustrated as:
) ( 25 . 0 ) ( )
(wi F wi 2 wi
H
(4)Under the following constraints:
1
1
n
i i
w (5)
max min
i i
i w W
W (6)
to have a positive return what so ever are the weights values , let’s
0
1
n
i i iw
r (7)
Where:
max i
W and Wimin : maximum and minimum weights of asset i.
For the genetic algorithm application, the method of minimization under constraints has been used which is the penalty method.
n i
w
gi( i)0 0,... (8)
These are the inequality constraints type
n j
w
7
These are the equality constraints of type,
The problem is transformed into a penalty function, which is presented as follows:
2 1 2 1
]
)
(
1
[
)]
(
[
1
)
(
)
,
(
mj i i
k n j i j k i k i
w
g
w
h
w
F
r
w
F
(10)Where:
k is the penalty coefficient?Presentation of the results
The main objective of this paper is to illustrate via a five (05) asset portfolio example
the efficiency of the GA in solving portfolio optimisation problems. In order to achieve this
goal, the objective of the fitness function in the GA method is set as to maximize the return
and minimize the risk of the portfolio, and consequently the value that scores less on the
fitness scale should lead to the best solution.
The data
For simplicity reasons, let’s suppose the following historical returns from a five (05) stocks
portfolio for a period of five years. The portfolio average return and the portfolio variance
are estimated using these historical data.
Year Stock 1 Stock 2 Stock 3 Stock 4 Stock 5
2007 2008 2009 2010 2011 -0.15 0.05 -0.43 0.79 0.32 0.29 0.18 0.24 0.25 0.17 0.38 0.63 0.46 0.36 -0.57 0.18 -0.12 0.42 0.24 0.30 -0.10 0.15 0.15 0.10 0.25
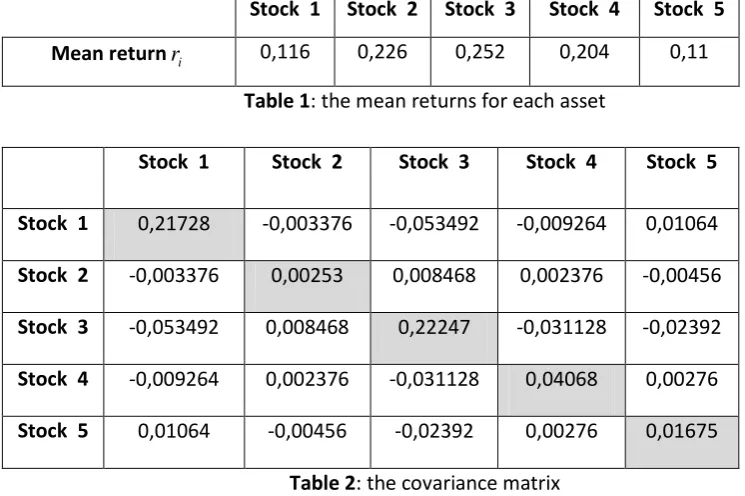
The mean return for each asset and the covariance matrix are given in the tables
8 Stock 1 Stock 2 Stock 3 Stock 4 Stock 5
[image:9.595.103.476.75.323.2]Mean returnri 0,116 0,226 0,252 0,204 0,11
Table 1: the mean returns for each asset
Stock 1 Stock 2 Stock 3 Stock 4 Stock 5
Stock 1 0,21728 -0,003376 -0,053492 -0,009264 0,01064
Stock 2 -0,003376 0,00253 0,008468 0,002376 -0,00456
Stock 3 -0,053492 0,008468 0,22247 -0,031128 -0,02392
Stock 4 -0,009264 0,002376 -0,031128 0,04068 0,00276
[image:9.595.96.460.471.618.2]Stock 5 0,01064 -0,00456 -0,02392 0,00276 0,01675
Table 2: the covariance matrix
The shaded cells represent the variance of asset i (
2(ri))The results from using MATLAB for each cross over procedure can be seen below:
The diagrams and tables below illustrate the functions of genetic algorithm results obtained via the crossover procedures.
The single point procedure
0 10 20 30 40 50 60 70 80 90 100 4.5
5 5.5 6 6.5 7
Generation
Fitne
ss
val
ue
Best: 4.9006 Mean: 4.9016
1 2 3 4 5
0 0.1 0.2 0.3 0.4
Number of variables (5)
Curre
nt be
st in
divi
dual
Current Best Individual
10 20 30 40 50 60 70 80 90 100 0
0.1 0.2 0.3 0.4
Generation
Avergae Distance
Average Distance Between Individuals
10 20 30 40 50 60 70 80 90 100 4.9
4.95 5 5.05 5.1 5.15 5.2
Generation
Bes
t Fitne
ss
Best: 4.9006
Best fitness Mean fitness
Diagram1: The variations of the GA functions according to generation under the single point cross over procedure
Portfolio Weights
w1=
0.05128123839899
W2=
0.2051014436759
W3=
0.328635273473
W4=
0.255234628126
W5=
9
Objective function value: 4.900620341135611
Variance of Portfolio = 0.0194
Average Return of Portfolio = 0.2049
Computing time = 3.5710 seconds
The two point procedure
0 10 20 30 40 50 60 70 80 90 100 4.5
5 5.5 6
Generation
Fitne
ss
val
ue
Best: 4.5985 Mean: 4.599
1 2 3 4 5
0 0.2 0.4 0.6 0.8
Number of variables (5)
Curre
nt be
st in
divi
dual
Current Best Individual
10 20 30 40 50 60 70 80 90 100 0
0.1 0.2 0.3 0.4
Generation
Avergae Distance
Average Distance Between Individuals
10 20 30 40 50 60 70 80 90 100
4.5 4.6 4.7 4.8 4.9 5
Generation
Bes
t Fitne
ss
Best: 4.5985
Best fitness Mean fitness
Diagram 2: The variation of the GA functions according to generation under the two points cross over procedure.
Portfolio weights
w1=
0.1169468063846
W2=
0.0793431661045
W3=
0.636040222078
W4=
0.1169054764309
W5=
0.05174945814081
Objective function value: 4.598464598013125
Variance of Portfolio = 0.0801
Average Return of Portfolio = 0.2213
Computing time = 4.0470 seconds
10
0 10 20 30 40 50 60 70 80 90 100
4.5 5 5.5 6 6.5 Generation Fitne ss val ue
Best: 4.5322 Mean: 4.5328
1 2 3 4 5
0 0.1 0.2 0.3 0.4 0.5
Number of variables (5)
C u rr e n t b e s t in d iv id u a l
Current Best Individual
10 20 30 40 50 60 70 80 90 100 0 0.1 0.2 0.3 0.4 Generation Avergae Distance
Average Distance Between Individuals
10 20 30 40 50 60 70 80 90 100 4.5 4.55 4.6 4.65 4.7 4.75 Generation Bes t Fitne ss Best: 4.5322
Best f itness Mean f itness
Diagram 3: The variation of the GA functions according to generation under the arithmetic cross over procedure
Portfolio weights w1=
0.0536704759282
W2=0.407565381875
W3=0.391342665955
W4=0.0952988354731
W5=0.0530909558293
Objective function value: 4.532249532470961
Variance of Portfolio = 0.0325
Average Return of Portfolio = 0.2222
Computing time = 3.5690 seconds
Discussion
For the application of the GA, an objective function (fitness function) was formulated to
evaluate which among the three cross over procedures scores less on the fitness scale, and
consequently should lead to the optimal portfolio.
The results show that the arithmetic cross over procedure gives better results than the two
other procedures (i.e. single point and two points). The difference in the value of fitness
function is clear. The arithmetic cross over procedure scores less on the fitness scale with
4.532249532470961, whereas the two point procedure scores 4.598464598013125, and the
single point procedure scores 4.900620341135611. With regards to the fitness function
value, the arithmetic procedure should lead to the best choice of weights (w1:
0.0536704759282,
w2:0.407565381875; and w3:0.391342665955,
w
4:
0.0952988354731, w
5: 0.0530909558293) and thus the optimal portfolio with a highest
return of: 0.2222 and a lowest risk of: 0.0325.
As illustrated above, the GA can converge towards the optimal solution in a very little time:
11 Conclusion
In this paper, a genetic algorithm method was applied to solve the optimal portfolio
selection. The method was applied on a simple example of five asset portfolio; the results
obtained are interesting and confirm the efficiency of the genetic algorithm for its fast
convergence towards the better solution and its interesting computing time.
A further research is needed to compare the results of GAs methods with regards to
the mutation and selection procedures.
References
Aranba, C. and H. Iba (2009), The Mimetic Tree-based Genetic Algorithm and its application to portfolio optimization., Springer Mimetic Comp (2009) 1: 139-151.
Bakhtyar, S.H. Meraji, an .A. Barry., 2012., An Application of Evolutionary Optimization Algorithms for determining concentration an Velocity Profiles in Sheet Flows an Overlying Layers; Journal of Offshore Mechanics an Arctic Engineering
Bouktir. T., L. Slimani., and M. Belkacemi.; (2004), A Genetic Algorithm for Solving the Optimal Power Flow problem., Leonardo Journal of Sciences., Issue 4-2004.
Lin. Dans, Xiaoming Li, and Mingiang Li.; (2005).; A Genetic Algorithm for Solving Portfolio Optimization problems With Transactions Costs and Minimum Transactions Lots.; LNCS, 2005; Volume : 3612/2005.
Davidson. M,. (2011); Portfolio Optimization and Linear Programming,; Journal of Money, Investment and Banking,; Issue 20 (2011)
Fernandez A., and S. Gomez., (2007); Portfolio Selection Using Neutral Network, Computers & Operations Research 34 (2007).
Garkaz, M., (2011), The selection and optimization of stock portfolio using genetic
algorithm based on mean-semi variance model., International Conference on Economics and Finance Reaserch, IPEDR, Vol. 4, LACSIT Press, Singapore.
Holland, J.H, (1975), Adaption in Natural and Artificial Systems, University of Michigan Press.
Laraschj, A. and Tettamanzi, A. (1996), An evolutionary algorithm for portfolio selection within the downside risk framework, in Dunis. Ed., Forcasting Financial Markets, John Wiley and Sons.
12 Mahfoud, S. & Mani, G., Financial Forecasting Using Genetic Algorithms, Journal of Applied Artificial Intelligence Vol.10, Num 6, (1996), 543-565.
Markowitz H.(1952)., Portfolio selection; Journal of Finance 1952;7:77–91.
Pereira, Robert, (2000). "Genetic Algorithm Optimization for Finance and Investments," MPRA Paper 8610, University Library of Munich, Germany
Petridis. V., Spyros Kazardis, and Anastarios Bakirtzis., (1998), Varying Fitness Functions in Genetic Algorithm Constrained Optimization : The Cutting Stock and Unit Commitment Problems., Cybernetics, Vol. 28, No, 5, 1998.
Roudier Felix, (2006), Portfolio optimization and genetic algorithms., Master’s thesis, Department of Management, Technology and Economics., Swiss Federal Insqtitute of Technology (ETM), Zurich.
Sawati Binti Abdul Ghani (2005), An Application of Genetic Algorithm in Finance, Thesis submitted in fulfillment of the requirements for Bachelor of Science (Hons) Intelligent System Faculty of Information Technology And Quantitative Sciences, Universiti Teknologi MARA
URL: http://cswww.essex.ac.uk/FAT
Vallée, T. and Murat Yildizoglu, (2003), Présentation des algorithmes génétiques et leurs applications en économie., www.sc.eco.univ.nantes.fr/-tvallée/recherche.