ISSN: 1992-8645 www.jatit.org E-ISSN: 1817-3195
FORECASTING THE CASE OF TRAFFIC ACCIDENTS
THROUGH THE GEOGRAPHIC INFORMATION SYSTEM
(GIS) APPLICATION METHOD WITH DOUBLE
EXPONENTIAL SMOOTHING AND ANALYTICAL
HIERARCHY PROCESS (AHP) IN CITY OF
JAYAPURA-PAPUA
1CHALEB O.L. PANYUWA, 2EKO SEDIYONO, 3ADE IRIANI
1
Information System Departement,, SATYA WACANA CHRISTIAN UNIVERSITY
E-mail: [email protected], [email protected], [email protected]
ABSTRACT
Traffic accidents is a problem that needs great attention from all parties, both government and society. Traffic accidents has high cases in Indonesia can caused by various factors, namely: environmental factors (nature), the driver and the road. The aim of this study is to provide constructive advice to Traffic Officer of Jayapura to facilitate the countermeasures of cases Traffic Accident in the City of Jayapura with the presentation of accurate data information so that, it can be set the right solution to fight and prevent cases of Traffic Accident in the City of Jayapura. Double Exponential Smoothing methods used to forecast the vulnerable data to Traffic Accident and AHP is used to determine the dominant criteria. The results of AHP in visualized in the form of GIS. Through the application of WebGIS Traffic Officer can present the accurate data to support the process of countermeasures and prevention the cases of Traffic Accident in the City of Jayapura, so as to provide good performance for Traffic Officer in Jayapura.
Keywords: Traffic Accidents, Double Exponential Smoothing, Analytical Hierarchy Process, Geographic
Information System.
1. INTRODUCTION
Traffic accident is a problem that needs great attention from all parties, both government and society. This is because of the number of Traffic Accidentcase is very high in Indonesia. This case is the third number killer, after heart disease and stroke in Indonesia. The high of Traffic Accidentnumber in the Indonesia can be caused by various factors, such as: environmental factors (nature), the driver and the road [2]. Environmental factors (nature) such as a bad weather conditions which can affect the rider has a short viewing distance that can cause an accident. The driver’s elements that can be carelessness, lack of awareness of individuals and / or lack of knowledge about the efforts to obey the traffic that include the violations of traffic signs [1]. While the factors associated with speed, road planning, road geometric, safety fence in a mountainous area, whether there is a road median, visibility and road surface conditions. Roads are damaged or perforated endanger road users [2].
Those three factors are the cause of traffic accidents in the area under investigation. To prevent the occurrence of traffic accidents that increasing, then the researchers use a double exponential smoothing method and AHP to get the right solution to prevent cases of lacquer in the City of Jayapura in order to reduce the accident rate of Traffic Accident for the following year.
ISSN: 1992-8645 www.jatit.org E-ISSN: 1817-3195
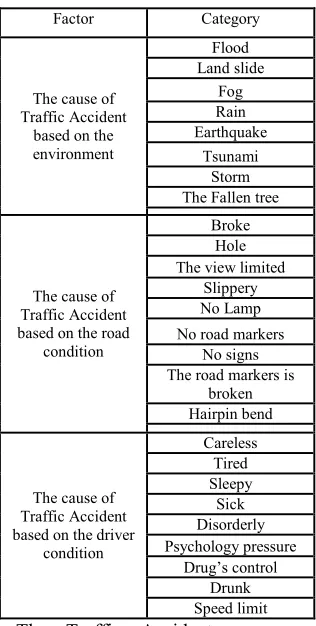
Table 1: Factors and Category of Traffic Accident in City of Jayapura, Papua.
Factor Category
The cause of Traffic Accident
based on the environment
Flood Land slide
Fog Rain Earthquake
Tsunami Storm The Fallen tree
The cause of Traffic Accident based on the road
condition
Broke Hole The view limited
Slippery No Lamp No road markers
No signs The road markers is
broken Hairpin bend
The cause of Traffic Accident based on the driver
condition
Careless Tired Sleepy
Sick Disorderly Psychology pressure
Drug’s control Drunk Speed limit
The Traffic Accident case prevention efforts must be done properly. Therefore, through the development of mapping technology and computer technology or informatics is a Geographic Information System (GIS), the researchers want to provide a mean capable of supporting the prevention efforts of Traffic Accident cases effectively and efficiently. GIS in this research are used to provide a more accurate information to the government (including the attendant Traffic Officer) and the wider community, which can support countermeasures of Traffic Accident cases in the City of Jayapura.
The presentation of data using GIS is needed because of the data presentation that carried by Traffic Officer in City of Jayapura considered ineffective and inefficient, which is still in the form of a textbook report (manual data) are likely to be only known by the Traffic Officer. This is recognized by the Traffic Police officers on duty at the Jayapura police station in the interview process conducted by researchers on January 5th, 2014. The lack of information about the case of Traffic Accident may affect the response to cases of Traffic Accident (Example: The efforts to raise awareness people to obey the traffic rules through online media
(eg WebGIS) that can save time, energy and cost). Information provided by GIS in this research is a point-prone location Traffic Accident along with the factors that trigger the cause of Traffic Accident.
The solutions of countermeasures and prevention of Traffic Accident cases performed with the aid of WebGIS applications through the application of methods of forecasting Double Exponential Smoothing and Analytical Hierarchy Process (AHP). Application of this method is useful as a media communication that serves to distribute, publish, integrate, provide information in the form of digital maps (showing visually the area of Traffic Accident according to the results of forecasting the data on the factors that cause Traffic Accident through Google maps), as well as perform the functions of analysis and queries related to the process of forecasting the data of Traffic Accident for the next period in each region in the City of Jayapura (through the method of Double Exponential Smoothing) and determining the dominant factor triggers that cause Traffic Accident (through AHP) so as to set the right solution for tackling and prevent cases Traffic Accident in the City of Jayapura.
The research questions in this research are (1) How to overcome and prevent the cases of Traffic Accident that faced by Traffic Officer in Jayapura by using WebGIS program with the application of double exponential smoothing method and AHP? (2) What form of presentation of data through WebGIS applications are assessed to support the process of countermeasures and prevention of cases Traffic Accident in the City of Jayapura? The purpose of this study, are: (1) Provide constructive suggestions and ease in handling and preventing Traffic Accident that faced by Traffic Officer in Jayapura through WebGIS program with the application of double exponential smoothing method and AHP; (2) Presenting more accurate data that can support the countermeasures and prevention of Traffic Accident cases in City of Jayapura (through the application of WebGIS).
2. LITERATURE
2.1 Geographical Information Systems (GIS)
ISSN: 1992-8645 www.jatit.org E-ISSN: 1817-3195 The main objective of using GIS is to get
the information that has been processed and stored as an attribute of a location or object easier. The main characteristic of data that can be used in GIS is the data that has been tied to the location and the basic data are not yet specified. Not only that, GIS technology can be used also for scientific investigations, resource management, development planning, cartography and route planning [4].
Here is some research evidence regarding the use of GIS in various fields: (5) GIS for the determination of the direction of the function of land use in Merauke Regency, Papua Province [11]; (6) GIS as a tool to determine the location of grants Banjarbaru primary school South Kalimantan [12].
Similarly, in this study, GIS is used to provide more accurate information to the government (including the attendant Traffic Officer) and the wider community, which can support the countermeasures and prevention of Traffic Accident cases in the City of Jayapura. The information provided by GIS in this research is a point-prone locations Traffic Accident along with the factors that trigger the cause of Traffic Accident. The information obtained through the process of forecasting the data and data analysis (which aims to support decision-making within the right solution set). Data is presented visually or through a digital map.
2.2 WebGIS
WebGIS becomes particularly important given the current GIS application development leads to the Web-based applications. The development of applications in a network environment has shown great potential in relation to geo information. Excess use of WebGIS is a centralized data, lower costs for hardware and software, by the web based makes it more convenient to be used and allows greater access to GIS data. WebGIS has become a trend in which the spatial data management of Indonesian government has issued a program of 'one map' (the policy of the map) which is an initiative of the construction of an integrated spatial data between all sectors so that there is a spatial data reference for each theme map [16].
WebGIS goal is to develop a digital map-based WebGIS for easy retrieval of data and information on the road network, transport facilities, drainage channel and infrastructure firefighters, updating data and draw up a workable mechanism [16].
The benefits of WebGIS is the availability of maps or information based WebGIS well-structured, accurate, easy to read and understand by
[image:3.612.368.523.167.221.2]a layman, either data or map schematic, supporting the macro planning of the road network, transport, drainage systems, facilities and infrastructure extinguisher fire in the city of Surabaya, either directly or indirectly [16].
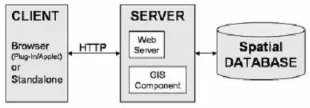
Figure 1. Architecture System WebGIS
The picture above shows the architecture of a minimum of a Web GIS system. The applications are client side that communicates with the server as a data provider via web protocols such as HTTP (Hyper Text Transfer Protocol). Such this applications can be developed with a web browser (Mozilla Firefox, Opera, Internet Explorer, etc.) [16].
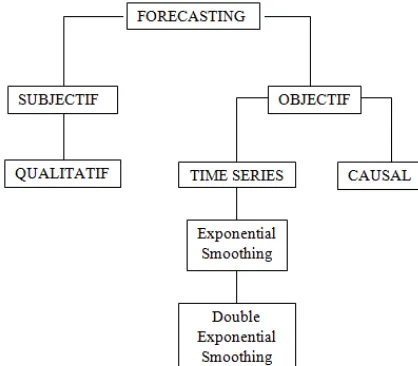
2.3 Method of Forecasting
Forecasting is an essential tool in an efficient and effective planning [15]. The forecasting techniques are divided into two parts, namely: (1) subjective forecasting method and (2) the objective forecasting methods. Subjective forecasting methods have qualitative models. While the objective forecasting method has two models, namely: (a) the causal model and (b) the time series model. The forecasting method that used in this research study is objective forecasting method with time series model, in which the methods used to predict the exponential smoothing method is the Double Exponential Smoothing. The Double Exponential Smoothing method is best used for data with trend pattern [5]. The method is used to predict the Traffic Accident data in the next period in each region in the City of Jayapura. This is because Traffic Accident data in 2008-2013 in City of Jayapura are data with a pattern trend.
ISSN: 1992-8645 www.jatit.org E-ISSN: 1817-3195 species that exist [14]; Double Exponential
Smoothing formula is as follows:
St = α * Yt + (1 – α) * (St - 1 + bt - 1) Bt = γ * (St – St - 1) + (1 – γ) * bt – 1
Ft + m = St + bt m
Note:
St = Forecasting for the t period
Yt + (1-α) = Actual value time series
bt = Trend in the t-period
α = The first smoothing parameter between zero and 1
1 = Smoothing observed values γ = The second parameter for
smoothing the trend
Ft+m = The result of forecasting to m
m = Number of period to face that would be predicted
[image:4.612.91.300.363.546.2]To facilitate understanding of the types of forecasting above, there is the following chart on the types of forecasting methods (see Figure 1).
Figure 2. Types of Forecasting Method.
As a benchmark to determine how far the Double Exponential Smoothing forecasting model able to predict the data that has been preceded well, then use calculation Mean Absolute Percentage Error (MAPE) to measure it. This method is calculating the difference between the original data and data forecasting results. The differences are absolute, and then calculated into a percentage of the original data. This percentage results obtained its mean value [5].
MAPE has the advantage of an error stating the results of forecasting of the actual demand during certain periods that will provide information
on the percentage of errors is too high or too low, so it would be more accurate. In contrast, the weakness is owned by MAPE, MAPE is a measure of the relative error [6]. MAPE forecasting error calculation method has been proven to be able to measure the performance of the model in forecasting on a study of the exponential smoothing method for forecasting the use of a telephone in PT. Telkomsel DIVRE3 Surabaya [13], in which the relatively more accurate calculation results. The formula to calculate using MAPE is as follows [7]:
Note:
Yt = value to the period of data-t. Ϋt = Value -t forecast period. N = A lot of data.
2.4 Analytical Hierarchy Process (AHP)
AHP is a method to help arrange a priority of the various options using multiple criteria (multi-criteria). Because of its multi-criteria, AHP is quite widely used in the preparation of priorities or decisions. As well as being multi-criteria, the selection or prioritization in AHP is done with a logical procedure, structured, transparent and participatory [8]. With the increasingly high demands with regard to transparency and participation, AHP will be very suitable for the arrangement of public policy priorities, which demands transparency and participation [8].
Based on the strength of AHP, this AHP research is used to determine the dominant factors that trigger the cause of Traffic Accident.
It is intended to set the right solution to overcome and prevent cases of Traffic Accident in the City of Jayapura.
Here is some evidence of the use of AHP for decision-making in several studies: (1) OPEC using AHP to choose strategies in an effort to realize its objectives [11]; (2) The use of AHP to prioritize research topics that will be proposed by UNCAPSA, a research institute run by UN-ESCAP [8].
In broad outline, there are three stages in the preparation AHP priorities, namely: (1) Decomposition of the problem; (2) Valuation to compare the elements of decomposition; and (3) Synthesis of priority [10].
2.5 Google Maps
ISSN: 1992-8645 www.jatit.org E-ISSN: 1817-3195 charge, which has the ability for a lot of web-based
mapping service. Google Maps also has properties
server side, the maps that are stored on Google's servers can be utilized by the user. Google Maps API is a library in the form of javascript to modify existing maps on Google Maps as needed. To build applications that utilize the Google Maps on the desktop and mobile devices will be used Google Maps Javascript API v3 which has the advantage of a faster than previous versions [9].
Google Maps in this study is used to present data effectively and efficiently which can support the process of countermeasures and prevention of cases Traffic Accident in the City of Jayapura. Google Maps is able to demonstrate visually the exact area of Traffic Accident according to the results of forecasting the data on the factors triggering cause of Traffic Accident in which the visual representations required to provide an understanding more clearly against conditions related attributes, which can complement the non-spatial data that is already owned by Traffic Officer in Jayapura. For example: Providing updates to data on the location Traffic Accident more quickly and with a digital display that is interesting, rather than using a conventional map.
3. Methodology
3.1 Flowchart Forecasting and AHP
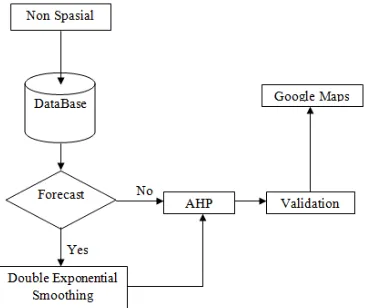
Figure 2 is a process flow diagram Double exponential smoothing forecasting and AHP. Prior to forecast, Traffic Officer in Jayapura collected data in this study is that in the period 2008-2013.
Figure 3. Forecasting Process Flow Diagram and AHP
So, doing the forecasting process takes existing data or previous data (previous year (2013.2012)), the process to look forward to forecast for 1 year ahead. After collecting the value of
forecasting of the data prior to the future, the data collected from the forecasting process are passed to the process AHP, where the results of AHP determine the dominant factors that trigger the cause of Traffic Accident as to set the right solution to overcome and prevent cases Traffic Accident in the City of Jayapura. Then the data is visualized.
4. RESULTS AND DISCUSSION
The need for constructive suggestions and to make easier in handling and preventing Traffic Accident faced by Traffic Officer station for the next long-term period (one year ahead). Additionally Traffic Officer City of Jayapura considered ineffective and inefficient, which is still in the form of a report textbook (manual data) are likely to only be known by the traffic officer. Then most of traffic officer in Jayapura do not yet have a media information that can provide information of the region through online media by using WebGIS program.
Hence need a system that can provide information about the data prone to accidents in the form of program webGIS and can predict the results of the data are prone to accidents for the period of long-term (one year ahead) and then determine the dominant factor triggers cause Traffic Accident to set the solution precise and present data that can effectively and efficiently support the process of countermeasures and prevention of cases Traffic Accident in City of Jayapura (through the application of WebGIS).
[image:5.612.106.289.508.662.2]4.1 Application of WebGIS and forecasting results with AHP
Figure 4. Initial Display Selection webGIS and Group Accident
[image:5.612.312.518.523.652.2]ISSN: 1992-8645 www.jatit.org E-ISSN: 1817-3195 stage the user selects the year 2013, where in 2013
[image:6.612.90.524.73.359.2]there has been no forecasting process.
Table 2. The Data of Accident Prone rating in 2013
Criteria
Abepura
South Jayapura
North Jayapura
Muara Tami
Unawares 0.32 0.32 0.32 0.04
Fatigued 0.25 0.25 0.25 0.25
Sleepy 0.25 0.25 0.25 0.25
Pain 0.25 0.25 0.25 0.25
Disrderly 0.25 0.25 0.25 0.25
Psychological
Stress 0.1 0.4 0.4 0.1
The Medicine 0.25 0.25 0.25 0.25
The Influence
of alcohol 0.29 0.36 0.29 0.07
The Speed
Limit 0.11 0.67 0.11 0.11
Total 2.07 3 2.37 1.57
Table 2 shows the results of the accident-prone rankings in 2013. In the category of driver factors, the first rank is the accident-prone areas of South Jayapura with a value of 3, second in North Jayapura 2.37, Abepura third rank of 2.07, fourth ranked Muara Tami with a value of 1 , 57.
In this case, the user can also know the main factors causing the accident in 2013. From the results show in Table 3, the researchers made aplication traffic officer webGIS to assist in dealing with the main factors causing the accident in order to reduce the accident rate in the next year.
Table 3. Main Factors Cause Accidents in 2013
Region Driver Natural Road
Abepura
46 cases. The cause of traffic unit
factor the driver
0 cases.The cause of traffic unit
based on natural factors
0 cases. The cause of traffic
unit based on factors road
South Jayapura
67 cases.The cause of traffic unit
factor the driver
0 cases.The cause of traffic unit
based on natural factors
0 cases. The cause of traffic
unit based on factors road
North Jayapura
49 cases.The cause of traffic unit
factor the driver
0 cases.The cause of traffic unit
based on natural factors
0 cases. The cause of traffic
unit based on factors road
Muara Tami
29 cases.The cause of traffic unit
factor the driver
0 cases. The cause of traffic unit
based on natural factors
0 cases. The cause of traffic
[image:6.612.94.315.121.360.2]unit based on factors road
Table 3 shows the main factors causing the accidents in 2013. From the three cases, the highest factor is the factor of the driver. Abepura 46 cases, 67 cases of South Jayapura, North Jayapura Muara Tami 49 cases and 29 cases. From the four areas that have the highest accident case is South Jayapura with 67 cases the driver causes an accident factor. This shows that in 2013 the driver factor in South Jayapura highest with 67 cases.
[image:6.612.310.527.372.503.2]Figure 5. Map Display Digital 2015
Figure 5 is a display webGIS or digital map display. In this display, the user selects the same category or group accident (one of the causes of accidents) the causes of Traffic Accident is driver factors, then at this stage the user selects 2015, where in 2015 the process of forecasting.
Table 4. Results of Prediction Accident Prone rating 2015
Criteria Abepura Jayapura South Jayapura North Muara Tami
Unawares 0.36 0.27 0.27 0.09
fatigued 0.21 0.43 0.29 0.07
Sleepy 0.12 0.47 0.35 0.06
Pain 0.24 0.41 0.29 0.06
[image:6.612.93.305.547.702.2]ISSN: 1992-8645 www.jatit.org E-ISSN: 1817-3195
Psychologic
al Stress 0.23 0.38 0.31 0.08
The
Medicine 0.25 0.25 0.25 0.25
The Influence of alcohol
0.33 0.33 0.27 0.07
The Speed
Limit 0.09 0.55 0.27 0.09
TOTAL 1.94 3.76 2.41 0.88
[image:7.612.90.524.74.209.2]Table 4 shows the results of the accident-prone rankings in 2015. In the category of driver factors, the first rank is the accident-prone areas of South Jayapura with values of 3.76, 2.41 second in North Jayapura, Abepura third rank of 1.94, ranking fourth in Muara Tami value of 0.88.
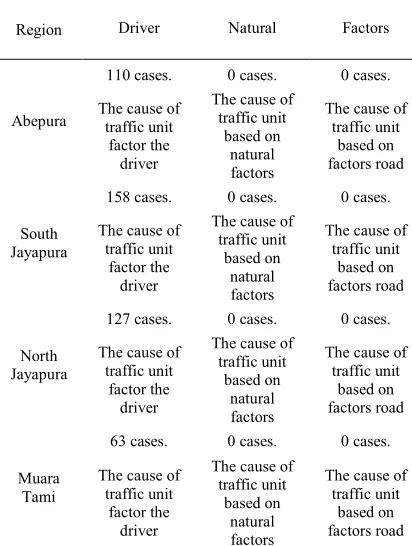
Table 5. Key Factors Cause of Accident 2015
Region Driver Natural Factors
Abepura
110 cases. 0 cases. 0 cases.
The cause of traffic unit
factor the driver
The cause of traffic unit
based on natural factors
The cause of traffic unit
based on factors road
South Jayapura
158 cases. 0 cases. 0 cases.
The cause of traffic unit
factor the driver
The cause of traffic unit
based on natural factors
The cause of traffic unit
based on factors road
North Jayapura
127 cases. 0 cases. 0 cases.
The cause of traffic unit
factor the driver
The cause of traffic unit
based on natural factors
The cause of traffic unit
based on factors road
Muara Tami
63 cases. 0 cases. 0 cases.
The cause of traffic unit
factor the driver
The cause of traffic unit
based on natural factors
The cause of traffic unit
based on factors road
Table 5 shows the main factors causing the accidents in 2015. From the three factors or cases, the highest factor is the factor of the driver. Abepura 110 cases, 158 cases of South Jayapura, North Jayapura Muara Tami 127 cases and 63 cases. From the four areas that have the highest accident case is South Jayapura with 158 cases the driver causes an accident factor. This shows that in 2015 the driver factor in South Jayapura with 158 cases of the highest accident.
Based on interviews conducted with the 30 officers who have studied Traffic Officer WebGIS applications to monitor and predict traffic accidents in the City of Jayapura, all expressed satisfaction with the performance of the program and all of them stated that the program can be used for the next Traffic Officer.
5. CONCLUSION
Double Exponential Smoothing Method is used to calculate data of traffic accident prone and AHP is used to determine the dominant criteria. The result of AHP is visualized in form of GIS.
Through WebGis application, Traffic Officer will be able to present accurate information in order to provide right solution to support the process of tackling/reduction and prevention of traffic accident cases in Jayapura, thus could improve the performance of Traffic Officer in Jayapura.
Scoring result acquired, effective calculation method, and WebGis application is highly beneficial if used by traffic accident officers to predict the cause of traffic accidents, to reduce the traffic accident rate in next year. This application can be accounted by WebGis for Traffic Officer in City of Jayapura.
Based on the result of the study and discussion conducted, it is suggested that there is a need for specific record-keeping because the more specific the data, the more accurate the prediction will be. Factors causing accidents should be multiplied or expanded to know more data about traffic accident prone.
REFERENCES:
[1] Dominic, C. Human Factors In accidents. UK: Institute Of Quarrying. 12 March 2012. [2] Adriliananda. L. M. Hubungan faktor
kecepatan dan kualitas pertolongan pertama terhadap keadaan korban kecelakaan lalu lintas daerah operasional PMI jakarta pusat tahun 2009-2010 (Relations factors speed and quality first aid to the state of traffic accident victims operational region PMI central jakarta the year 2009 to 2010). Skripsi. Jakarta: Universitas Pembangunan Nasional “Veteran”, Fakultas Kedokteran, Program Studi Sarjana Kedokteran. 2011.
[image:7.612.92.298.327.600.2]ISSN: 1992-8645 www.jatit.org E-ISSN: 1817-3195 jakarta). Thesis. Jakarta: Universitas
Indonesia. 1993.
[4] Sundari, D. Sistem informasi geografi (sig). Artikel Ilmiah. Bandung: Politeknik Pos Indonesia, Program Diploma III Teknik Informatika. 2013.
[5] Makridakis, Spyros Wheelwright & Steven C. Metode dan aplikasi peramalan (Methods and Applications Forecasting). Jakarta: Binarupa Aksara. 1999.
[6] Oayuning. Metode peramalan. Laporan
Penelitian. Semarang: Universitas
Diponegoro, Fakultas Teknik, Program Studi Teknik Industri. 2013. Diakses pada tanggal 4
Agustus 2014 dari
http://id.scribd.com/mobile/doc/60950685. [7] Tommy, P., Mursityo, Y. T., & Bachtiar, F.
A. Sistem pendukung keputusan dengan metode exponential smoothing untuk meramalkan hasil penjualan pada studi kasus home industry kue “kayu manis” (Decision support system with exponential smoothing a method to predict the outcome sales in case study home industry cake “cinnamon”).
Jurnal Ilmiah. Surabaya: Universitas Brawijaya Malang, Program Studi Ilmu Komputer, Fakultas Teknologi Informasi dan Ilmu Komputer. 2013.
[8] Bourgeois, R. Analytical hierarchy process: an overview, UNCAPSA-UNESCAP. Bogor. 2005.
[9] Alqod, E., Ary, M. S., Hudan, S. Layanan Informasi Kereta Api Menggunakan GPS, Google Maps, dan Android (Information service train use the gps , google maps , and android). Surabaya: Institut Teknologi Sepuluh November, Fakultas Teknologi Informasi, Jurusan Teknik Informatika.
Jurnal Teknik Pomits Vol. 1, No. 1, (2012) 1-6.
[10] Susila, W. R., & Munadi, E. 2007. Penggunaan analytical hierarchy process untuk penyusunan prioritas proposal penelitian (The use of analytical hierarchy process for the establishment of priority proposals research). Informatika Pertanian 16, 2, 983-998. Surabaya: Universitas Wijaya Kusuma Surabaya.
[11] Ismanto. Sistem informasi geografis untuk penentuan arahan fungsi pemanfaatan lahan
di kabupaten merauke provinsi papua (Geographical information system for the determination of direction function of land use in kabupaten merauke, province of papua). Thesis. Yogyakarta: Universitas Gadjah Mada, Program Magister Ilmu Komputer. 2008.
[12] Mukhlis. Sistem informasi geografis sebagai alat bantu untuk menentukan lokasi pemberian dana bantuan sd di banjarbaru kalimantan selatan (Geographical information system as the tools to determining the location of fund assistance primary school in banjarbaru south kalimantan). Thesis.
Yogyakarta: Universitas Gadjah Mada, Program Magister Ilmu Komputer. 2006. [13] Raharja, A., Angraeni, W., & Vinarti, R. A.
Penerapan metode exponential smoothing untuk peramalan penggunaan waktu telepon di pt. telkomsel divre3 surabaya (The application of a method of exponential smoothing to forecasting use of time the telephone in pt . Telkomsel divre3 surabaya).
SISFO-Jurnal Sistem Informasi. Surabaya: Institut Teknologi Sepuluh November, Fakultas Teknologi Informasi, Program Studi Sistem Informasi.
[14] Nugraha, S. M., Agus, L., Manda, R. Implementasi Peramalan Produksi Daging Berbasis Sistem Informasi Geografis Di Provinsi Gorontalo (The implementation of forecasting meat production based geographical information system in the province of gorontalo). Universitas Negeri Gorontalo, Jurusan Teknik Informatika, Fakultas Teknik. 2012.
[15] Paul, A.J. 2004. Forecasting Theory.
Industria Engineering.
https://www.me.utexas.edu/~jensen/ORMM/ omie/operation/unit/forecast/double_exp.html (Accesed 2014-12-06)