Structural Clustering Multimedia Documents: An
Approach based on Semantic Sub-Graph Isomorphism
Ali Idarrou
IRIT, Team SIG Toulouse 1 Capitole University,
Toulouse France
IRF-SIC Ibn Zohr University Agadir Morocco
Driss Mammass
IRF-SIC Ibn Zohr University Agadir Morocco
ABSTRACT
The works that used graphs to represent documents has referred to the richness of these expressive tools. However, the exploited graph theory could be of great interest concerning the evaluation of similarity between these documents, both in documentary classification and the information retrieval. In structural classification of the documents, object of this work, the similarity measure is a crucial step. In many applications, this step results in a sub-graph isomorphism problem. This problem is known in sub-graph theory by a combinatorial explosion. To get around this problem, we propose to consider a graph as a set of paths that compose it. The matching, paths allows reducing the combinatorial cost.
We propose a structural measure based on the sub-graph isomorphism and we discuss the quality of our classifier, especially the separation of classes. We’d like to show that our measure is structural, not a “surface measure” and evaluate our approach on a corpus of multimedia documents extracted, randomly, from the INEX 2007 corpus.
Keywords
multimedia document, clustering, sub-graph isomorphism, structural similarity.
1.
INTRODUCTION
Increasingly, documentary classification becomes a necessity in many domains of application both in industrials and academics. Generally, documents are classified for underlying purpose: to understand, reduce complexity, heterogeneity (size, type, form, etc), for easy retrieval, etc. The clusters are meaningful to him who created it. In a research laboratory, for example, documents can be grouped by team, by type (thesis, papers, etc.), by theme, etc. The same document can be manipulated differently by human agent or automatically. The multiple uses of a document, implies a multiplication of structures of it: logical, physical, semantic, etc. The definition of multiple structures of the same document arouses the problem of called multi-structured documents [3].
Multimedia documents are characterized by a rich content (image, text, sound, etc) and complex structures, which complicates access to specific granules (fine information) in such documents and therefore makes the evaluation of their similarity a tedious task. The complexity of multimedia documents involves problems related to their representation. In [11], the model MVDM "Multi Views Document Model" proposed by [6] allows a rich representation of the mutli-structured documents. In this model, the multi-structurality induces a representation of documents in graph forms (structures and their links).
We continue within MVDM and we consider that the document structure is sufficiently discriminating factor for classification. In our previous work [9], we have presented our classification process that is to automaticallygenerate, in a documentary warehouse, clusters called generic views. These generic views grouped documents describing similar information (Cvs, documentary films, scientific papers, etc.). We used acyclic graphs to represent document. To compare structurally two documents means to compare the graphs that represent them. The graph theory could be of great interest in the evaluation of the structural similarity. In [13], to show graph equivalence or inclusion, may be done by looking for a sub-graph isomorphism. The problem of sub-graph isomorphism, known in graph theory, is a combinatorial problem. To get around this problem, we propose to consider a graph as a set of paths that compose it.
To evaluate the proximity between document structures, we proposed a similarity measure based on semantic sub-graph isomorphism taking into account the distribution (order, position, etc.) components of the structures compared and relationships between these components (preserve more sense). We show that our approach is based on structural similarity not on the "surface similarity" like as the case, for example, the Jaccard measure and Cosine measure. In [12], ignore the document structure means ignoring its semantic. We have also proposed a cluster threshold separation as a parameter fixed previously by the user. This allows maintaining the cluster stability, minimizing inter-cluster similarity. Increase the dissimilarity between clusters can reduce noise and increase the precision of information retrieval systems (IRS). Indeed, when the clusters are very similar another problem arises. For example, consider two classes of documents: the first group documents discussing the world economic crisis and the second represents the documents on the crisis in Greece. In such a situation, there could be documents that are similar, at the same time, the two classes. In [1], two distant objects represent data belonging to different groups.
In [7], validation of a structure generated by an automatic classification is essential. In this context, we propose to recalculate the clusters once classifying is completed. This ensures that each document is attached at the right cluster. In the next section we will give an overview, not exhaustive but representative measures of graph similarity. First we begin this section with some basic notions on graphs. We describe in the third section our approach of structural clustering of multi-structured multimedia documents.
2.
RELATED WORKS
2.1
Basic notions on graphs
2.1.1
Definition
Definition: A graph G can be defined by a pair (V, E), where V is the set of nodes of G and E V x V represents the set of edges of G (relations between nodes).
2.1.2
Definition
Let the graphs G=(V,E) and G’=(V’,E’) ; G’ is a sub-graph of G V’ V et E’ E.
2.1.3
Definition
let G=(V,E) and G’=(V’,E’) Two graphs. G is isomorphic to a sub-graph of G’ if there is an injection f from V to V’ such:
(u,v) V 2; (u,v) E (f(u),f(v)) E’.
2.2
Similarity measures
Among the standard measures, from the most popular, we cite the Jaccard measure and the Cosine measure. These measures were used in various applications, to evaluate the similarity between two objects, represented by X and Y:
Other measures were introduced in specific contexts and for specific goals. In this section, we present a representative overview of the works that used graphs (or trees) to represent objects to compare them.
[17] represent XML documents in tree form, and then they consider this tree as a set of paths. Thus, they calculate the frequency of these paths in order to ensure the classification of documents. The preprocessing steps, which is to reduce the number of paths, and the filter tag by replacing some tags and ignoring others can cause information loss that can be useful for classification. [16] use the frequency trees in their structural clustering process. It means to associate a document to a cluster by searching, in a corpus of trees, a set of frequently sub-trees to represent the document. The algorithms used in these approaches are complex and therefore their response time is generally very high. [5] use the labeled "tree summary". A tree summary is obtained by transformations (depth reduction, elimination of repeated nodes, etc) of trees. However, these transformations can cause loss of semantic information. To evaluate the similarity of two documents represented in tree forms T and T', [10] has introduced the following measure:
Danc(vj): represents the distance alignment of the ancestors of node vj.
Panc(vj): represents the weight of the ancestors of node vj.
This measure allows calculating the degree of inclusion between two trees T and T’ but it doesn’t evaluate their similarity.
Approaches using trees to represent multimedia documents confronted with the problem of the boundary representation of multiple relationships between the same two nodes in a document. It is therefore necessary to find a model of representation appropriate to the multi-structured multimedia documents.
To compare medical images of a brain model brain [2], used graphs. Since the medical image is often noisy and over-segmented, the comparison of graphs in this context is based on a matching one-to-many (one region of the image model can correspond to several regions of the medical image). [14] have proposed a parameterized measure to evaluate the similarity of graphs representing images. They showed that the measure proposed by [4] can be seen as a particular case of their measurement. The authors have noted that the calculation of their similarity measure arouses a combinatorial explosion that makes searching for greater common sub-graph of two graphs restricted to small graphs. The measures used in these works are introduced in specific contexts; they can’t easily be adapted for solving the general problems. To
calculate the similarity score between two graphs G and G', representing XML documents, [6] proposed the following measure:
Dn : alignment function of relationships ε and ε’
Pf : function to calculate the final weight of a relationship (arc of a graph) and which is equal to the product of three functions Pstr: structural weight, PAdap: weighting adaptation and PRep: weights reflecting the representation of relationships. Calculating the final weight, which is product of these three functions, requires a response time that increases with the size of the graphs.
The choice of modeling objects greatly affects the quality of the classification of these objects. Graphs have a rich expressiveness power, which explains their presence in many application areas. In the next section, we describe our approach of structural clustering of multimedia documents based on structural and semantic similarity of graphs. In [15], many applications involve matching two graphs in order to compute their similarity.
3.
STRUCTURAL CLUSTERING OF
DOCUMENTS
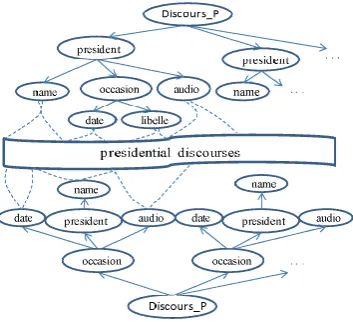
In [6], the notion of structure can be encompassed in a wider concept which is that of view. A view is a particular description of a document which expresses one or more special needs of this document. It reflects one of the structures of a multi-structured document. Multiple descriptions, (multiple views) of the same content, allows combining several criteria to access precisely to the information deemed relevant by the user. For example in Figure 1, the document "Discours_P" contains the discourses of French presidents. It can be described by "President" and "occasion" (two structures of the same nature).
|
|
( , )
(1)
|
|
|
|
sin
( , )
(2)
|
| . |
|
X
Y
Jaccard X Y
X
Y
X
Y
Co
us X Y
X
Y
( )
( )
( , ') 1
(3)
Danc vj
Panc vj
vj
vj SimT T
'
, ' ( , ')
( , ') 1
( ) ( ')
(4)
n
f f
D
Sim G G
P P
( '
'
| ( ) |
( ' ) ' '
otherwise
( )
0
)
(5)
( )
=
(6)
,
i
i e e chm ch
e i e chm
e k k k
i i
i
D chm chm
chm
and e
P e w
where
P e if e e
w i
e
P e
Fig 1: Two same nature structures for the same document
Formally, a view is a description of a document, by a set of components connected with each other. It can be represented using a directed graph where nodes represent components of the view documentary and arcs of the graph represent the relationships between these components (example Figure 1). A document di can be described by a set {Vspj}j[1,ni] of specific views where each view Vspj=(Nj,Ej ) with Nj is a set of components of di and Ej is the set of relationships between these components.
[image:3.595.73.250.82.243.2]For describing document structures, we use the MVDM. This model is organized on the concept of view. It is composed of two layers: a specific layer where each specific view, characterizing the organization of a particular document, is represented in tree form and a generic layer where the generic views are represented by graphs (Figure 2).
Fig 2: Example of the documentary warehouse (DW).
Formally, we can write : DW=DWg DWsp where DWg represents a layer genéric of DW and DWsp repesents its specific layer. A generic view summarizes the overall characteristics of specific views it represents. A cluster Ci,
represented by Vgi (see Figure 2), groups a set of specific views structurally similar. These views describe specific information thematically similar. Access to the cluster represented by Vgi permits access targeted to the sub-collection of documents, represented by it. In our previous works [8], we have presented the steps of our document integration process in the documentary warehouse (see Figure 3). Due to lack of space, we can’t detail our approach to structural clustering, but we refer the reader to these works. The basic idea of our integration process of a new multimedia
generic view Vg of Dwg. then, depending on the results of this step either aggregating Vsp in the cluster most similar (attach the specific components nodes, relations, of document, to the generic components similar of Vg, example Figure 2) or create a new cluster. Clusters aren’t defined previously; they are created automatically along with the integration of documents.
Fig 3: Overall architecture of the clustering process
In the following, we present our similarity measure based on sub-graph isomorphism and show that this measure is structural.
Let G=(V,E) and G’=(V’,E’) two labeled, acyclic and , ordered digraphs. G can be considered as a set of simple paths where one path is a sequence of adjacent nodes p (p>0) from the root node u1 to up : chmi= u1/u2/u3/……../up where (uk,uk+1) E, k{1,2,…,p-1}. And we consider a path of G as a sub-graph of G. Matching two sub-graphs is therefore to match their paths.
Let CHG ={chm1,chm2, …,chmn } the set of paths of G and CHG'={chm’1,chm’2, …,chm’n’} the set of paths of graphs. n (resp. n′ ): number of paths of G (resp. G’).
We define the alignment function of paths Dch from GxG’
(resp. from G’xG) to [0,1] as follows: Dch: G xG’ [0,1]
(chm, chm’ ) Dch(chm, chm’ )
- Pe is the weighting function which allows weighting the relationship of a graph and we have defined as: Pe:E ]0,1[
[image:3.595.52.280.447.574.2]( ) otherwise u is the incident node of (x,u)
ifdepth(v)=1 (u,v)
( )
=
( ) ( , )
1
(7)
;
-
e
e depth v
ord v
k P
ord v P x u
k
- depth(v): designates the depth of the node v, - ord(v): designates the order of the node v (its
position relative to its brothers nodes),
- k is a parameter (a power of 10) fixed by the user and that designates the maximum number of nodes son (son number <k) for each node graphs manipulated.
- e bidirectional alignment function of relations from E to E’ (resp. from E’ to E), which aligns a relation of G to the relation of G’ most similar.
For example in G2 of Figure 4, Pe(C,H)= Pe(A,C) - ord(H) / 1000 =0.779.
Corollary: the path chm of G is similar to the path chm’ of G’ iff Dch(chm,chm’)=min(Dch(chm,chm’j ))j[1,n’]and
Dch(chm,chm’)<1.
To evaluate the structural similarity between graphs G and G’, we have proposed the following measure:
[1, ']
[1, ] [1, ]
[1, ']
' '
'
'
2
where
and ( '
( , ') (8)
min (9)
min (10)
1
(
(
,
' ))
1
(
,
))
'
1
=
ch
k n
ch k
k n
i k n
j n GG G G
GG i
j
G G D chm
d d
Sim G G
D
chm chm
n
chm
n
d
d
Division by n (number of paths of G) allows a standardization the value of dGG’ (dGG’[0,1]).
In the following, we describe our search algorithm for sub-graph isomorphism between two sub-graphs G and G ':
let CHG={chm1, chm2, ……,chmn } the set of paths of G, let CHG’={chm’1, chm’2, ……,chm’n’} the set of paths of G’, let CHApp = where CHApp the set of the matched paths of G.
begin
for each chmi CHG
if chm’j CHG’ / chmi similar to chm’j then CHApp = CHApp { chmi }, CHG = CHG - { chmi }, endif
endfor
if card(CHApp)=card(CHG) then
G is isomorphic to a sub-graph of G’ endif
end
In the following, we show that our measure takes into account the contextual and structural aspects of documents to
compare. We also show our contribution to the cost reduction of combinatorial matching graphs.
3.1
The impact of our weighting on the
proposed measure
The similarity measure proposed is based on path matching of graphs to compare. We show through the example of figure 4, that it takes into account the distribution of the components of matched graphs.
Fig4: Example of weighting graph relations.
Thus in this example of figure 4, the paths G2:E/A/B and G3 :E/A/B are similar to 88% (according to our approach). In fact:
Dch(G2:E/A/B,G3:E/A/B)=
(0.9 0.8) (0.89 0.79) 0.12 0.79 0.8
The distance (greater than zero) between these two paths is due to the fact that the two paths don’t have the same position in the two graphs. Despite consisting of the same elements, these two paths aren't identical (similar 100%) because they haven’t got the same role in both graphs.
In a multimedia document, the order of components, the synchronization between and within components and the links between these components are crucial parameters concerning the sense of this document.
3.2
The particularities of our measure
In a comparison process of document structures, we believe that the structural information is essential and that two documents composed of the same words doesn't imply they are similar.
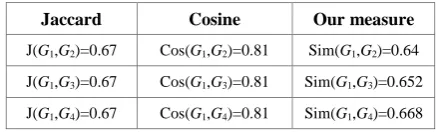
[image:4.595.318.540.582.648.2]We explain, through the example of structures represented by graphs in figure 4, that measures of Jaccard and Cosine don't take into account the distribution of components (order, level of depth, etc) of the matched graphs:
Table 1. Comparison of our measure with those of Jaccard and Cosine
Jaccard Cosine Our measure
J(G1,G2)=0.67 Cos(G1,G2)=0.81 Sim(G1,G2)=0.64
J(G1,G3)=0.67 Cos(G1,G3)=0.81 Sim(G1,G3)=0.652
J(G1,G4)=0.67 Cos(G1,G4)=0.81 Sim(G1,G4)=0.668
The results represented in Table 1 show that measures of Jaccard and Cosine don’t take into account the distribution of components of the graphs matched.
difference between the lines of the third column of Table 1). In our context, we consider that the relationship between the structural components of a document, represent additional information that complement the overall and contextual meaning of these components. For example, the same image in two different documents can’t express the same context and therefore may not have the same importance in both documents. We also show that the existing standard measures can’t effectively respond to our problem.
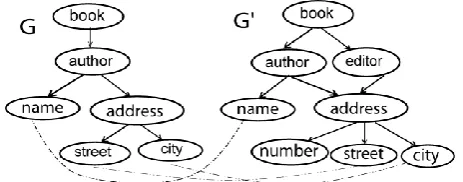
For example in the Figure 5, G=(V,E), G’=(V’,E’) Where : V={book,author,name,address,street,city},
V’={book,author,name,address,number,editor,street,city}, CHG={chm1, chm2, chm3} and CHG’={chm’1,chm’2,chm’3, chm’4, chm’5, chm’6, chm’7}
Where:
chm1=book/author/name, chm2=book/author/adress/street, chm3 =book/author/adress/city, chm’1= book/author/name, chm’2=book/author/adress/number, chm’3=book/author/adress/street, chm’4=book/author/adress/city, chm’5=book/editor/address/number, chm’6=book/editor/adress/number, chm’6=book/editor/adress/street and chm’7= book/editor/adress/city.
In this example, G is isomorphic to a sub-graph of G’ (according our approach). Let f an injection function from V to V’’ such:
- (book,author) of G is similar to (f(book),f(author))= (book,author) of G’,
- (author,name) of G is similar to f(author),f(name))= (author,name) of G’,
- (author,address) of G is similar to
(f(author),f(address))= (author,address) of G’, - (address,street) of G is similar to
(f(address),f(street))= (address,street) of G’, - (address,city) of G is similar to (f(address),f(city))=
(address,city) of G’, Therefore:
- the path chm1=book/author/name of G is similar to the path f(book)/f(author)/f(name)=chm’1 of G’, - the path chm2=book/author/address/street of G is
similar to the path
f(book)/f(author)/f(address)/f(street)=chm’3 of G’, - the path chm3=book/author/address/street of G is
similar to the path
[image:5.595.313.545.72.163.2]f(book)/f(author)/f(address)/f(street) =chm’4 of G’. On the other side, the paths chm3and chm’7 are not similar. More precisely, we have Dch(chm3,chm’7)= 0.105 and Dch(chm3,chm’4)=0.00038,therefore chm3 is the most similar to chm’4. Then, the relationship (address,city) of chm3 can’t be matched to the relationship (address,city) of chm’7 because this paths aren’t similar (according to our approach). However, for measures based on the alignment of nodes, without considering the relationships between the nodes, these two relationships are similar. Consequently, the existing standard measures can’t fully respond to our problem.
Fig 5: Example of semantic matching paths.
The graph matching leads to a combinatorial explosion which increases with the size of graphs: known problem in graph theory. In the next section, we explain our contribution which aims to reduce this combinatorial.
3.3
The reduction of the combinatorial cost
of matching graphs
We explain, through the structures of the example in Figure 5, that the matching paths allows contributing to the reduction of the cost of combinatorial, as discussed above. Calculating the similarity between graphs G and G' is looking for a sub-graph isomorphism. So this is to check all possible injective matchings between G (composed of 6 nodes and 3 paths) and G’ (composed of 12 nodes and 7 paths). The number of injections (allowing to match the nodes of two graphs) possible between these two graphs can be calculated using the formula Apn (number of permutations of p objects from n
objects). In this example, there exists A612
=12*11*10*9*8*7=665280 injectifive matching possible between G and G’ to explore. However, there are A37
=7*6*5*4=840 possible injections, for mapping a path of G to one path of G’(one-to-one). The difference between the number A612 and A37 shows clearly the interest of our
proposal. More generally, let G a graph consisting with p and G’ a graph consisting with n paths (where n>=p). Since a path is a set of nodes, therefore the number of path in a graph is less than the nodes number of this graph. Consequently Apn <
A|V|
|V’| (where |V| is the number of G nodes and |V|<|V’|). In the following, we describe our algorithms that allow evaluating the distance between two graphs G and G’: real Dist(graph G, graph G’)
let CHG={chm1, chm2, …,chmn }the set of G paths, let CHG’={chm’1, chm’2, …,chm’n’} the set of G’ paths, begin
let dGG’=0
for each chmi of CHG //* i [1,n] for each chm’k of CHG’ //*k [1,n’] di=Dch(chmi,chm’k )
endfor d=min(di )
dGG’= dGG’ +d endfor
let dG’G=0
for each chm’i of CHG’ for each chmk of CHG di=Dch(chm’i,chm’i ) endfor
d=min(di )
dG’G= dG’G +d endfor
To test the separation of a given view over all generic views of Dwg, we propose the following algorithm:
boolean Separat(graph V1) begin
boolean View_sep=true for each V2 in DWg
if (Dist(V1,V2) < Ssep and V1≠V2) then View_sep=false exit for endif
endfor
return View_sep end
In the following, we describe our algorithm for the integrating of documents into DW:
let Ss the similarity threshold let Ssep the separation threshold.
Ss and Ssep two parameters fixed a previously by user. let D={d1,d2,…..dn} a set of documents
let C a set of clusters of Dwg begin
for each di in D
Extraction of the specific view Vsp of di if card(C )=0 then
C = { C1 } //* create a new cluster otherwise
for each Vg in Dwg //Transformating Vg
if (Separat(Vg) then
αi =Sim(Vsp,Vg ) //* Sim(Vsp,Vg )=1-Disp(Vsp,Vg) endif
endfor α=max(αi)
if k / Sim(Vsp, Vgk)=α>=Ss then aggregate Vsp into Vgk
otherwise j= card(C )
C = C { Cj+1 } //* create a new class Cj+1 endif
endif endfor reclassify end
This algorithm allows to receive a set of documents D={d1,d2,…,dn}(where a document di is represented by a specific view Vspias input and generating a set of clusters C={c1,c2, …,ck} at the output. Each cluster groups a set of structurally similar documents.
Concerning the threshold of similarity Ss, several tests were realized to determine the optimal value. We noticed that the increase of the value of Ss leads to the creation of numerous clusters. On the other hand, the decrease of this value implies the growth of the number of documents associated to each cluster that arouses heterogeneousness between documents of the same class. We noticed that the value of 0.8 (80 % of similarity) gave good results (Idarrou and al., 10).
Our measure is parameterized by a similarity threshold Ss fixed previously by the user to choose the degree of document similarity of generated clusters.
Formally:
i [1,k] ; dx ci Sim(Vspx, ci)>=Ss (where Vspx is the specific views of documents dx).
i, j [1,k] ; i ≠ j Sim(ci, cj)<Ss (separation of clusters).
4.
EXPERIMENTAL RESULTS
[image:6.595.60.279.243.529.2]To validate our approach, we conducted an evaluation based on a corpus of multimedia documents in XML format (described in Table 1) randomly extracted from INEX 2007 corpus.
Table 2: description of the used corpus
Number of documents 1200
Total number of nodes 55708
Total number of elements 25417
Total number of attributes 30291 Average number of nodes/Vsp 25.24 Average number of paths /Vsp 11.96
Average depth / Vsp 6.12
To study the impact of similarity threshold on the quality of classification, we have conducted two experiments on the same corpus of documents (Table 2): The first test with a similarity threshold of 80% and the second with a similarity threshold of 78%. Initially, we have fixed the cluster separation threshold of 20% for both tests.
4.1
First test
[image:6.595.308.545.393.650.2]The 1200 documents integrated into the documentary warehouse are grouped into 15 clusters of documents. We obtained the results shown in Table 3:
Table 3: Results of our structural clustering process of documents.
Clusters
Nbr of
Vsp/ cluster
Nbr of Nodes/ cluster
Nbr of Paths / cluster
Average similarity
Standard dervation
C1 17 1816 344 0.96 0.051105
C2 85 6535 1302 0.98 0.021720
C3 52 3430 805 0.95 0.033968
C4 122 6241 1670 0.98 0.016195
C5 68 5465 1191 0.98 0.013503
C6 19 1655 125 0.95 0.051093
C7 226 9930 2607 0.98 0.014977
C8 49 1506 483 0.96 0.012697
C9 34 1913 467 0.99 0.009701
C10 11 800 172 0.98 0.025761
C11 328 8262 2724 0.98 0.009255
C12 16 1142 251 0.99 0.011985
C13 115 3213 960 0.99 0.009555
C14 15 798 179 0.94 0.021291
C15 43 3002 669 0.99 0.010890
paths distributed in 328 specific views. The standard deviation in average 2%, shows the cluster homogeneity.
4.2
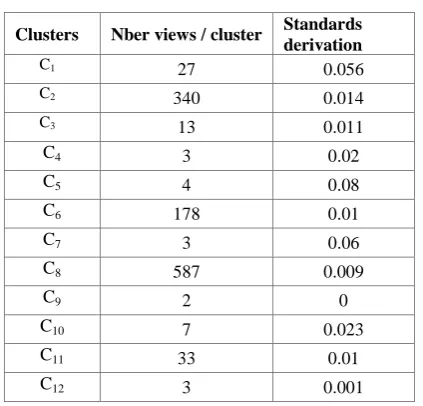
Second test
[image:7.595.59.271.166.369.2]In this case, the 1200 documents integrated into the documentary warehouse are grouped into 12 clusters of documents (Table 4).
Table 4: Results of our structural clustering process of documents
Clusters Nber views / cluster Standards derivation
C1 27 0.056
C2 340 0.014
C3 13 0.011
C4 3 0.02
C5 4 0.08
C6 178 0.01
C7 3 0.06
C8 587 0.009
C9 2 0
C10 7 0.023
C11 33 0.01
C12 3 0.001
We have observed that the number of clusters decreased (12 clusters instead to 15), against the average standard deviation intra-cluster has increased 3.16% rather than 2% in the first test. The cluster C8 represents 48.8% of the documents. The
average standard deviation 3.16%, shows that the clusters are more heterogeneous than in the first test (Table 3).
As we have described in our previous works (Idarrou and al., 10), representatives of clusters can be enriched (addition of fragments: transforming step of generic views) as and when the classification. This increases the representativeness of the clusters and therefore optimizes the storage volume of documentary warehouse. However, this transformation can lead to another problem: approximation of clusters (minimizing the distance inter-cluster) and therefore perturbing clusters. To maintain stability of clusters and preserve their quality, we propose to fix beforehand a threshold of inter-cluster separation.
We proposed to recalculate the clusters once classifying is completed. This ensures that each document is attached at the right cluster. Indeed, a document may not be attached to the right cluster for example in the case where the cluster to which it should be attached is not yet created at the time of integration of this document.
During the experiments we conducted in this work, we noted, after recalculation of clusters, that several documents have changed their cluster. They were misclassified.
We have noted the positive impact of the cluster threshold separation on the quality of clusters obtained. Specifically, when the clusters are separated sufficiently, that allows excluding the possibility of belonging of the same document to two different clusters. That's what we noticed during this experiment.
5.
CONCLUSION AND OUTLOOKS
This work is a continuation of our previous works on the structural clustering of multi-structured multimedia documents. Compared to the works that we have studied in Section 2, our approach is part of the category of approaches using graphs to represent objects for comparison. This choice is justified by the fact that the graphs are appropriate to the multimedia documents. Our approach aims to regroup a collection of heterogeneous documents and from different sources, in cluster forms of structurally homogeneous documents (while keeping the characteristics of each document: content and structure). This allows, for example, optimizing access to information relevant in a large mass of homogeneous data.
We have demonstrated that: (1) Our approach is based on a structural similarity and not on a "surface similarity". We consider that the taking into account of the relations (supplementary information), between components of documents, is a crucial parameter in our process of structural comparison. In fact, the sense of a multimedia document depends not only on the content of its components but it also depends on relations between these components. (2) The proposed measure is based on a sub-graph isomorphism based on the semantic matching paths. The path matching graphs, allows both, to preserve the contextual and hierarchical aspects of matched components, and it allows reducing the cost of combinatorial: a problem frequently discussed in the graph comparison. (3) The standard measures can’t fully respond to our problematic.
We also presented our algorithms of graph comparison and clustering of documents and we showed, through the results obtained the interest of our approach.
In our future work, we will make a comparative study with other approaches to demonstrate the quality and effectiveness of our classifier
6.
REFERENCES
[1] Bisson, La similarité: une notion symbolique/ numérique. Apprentissage symbolique-numérique. Eds Moulet, Brito, Cepadues Edition, 2000.
[2] Boeres, M., C. Ribeiro, et I. Bloch (2004). "A randomized heuristic for scene recognition by graph matching" In WEA 2004, pp. 100–113.
[3] Bruno E., Calabretto S., Murisasco E., "Documents textuels multi structurés un état de l’art", Revue i3, vol. 7, n° 1, 2007.
[4] Champin P-A., Solnon C., "Measuring the similarity of labeled graphs", In 5th International Conference on Case-Based Reasoning (ICCBR 2003), volume Lecture Notes in Artificial Intelligence 2689-Springer-Verlag, p. 80–95, 2003.
[5] Dalamagas T., Cheng T., Winkel K-J and Sellis T., "Clustering XML Documents Using Structural Summaries" , In EDBT Workshops, 2004, pp 547–556. [6] Djemal K., "De la modélisation à l’exploitation des
documents à structures multiples", Thèse de Doctorat de l’Université de Paul Sabatier, Toulouse France 2010. [7] Genane, "Contributions à une méthodologie de
[8] Idarrou A., Mammass D., Soulé-Dupuy A. and Vallès-Parlangeau N.: "A generic Approach to the Classification of Multimedia Documents: a Structures Comparison ", In ICGST-ICISP Special Issue on GVIP, December 2010. [9] Idarrou A.: "Classification de documents multimédias:
comparaison de structures", Ateliers Jeunes Chercheurs CIFED 2010, Sousse Tunisie, p 501-506.
[10]Mbarki M.,: "Gestion de l’hétérogénéité documentaire: le cas d’un entrepôt de documents multimédias", Thèse de Doctorat de Paul Sabatier Toulouse France, 2008. [11]Portier P-E, "Construction des documents multistructurés
dans le contexte des Humanités numériques ", Thèse de Doctorat de l’Institut National des Sciences Appliquées Lyon France, 2010.
[12]Schlieder T., Meuss M., Querying and Ranking XML Documents., Special Topic Issue of the Journal of the American Society of Information Science on XML and Information Retrieval, 2002.
[13]Sorlin S., Solnon C.: "Reactive Tabu Search for Measuring Graph Similarity". GbRPR 2005: 172-182
[14]Sorlin S., Sammoud O., Solnon C., Jolin JM, Mesurer la similarité de graphes, Dans Extraction de Connaissance à partir d'Images (ECOI 2006), Atelier de Extraction et Gestion de Connaissances (EGC 2006), Nicole.
[15]Sammoud O., Sorlin S., Solnon C., Ghédira K., "A comparative study of ant colony optimization and reactive search for graph matching problems" In 6th European Conference on Evolutionary Computation in Combinatorial Optimization (EvoCOP 2006), Günther Raidl and Jens Gottlieb ed. Budapest. pp. 287-301. LNCS 3906. Springer.
[16]Termier A., Rousset M.C. et Sebag., "Treefinder: a First Step towards XML Data Mining" In Proceading of ICMD 2002 p 450-457.