2016 International Conference on Computer, Mechatronics and Electronic Engineering (CMEE 2016) ISBN: 978-1-60595-406-6
An Algorithm of Suppressing Image Noise Based on Wavelet Threshold
Function and Improved Median Filtering
Liang GAI
Department of Science and Technology, HENGFENG BANK Co. Ltd., Yan Tai, CHINA
Keywords: Mixed noise, Improved median filter, Wavelet threshold, PSNR.
Abstract. For the presence of salt-and-pepper noise and Gaussian noise in image processing, an algorithm of suppressing image noise based on the wavelet threshold function and improved median filter is proposed. In this algorithm, salt-and-pepper noise is firstly estimated via the significant differences of pixel grayscale values between the salt-and-pepper noise and its surrounding, and then the 3×3 template is applied in order to filter out salt-and-pepper noise iteratively. Experimental results show that the peak signal to noise ratio (PSNR) is increased, the mean square error (MSE) is decreased and the image detail information is better preserved.
Introduction
Images are often disturbed by various noises in the process of acquisition and transmission, so as to bring influences to image segmentation and recognition process[1]. The adaptive median-weighted average hybrid filter algorithm, improved median filter and improved weighted average combining mixed noise filtering algorithm were proposed. The other algorithms, including noise suppression algorithm based on switching median filter and bayesian least square - gaussian scale mixture model[2-4], suppressing image mixed noise algorithm based on wavelet threshold function[5-6], and suppressing image mixed noise algorithm by introducing the idea of bilateral filtering[7], were proposed in succession. Aiming at the mixed noise combined with salt-and-pepper noise and Gaussian noise in images, a new algorithm based on the wavelet threshold combined with improved median filter is proposed in this paper. In this algorithm, the salt-and-pepper noise is estimated and
suppressed firstly with 33 template, then the gaussian noise in the image is processed with a new
wavelet threshold function, the new wavelet threshold function mainly apply two control variables, by changing the control variable to suppress gaussian noise.
The Estimation and Suppression of Salt-and-pepper Noise
The Estimation of Salt-and-pepper Noise
Firstly, the noise points are selected primarily in the small window. The yi,j is supposed a center pixel
gray value of the 33 template called w3, w3max and w3min are denoted respectively the biggest grey
value and the minimum gray value of total pixels in the window w3. If yi,j = w3max or yi,j = w3min, then
yi,j is considered to be the candidate noise point, marked as 1; otherwise, the yi,j is considered to be the
as signal point, marked as 0. Supposed F as mark-matrix, here:
, ,
3 3
max min
1 or =
( , ) 0
i j i j
y w y w
F i j
otherwise
(1)
However, the local extremum point is not always the noise point, if the local extremum points are always as the noise points to be filtered out, it is bound to lead unnecessary details to be lost. In this
paper, we take 33 window to confirm the suspicious noises again. The model after a second
3 7
, max , max
3 7
, min , min
( , )
or 1
0
i j i j
i j i j
F i j
y w and y w
y w and y w
otherwise (2)
Here, F(i,j)=1 denotes the pixel at the (i,j) location as noise; F(i,j)=0 denotes the pixel as signal.
The Suppression of Salt-and-pepper Noise
In this paper, the salt-and-pepper noises of the image are processed by the improved median filter, the
size of the filter window is generally greater than or equal to 33 in the salt-and-pepper noise image.
To ensure the salt-and-pepper noises of the image are suppressed well, it is not enough to filter only
once. So we adopt the square template of 33 to iterative filtering [2]. The iterative idea is to use the
window of the 33 glides on the image, if the pixels in the window are all noises, don't to process it
but to process the window which pixels are not all noises, do so repeatedly, until the end of the iteration, it is that the noise is suppressed effectively.
The Suppression of Gaussian Noise
For the problem of gauss noise in the image, the traditional soft and hard threshold function has the disadvantages of over smoothing, edge oscillation and constant deviation in image noise suppression, so a new threshold function is proposed in this paper:
W m W W e m m W W W W 2 3 ) ( ~ ) ) ln( ) 1 ln( ) 1 ( )( sgn( (3)
Here, sgn(x) denotes sign function:
1 0 sgn( ) 0 0 x x x
(4)
is threshold, it is defined as:
2 ln(M N)
(5)
In Eq.(5), is standard variance of noise, it is defined as:
6745 . 0 ) ( ~ W Median
(6)
W is original wavelet coefficients, In Eq.(6), W~ is threshold wavelet decomposition coefficient. ,
, m are control variables of greater than 0, 0<<10,10<, to regulate the size of W~, as far as possible
to shrink the deviation between W~ and W in a certain threshold range. When W <,W~is 0, but this
process also filter out mistakenly the useful information in the image, affect the details of image. To
improve the disadvantage, when W <, set W~=W3/m2, by adjusting the value of m in the case of
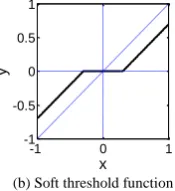
retaining the details of the image, filtering the noise effectively. Figure 1 is the curves of the
traditional hard, soft threshold function, and the threshold function of this paper, x denotes W, y
denotes W~.
-1 0 1
-1 -0.5 0 0.5 1 x y
(a) Hard threshold function
-1 0 1
-1 -0.5 0 0.5 1 x y
(b) Soft threshold function
-1 0 1
-1 -0.5 0 0.5 1 x y
[image:2.595.251.339.680.776.2](c) This paper function
From Figure 1, the algorithm here overcomes the disadvantage of the hard threshold function that is not continuous, and improves the disadvantage of the soft threshold function that exist constant deviation.
The threshold function curves of this paper are expressed in Figure 2, where and are fixed and
the value of m is changed; the definitions of x and y are as same as Figure 1. In Figure 2, the function
curve approaches to the x axis when the value of m is lr than 5, function curve approaches to the y axis
when the value of m is less than 1. Through the experimental verification, the value of m is 1.8.
-1 -0.5 0 0.5 1
-1 -0.5 0 0.5 1
x
y
m=1 m=2 m=5 m=10
(a) Function curves of different m values in this paper
-0.4 -0.2 0 0.2 0.4
-0.4 -0.2 0 0.2 0.4
x
y
m=1 m=2 m=5 m=10
[image:3.595.94.247.189.316.2](b) Local magnification of Figure 4(a)
[image:3.595.95.246.429.555.2]Figure 2. Function curves of different m values
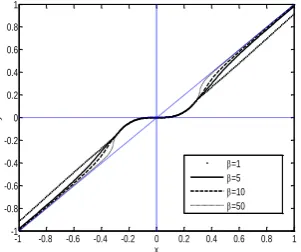
Figure 3 is the threshold function curves of this paper when , m is fixed and is taken different
values, x denotes W, y denotes W~. In Figure 3, the larger the value of , the closer W to the W~, within
a certain threshold. The changing range of the curve is small within a certain threshold when >100,
the value of is set to 100.
-1 -0.8 -0.6 -0.4 -0.2 0 0.2 0.4 0.6 0.8 1 -1
-0.8 -0.6 -0.4 -0.2 0 0.2 0.4 0.6 0.8 1
x
y
=1 =5 =10 =50
(a) Function curves of different values in this paper
-0.5 -0.4 -0.3 -0.2 -0.1 0 0.1 0.2 0.3 0.4 -0.5
-0.4 -0.3 -0.2 -0.1 0 0.1 0.2 0.3 0.4
x
y
=1 =5 =10 =50
[image:3.595.355.502.430.560.2](b) Local magnification of figure(a)
Figure 3. Function curve of different values.
Because the effect of the is to guarantee the continuity of the threshold function in this paper, the
change of the value of have not larger effect to the image, the range is 0<<10 in this paper, and its
value is 2.
Experiments
In this paper, MSE (Mean square error) and PSNR (Peak signal to noise ratio) are worked as evaluating parameters.
1 1
2 0 0
1 ˆ
( ( , ) ( , ))
M N
x y
MSE f x y f x y
M N
(7)2 10
255 10 log
PSNR
MSE
Here, f(x, y) denotes the original image, f(x,y) denotes the estimated image, and MN denotes the
size of image, the unit of PSNR is dB. The Lena gray image is worked as the testing image, which size
is 256256, salt-and-pepper noise is 0.2, and the mean is 0 of the gauss noise, the variance is 20 of the
gauss noise.
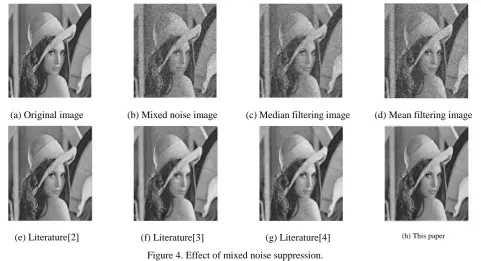
(a) Original image (b) Mixed noise image (c) Median filtering image (d) Mean filtering image
[image:4.595.62.544.133.394.2](e) Literature[2] (f) Literature[3] (g) Literature[4] (h) This paper
[image:4.595.86.248.560.689.2]Figure 4. Effect of mixed noise suppression. Table 1. MSE and PSNR of various filtering algorithms.
parameter median filtering mean filtering literature[2] literature[3] literature[4] this paper PSNR 23.7117 22.6925 24.4395 24.9134 25.3963 25.8772
MSE 276.6344 349.8085 236.3634 209.76885 183.8443 168.0198
The noise suppression effects of different algorithms are shown in Figure 4, table 1 and Figure 5. The suppressing noise effect of the algorithm in this paper is better than the median filtering, mean filtering, the literature, the literature and the literature. The value of the MSE and PSNR of various algorithms are shown in table 1, the PSNR is increased via the algorithm proposed in this paper, and the MSE is decreased compared with other algorithms.
0 10 20 30 40 50 60 22.5
23 23.5 24 24.5 25 25.5 26
cycles
PSN
R
median mean literature[3] literature[4] literature[5] this article
(a) PSNR curves of different algorithms
0 10 20 30 40 50 60 160
180 200 220 240 260 280 300 320 340 360
Cycles
M
SE
median mean literature[3] literature[4] literature[5] this article
[image:4.595.347.508.561.691.2](b) MSE curves of different algorithms
Figure 5. The PSNR and the MSE of different algorithms.
Conclusions
estimated. To ensure a good precondition for the subsequent image processing noise. For Gauss noise, new wavelet threshold function with the idea of limitation is applied, and the appropriate control
variables m and are proposed to decrease the deviation between the wavelet coefficients and the
original wavelet coefficients. The experiment results show that the noise mixed by both of the salt-and-pepper noise and the Gaussian noise is effectively suppressed. The image information is better preserved.
References
[1] Atanassov KT. Intuitionistic fuzzy sets [J]. Fuzzy Sets & Systems, 1986, 20(1):87-96.
[2] Wu De-gang, Zhao Li-ping. A Filtering Algorithm for Removing Image Mixed Noise [J]. Journal of automation instrumentation, 2012,33(09):11-13.
[3] Yang Xing-fang, Huang Yu-mei, Li Yan. An effective filtering algorithm for mixed noise removal [J]. Journal of mechanical science and technology, 2013,32(1):126-129.
[4] Jiang Chun-miao, Zhou Zhuo-feng. An effective method to remove Gauss impulse noise from images [J]. Journal of Computer Engineering and Applications, 2009,45(24):183-185.
[5] Chen Xiao-xi, Wang Yan-jie, Liu Lian. Deep study on wavelet threshold method for image noise removing [J]. Laser & Infrared, 2012,(01):105-110.
[6] Gao Shan, Li Cheng, Bi Du-yan. Method for effectively filtering high intensity image mixed noise [J]. Journal of computer aided design and computer graphics, 2012,(05):656-661.