N A N O E X P R E S S
Open Access
Dramatically enhanced non-Ohmic properties and
maximum stored energy density in ceramic-metal
nanocomposites: CaCu
3
Ti
4
O
12
/Au nanoparticles
Wattana Tuichai
1, Saowalak Somjid
1, Bundit Putasaeng
2, Teerapon Yamwong
2, Apiwat Chompoosor
3,4*,
Prasit Thongbai
3,4*, Vittaya Amornkitbamrung
3,4and Santi Maensiri
5Abstract
Non-Ohmic and dielectric properties of a novel CaCu3Ti4O12/Au nanocomposite were investigated. Introduction of 2.5 vol.% Au nanoparticles in CaCu3Ti4O12ceramics significantly reduced the loss tangent while its dielectric permittivity remained unchanged. The non-Ohmic properties of CaCu3Ti4O12/Au (2.5 vol.%) were dramatically improved. A nonlinear coefficient of≈17.7 and breakdown electric field strength of 1.25 × 10⁴V/m were observed. The maximum stored energy density was found to be 25.8 kJ/m3, which is higher than that of pure CaCu3Ti4O12by a factor of 8. Au addition at higher concentrations resulted in degradation of dielectric and non-Ohmic properties, which is described well by percolation theory.
Keywords:Nanocomposite; Dielectric permittivity; Percolation threshold; Varistor
Background
Ceramic materials with high dielectric permittivity (ε′) have been intensively studied because of their potential for multilayer ceramic capacitor applications. The dielec-tric materials used in these devices must exhibit a high
ε′ with very low loss tangent (tanδ). They also need to have a high breakdown voltage to support high-energy density storage applications. The energy density (U) per-formance of capacitors can be expressed asU¼ε′ε0E2b=2,
whereEbis electric field breakdown strength [1]. Recently, dielectric ceramics homogeneously filled with metallic particles have been of considerable scientific and tech-nological interest. This is due to their greatly enhanced dielectric response as well as an improved tunability of ε′ [2-11]. Generally, ε′ increases rapidly in the region of the percolation threshold (PT) [4,9]. For the Ag-Ba0.75Sr0.25TiO3 composite [9], the large increase in ε′ was suggested to result from the percolation ef-fect. Improved tunability of Ba0.75Sr0.25TiO3 ceramics
was hypothesized to be the effect of either large induced internal electric fields within the thin Ba0.75Sr0.25TiO3 layer sandwiched by electrode-like metallic Ag particles or improved densification of ceramic composites. However, Eb of a metal-ceramic composite abruptly decreased as the metallic filler concentration increased to PT [4].
CaCu3Ti4O12 (CCTO) is one of the most interesting ceramics because it has high ε′values. CCTO polycrys-talline ceramics can also exhibit non-Ohmic properties [12-20]. These two properties give CCTO potential for applications in capacitor and varistor devices, respec-tively. Unfortunately, high tanδ (>0.05) of CCTO cera-mics is still one of the most serious problems preventing its use in applications [10,12,17]. The application of CCTO ceramics in varistor devices was limited by their low nonlinear coefficient (α) and Eb values. For energy storage devices, both ε′andEbneed to be enhanced in order to make high performance energy-density capaci-tors. Therefore, investigations to systematically improve CCTO ceramics properties are very important.
Methods
In this work, CaCu3Ti4O12 powder was prepared by a solid state reaction method. First, CaCO3, CuO, and TiO2 were mixed homogeneously in ethanol for 24 h
* Correspondence:[email protected];[email protected]
3
Department of Physics, Faculty of Science, Khon Kaen University, Khon Kaen 40002, Thailand
4
Nanotec-KKU Center of Excellence on Advanced Nanomaterials for Energy Production and Storage, Khon Kaen 40002, Thailand
Full list of author information is available at the end of the article
using ZrO2 balls. Second, the resulting mixture was dried and then ground into fine powders. Then, dried powder samples were calcined at 900°C for 6 h. HAuCl4, sodium citrate, and deionized water were used to prepare Au NPs by the Turkevich method [21]. CCTO/Au nano-composites with different Au volume fractions of 0, 0.025, 0.05, 0.1, and 0.2 (abbreviated as CCTO, CCTO/Au1, CCTO/Au2, CCTO/Au3, and CCTO/Au4 samples, re-spectively) were prepared. CCTO and Au NPs were mixed and pressed into pellets. Finally, the pellets were sintered in air at 1,060°C for 3 h.
X-ray diffraction (XRD; Philips PW3040, Philips, Eindhoven, The Netherlands) was used to characterize the phase formation of sintered CCTO/Au nanocom-posites. Scanning electron microscopy (SEM; LEO 1450VP, LEO Electron Microscopy Ltd, Cambridge, UK) coupled with energy-dispersive X-ray spectrometry (EDS) were used to characterize the microstructure of these materials. Transmission electron microscopy (TEM) (FEI Tecnai G2, FEI, Hillsboro, OR, USA) was used to re-veal Au NPs. The polished surfaces of sintered CCTO/Au samples were coated with Au sputtered electrode. Dielec-tric properties were measured using an Agilent 4294A Precision Impedance Analyzer (Agilent Technologies, Santa Clara, CA, USA) over the frequency range from 102 to 107Hz with an oscillation voltage of 0.5 V.
[image:2.595.57.291.524.704.2]Results and discussion
Figure 1 shows the XRD patterns of the CCTO/Au nanocomposites, confirming the major CCTO matrix phase (JCPDS 75–2188) and the minor phase of Au filler (JCPDS 04–0784). An impurity phase of CaTiO3(CTO) was also observed in the XRD patterns of the CCTO/Au samples. The intensity ratio between the (111) peak of Au and the (200) peak of CCTO was found to increase
with increasing Au concentrations. Lattice parameters of the CCTO phase for the CCTO, CCTO/Au1, CCTO/ Au2, CCTO/Au3, and CCTO/Au4 samples were calcu-lated to be 7.391, 7.391, 7.391, 7.390, and 7.390 Å, re-spectively. These parameters are nearly the same in value and are comparable to those reported in the litera-ture [12,16,17]. This means that Au was not substituted into any sites in the CCTO lattice.
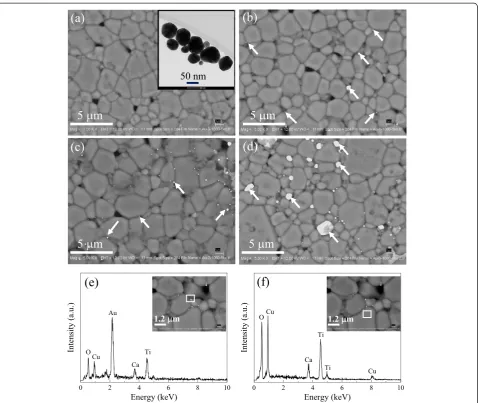
The distribution of the Au filler in the microstructure of CCTO matrix is revealed in Figure 2a,b,c,d. The inset of Figure 2a shows the TEM image of Au NPs with par-ticle sizes of about 50 to 100 nm. Two distinct phases were observed, consisting of regular grains and light particles appearing as spots, which are indicated by arrows. The amount and particle size of the lighter phase increased with increasing Au NP concentrations. Figure 2e,f shows the EDS spectra of the CCTO/Au1 sample at the location of a light particle (inset of panel e) and a regular grain (inset of panel f ), respectively. It is important to mention that before the SEM and EDS techniques were performed, surfaces of all the CCTO/Au samples were not coated with Au sputtered layer in order to identify the Au NPs in the CCTO matrix. Therefore, the light particles are clearly indicated as Au phase. Most of Au particles are located at the grain boundary (GB) or at the triple point junction between grains.
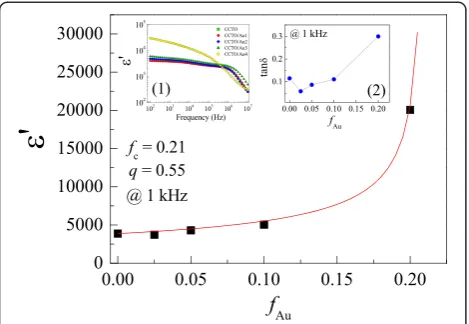
In Figure 3, ε′values at 1 kHz and RT for the CCTO, CCTO/Au1, CCTO/Au2, CCTO/Au3, and CCTO/Au4 samples were found to be 3,864, 3,720, 4,293, 5,039, and 20,060, respectively. Their tanδvalues were 0.115, 0.058, 0.087, 0.111, and 0.300, respectively (inset (2)). The low-frequency ε′ and tanδ of the CCTO, CCTO/Au1, CCTO/Au2, and CCTO/Au3 samples were slightly dif-ferent (inset (1)). Bothε′and tanδwere strongly enhanced as the concentration of Au NP filler was increased to 20 vol.%. Generally, dramatic changes in metal-insulator matrix composites in the critical region are attributed to the percolation effect [4,7,9,17,22-24]. A rapid increase in effective dielectric constant (ε′eff) of the composites can be described by the power law [4,9,22,24]:
ε0
eff ¼ε0matrix
fc−f
fc
−q; ð1Þ
where ε′matrix is the dielectric constant of the insulator matrix,fcis the PT,fis the volume fraction of conductive filler, andqis a critical component. As shown in Figure 3, the dependence ofε′ on the volume fraction of Au NPs can be well described by Eq. (1). From the fitted result,fc
andqwere found to be 0.21 and 0.55, respectively. In the case where conductive fillers were in spherical form, the PT of the two-phase random composite was theoretically calculated to be 0.16 [22,24]. fc of the CCTO/Au system was larger than the calculated value (0.16). However, the
critical exponent (q≈0.55) was lower than the lower limit of the normal range (q≈0.8 to 1), indicating a slow in-crease inε′with increasing metal content. Deviation offc andqfrom percolation theory may be due to the agglom-eration of Au NPs to form large Au particles in the CCTO matrix, as clearly seen in Figure 2d. fc of the CCTO/Au system is comparable to those observed in the Ba0.75Sr 0.25-TiO3/Ag (fc= 0.285) [9] and BaTiO3/Ni (fc= 0.232 to 0.310) [4,7] microcomposite systems. In the cases of the nanocomposite systems of PbTiO3/Ag [8] and Pb0.4Sr0.6TiO3/ Ag [11],fcvalues were found to be 0.16. Actually, the obtained fcandqmight not be highly accurate values or not the best values due to a large range of Au NPs volume fraction be-tween 0.1 and 0.2. However, one of the most important factors for the observed higher fc for the CCTO/Au system clearly suggested a morphology transition from
[image:3.595.60.539.87.490.2]nanocomposite to microcomposite as Au NP concentra-tion was increased to 20 vol.%. This result is consistent to the microcomposite systems of Ba0.75Sr0.25TiO3/Ag [9] and BaTiO3/Ni [4,7]. Generally, the distribution of fillers in a matrix has an influence on the value offc. For sphe-rical fillers,fcof randomly distributed fillers is given by the ratio between the particle size of the matrix phase (R1) and the filler (R2) [22]. WhenR1/R2≈1 orR1≈R2, we ob-tainfc≈0.16. AsR1/R2> > 1 orR1> >R2, the fillers fill the interstitial space between the matrix phase particles, resulting in a continuous percolating cluster of the filler at fc<0.16. As shown in Figure 2, the particle size of CCTO (R1) is larger than that of Au NPs (R2), i.e., R1/R2> > 1. Theoretically, fcof the CCTO/Au NP system should be lower than 0.16. However, the observed fc value in the CCTO/Au system was found to be 0.21. Therefore, it is
Figure 2SEM backscattered images of (a) CCTO, (b) CCTO/Au1, (c) CCTO/Au2, and (d) CCTO/Au3 samples; (e, f) EDS spectra of the
CCTO/Au1 sample.The inset of(a)shows TEM image of Au NPs.(e, f)EDS spectra of the CCTO/Au1 sample detected at a bright particle on GB
strongly indicated that the primary factor that has a great effect onfcis the agglomeration of the Au filler.
Large increases in ε′ of percolating composites are generally attributed to formation of microcapacitor networks in the composites and/or Maxwell-Wagner polarization [4,9,22]. For pure CCTO ceramics, the giant dielectric response is normally associated with the mean grain size [16,17,25]. Although there is a small amount of relatively large grains (5 to 10μm) in the microstruc-ture of CCTO/Au3 and CCTO/Au4 (data not pre-sented), the large observed enhancement of ε′ is likely due to the percolation effect.
According to the effective medium theory [26], the average microscopic electric field inside the ceramic matrix filled with conductive particles increases in the region of the PT, which results in a significant decrease in Eb. Figure 4 shows the non-Ohmic properties of the CCTO/Au nanocomposites as a plot of electrical current density (J) vs. electric field strength (E). α values of the CCTO, CCTO/Au1, CCTO/Au2, CCTO/Au3, and CCTO/Au4 samples were calculated in the range of J= 1 to 10 mA/cm2and found to be 7.38, 17.67, 11.08, 5.05, and 3.08, respectively. Eb values (obtained at J= 1 mA/cm2) were found to be 4.26 × 10³, 1.25 × 10⁴, 1.17 × 10⁴, 2.50 × 10³, and 7.84 × 10² V/cm, respectively.α and Eb initially showed a strong increase with introduction of 2.5 to 5.0 vol.% of Au NPs into CCTO (inset of Figure 4). Both parameters greatly decreased with further increasing Au NPs from 10 to 20 vol.%, which is due to the percola-tion effect [4]. In the region of the PT, electrical conduc-tion in composites increased dramatically, resulting in a large decrease in Eb. This observation is consistent with the effective medium theory [26]. Therefore, it is reason-able to suggest that the increases inε′and tanδobserved
in the CCTO/Au4 sample were mainly attributed to the percolation effect; while, the effect of grain size effect is slight.
The CCTO/Au1 sample exhibited the best non-Ohmic properties among all samples. These values are compa-rable to those observed in CaCu3Ti3.8Sn0.2O12 ceramic [27]. There are many factors that are potentially respon-sible for strong improvement of non-Ohmic properties. It was found that the non-Ohmic properties of CCTO ceramics could effectively be improved by fabricating composite systems of CCTO/CTO [28,29]. As shown in Figure 1, the observed CTO phase in all of the CCTO/Au composites tended to increase with increasing Au con-tent. However, the non-Ohmic properties of CCTO/Au strongly degraded as the Au filler concentration in-creased. Thus, the excellent non-Ohmic properties of the CCTO/Au1 sample are not mainly caused by a CTO phase. For CCTO polycrystalline ceramics, the non-Ohmic behavior is due to the existence of Schottky barriers at the GBs [13]. Thus, the existence of metallic Au NPs at the GBs of CCTO ceramics may contribute the formation of Schottky barriers at GBs. However, the mechanism by which Au NPs contribute to enhancement of non-Ohmic properties is still unclear.
[image:4.595.305.540.88.258.2]It is worth noting that improved nonlinear properties of the CCTO/Au1 sample may also be related to modifi-cation of microstructure. Although the introduction of metallic particles in a ceramic matrix with concentration near the PT can dramatically enhance the dielectric re-sponse, a large increase in the conduction of charge car-riers was observed simultaneously, leading to decreases in Eb and energy density. The maximum stored energy densities of all the samples were calculated and found to be 3.11, 25.8, 26.0, 1.39, and 0.54 kJ/m3 for the CCTO, CCTO/Au1, CCTO/Au2, CCTO/Au3, and CCTO/Au4 samples, respectively. Notably, introduction of Au NPs
Figure 4J-Ecurves of CCTO/Au nanocomposites.The inset shows values ofEbandαas a function of Au concentration. Figure 3The dependence of Au volume fraction onε′at RT for
CCTO/Au nanocomposites.The symbols and solid curve represent
the experimental data and the fitted curve, respectively. Insets 1 and 2 show the frequency dependence ofε′at RT and tanδ
[image:4.595.57.292.89.251.2]into CCTO ceramics in small concentrations, between 2.5 and 5.0 vol.%, caused a strong increase in the max-imum stored energy density as well as their non-Ohmic properties.
Conclusions
In conclusion, the investigation of non-Ohmic and di-electric properties of CCTO/Au revealed that addition of Au NPs to CCTO in the concentration of 2.5 vol.% can decrease tanδ, while ε′ was unaltered. The non-Ohmic properties of this composition were also suc-cessfully improved showing α≈17.7 and Eb≈1.25 × 10⁴ V/cm. The maximum stored energy density of CCTO ceramics were significantly enhanced by intro-ducing of Au NPs in concentrations of 2.5 to 5.0 vol.%. The dielectric and non-Ohmic properties as well as energy density were degraded when Au NP concentrations were greater. The mechanisms of dielectric response and non-Ohmic properties can be well described by using the percolation theory.
Competing interests
The authors declare that they have no competing interests.
Authors’contributions
WT carried out all the experiments, except for the preparation of Au nanoparticles. SS prepared Au nanoparticles. BP and TY offered technical support for the dielectric and I-V measurements. AC and PT supervised the research, designed the experiments, and participated in preparing the draft of the manuscript. PT revised the manuscript. VA and SM gave suggestions on the study. All authors read and approved the final manuscript.
Acknowledgements
This work was financially supported by the Nanotechnology Center (NANOTEC), NSTDA, Ministry of Science and Technology, Thailand, through its program of Center of Excellence Network. WT extends his gratitude to the Thailand Graduate Institute of Science and Technology (TGIST) for his Master of Science Degree scholarship.
Author details
1
Materials Science and Nanotechnology Program, Faculty of Science, Khon Kaen University, Khon Kaen 40002, Thailand.2National Metal and Materials
Technology Center (MTEC), Thailand Science Park, Pathumthani 12120, Thailand.3Department of Physics, Faculty of Science, Khon Kaen University,
Khon Kaen 40002, Thailand.4Nanotec-KKU Center of Excellence on Advanced Nanomaterials for Energy Production and Storage, Khon Kaen 40002, Thailand.5School of Physics, Institute of Science, Suranaree University, Nakhon Ratchasima 30000, Thailand.
Received: 3 October 2013 Accepted: 16 November 2013 Published: 21 November 2013
References
1. Song Y, Shen Y, Hu P, Lin Y, Li M, Nan CW:Significant enhancement in energy density of polymer composites induced by dopamine-modified Ba0.6Sr0.4TiO3 nanofibers.Appl Phys Lett2012,101:152904.
2. Halder N, Sharma AD, Khan SK, Sen A, Maiti HS:Effect of silver addition on the dielectric properties of barium titanate based low temperature processed capacitors.Mater Res Bull1999,34:545.
3. Duan N, ten Elshof JE, Verweij H, Greuel G, Dannapple O:Enhancement of dielectric and ferroelectric properties by addition of Pt particles to a lead zirconate titanate matrix.Appl Phys Lett2000,77:3263.
4. Pecharromán C, Esteban-Betegón F, Bartolomé JF, López-Esteban S, Moya JS:New percolative BaTiO3–Ni composites with a high and
frequency-independent dielectric constant (εr≈80000).Adv Mater
(Weinheim, Ger)2001,13:1541.
5. Chen R, Wang X, Gui Z, Li L:Effect of silver addition on the dielectric properties of barium titanate-based X7R ceramics.J Am Ceram Soc2003, 86:1022.
6. Jayadevan KP, Liu CY, Tseng TY:Dielectric characteristics of
nanocrystalline Ag–Ba0.5Sr0.5TiO3 composite thin films.Appl Phys Lett
2004,85:1211.
7. Chen Z, Huang J, Chen Q, Song C, Han G, Weng W, Du P:A percolative ferroelectric–metal composite with hybrid dielectric dependence.
Scr Mater2007,57:921.
8. Wang Z, Hu T, Tang L, Ma N, Song C, Han G, Weng W, Du P:Ag nanoparticle dispersed PbTiO3percolative composite thin film with high permittivity.
Appl Phys Lett2008,93:222901.
9. Huang J, Cao Y, Hong M, Du P:Ag–Ba0.75Sr0.25TiO3 composites with excellent dielectric properties.Appl Phys Lett2008,92:022911.
10. Chen C, Wang C, Ning T, Lu H, Zhou Y, Ming H, Wang P, Zhang D, Yang G: Enhanced nonlinear current–voltage behavior in Au nanoparticle dispersed CaCu3Ti4O12composite films.Solid State Commun2011, 151:1336.
11. Wang Z, Hu T, Li X, Han G, Weng W, Ma N, Du P:Nano conductive particle dispersed percolative thin film ceramics with high permittivity and high tunability.Appl Phys Lett2012,100:132909.
12. Subramanian MA, Li D, Duan N, Reisner BA, Sleight AW:High dielectric constant in ACu3Ti4O12and ACu3Ti3FeO12phases.J Solid State Chem 2000,151:323.
13. Chung S-Y, Kim I-D, Kang S-JL:Strong nonlinear current–voltage behaviour in perovskite-derivative calcium copper titanate.Nat Mater
2004,3:774.
14. Li J-y, Xu T-w, Li S-t, Jin H-y, Li W:Structure and electrical response of CaCu3Ti4O12ceramics: effect of heat treatments at the high vacuum.
J Alloys Compd2010,506:L1.
15. Li J, Jia R, Tang X, Zhao X, Li S:Enhanced electric breakdown field of CaCu3Ti4O12ceramics: tuning of grain boundary by a secondary phase.
J Phys D Appl Phys2013,46:325304.
16. Thongbai P, Jumpatam J, Putasaeng B, Yamwong T, Maensiri S:The origin of giant dielectric relaxation and electrical responses of grains and grain boundaries of W-doped CaCu3Ti4O12ceramics.J Appl Phys2012, 112:114115.
17. Liu L, Fan H, Fang P, Chen X:Sol–gel derived CaCu3Ti4O12ceramics: synthesis, characterization and electrical properties.Mater Res Bull1800, 2008:43.
18. Kashyap R, Thakur OP, Tandon RP:Study of structural, dielectric and electrical conduction behaviour of Gd substituted CaCu3Ti4O12ceramics.
Ceram Int2012,38:3029.
19. Sulaiman MA, Hutagalung SD, Ain MF, Ahmad ZA:Dielectric properties of Nb-doped CaCu3Ti4O12electroceramics measured at high frequencies.
J Alloys Compd2010,493:486.
20. Masingboon C, Eknapakul T, Suwanwong S, Buaphet P, Nakajima H, Mo SK, Thongbai P, King PDC, Maensiri S, Meevasana W:Anomalous change in dielectric constant of CaCu3Ti4O12under violet-to-ultraviolet irradiation.
Appl Phys Lett2013,102:202903.
21. Bastús NG, Comenge J, Puntes V:Kinetically controlled seeded growth synthesis of citrate-stabilized gold nanoparticles of up to 200 nm: size focusing versus ostwald ripening.Langmuir2011, 27:11098.
22. Nan CW, Shen Y, Ma J:Physical properties of composites near percolation.Annu Rev Mater Res2010,40:131.
23. Dang Z-M, Yuan J-K, Zha J-W, Zhou T, Li S-T, Hu G-H:Fundamentals, processes and applications of high-permittivity polymer–matrix composites.Prog Mater Sci2012,57:660.
24. Nan C-W:Physics of inhomogeneous inorganic materials.Prog Mater Sci
1993,37:1.
25. Adams TB, Sinclair DC, West AR:Giant barrier layer capacitance effects in CaCu3Ti4O12ceramics.Adv Mater (Weinheim, Ger)2002,14:1321. 26. Pecharromán C, Iglesias J:Effective dielectric properties of packed
mixtures of insulator particles.Phys Rev B Condens Matter1994, 49:7137.
28. Ramírez MA, Bueno PR, Varela JA, Longo E:Non-Ohmic and dielectric properties of a CaCu3Ti4O12polycrystalline system.Appl Phys Lett2006, 89:212102.
29. Thongbai P, Putasaeng B, Yamwong T, Maensiri S:Improved dielectric and non-ohmic properties of Ca2Cu2Ti4O12ceramics prepared by a polymer pyrolysis method.J Alloys Compd2011,509:7416.
doi:10.1186/1556-276X-8-494
Cite this article as:Tuichaiet al.:Dramatically enhanced non-Ohmic properties and maximum stored energy density in ceramic-metal nanocomposites: CaCu3Ti4O12/Au nanoparticles.Nanoscale Research Letters20138:494.
Submit your manuscript to a
journal and benefi t from:
7 Convenient online submission
7 Rigorous peer review
7 Immediate publication on acceptance
7 Open access: articles freely available online
7 High visibility within the fi eld
7 Retaining the copyright to your article