IMPROVEMENT OF VOLTAGE SAG MITIGATION USING DYNAMIC
VOLTAGE RESTORER (DVR)
Hadi Suyono1, Lauhil Mahfudz Hayusman2 and Moch. Dhofir1
1Department of Electrical Engineering, Brawijaya University, Malang, Indonesia
2Department of Electrical Engineering, National Technology Intitute, Malang, Indonesia
E-Mail: [email protected]
ABSTRACT
The modeling and analysis of Dynamic Voltage Restorer (DVR) implementation for improving the voltage sag due to the motor starting and disturbance occurred in the system is discussed in this paper. DVR is installed through a transformer in series connection between the feeder and a sensitive load to compensate the voltage sag. To show the impact of DVR implementation, the dynamic analysis is performed with the following short-circuit scenarios such as single-phase-, double-phase-single-phase-, and three-phase to ground faults. In additionsingle-phase-, the voltage sag due to the motor starting is also investigated in this paper. Based on the simulation results show that the voltage sag reach 0.83pu, 0.78pu, and 0.69pu for the single-, double-, three-phase to ground faults implemented respectively. The DVR implementation mitigates the voltage sag with improving the voltage up to 0.99pu, 0.95pu, and 0.91pu for the single-, double-, three-phase to ground faults cases respectively. The DVR implementation also improves the voltage profile during the motor starting of the largest motor load with a capacity of 55 kW up to 0.99pu instead of without the DVR implementation which the voltage sag reach to 0.92pu. The increasing of voltage profile improvement on the system will need more active and reactive powers acquired from the DVR.
Keywords: short-circuit, motor starting, voltage sag, dynamic voltage restorer (DVR).
INTRODUCTION
Voltage sag is a decrease in voltage with a short duration due to disturbances occurred in the system and starting the motor with a large capacity. In general, the voltage sag will affect to the operational continuity of industry process because it can damage and disrupt the performance of sensitive equipment such as relays, contactors, PLCs with the changing of the voltage [1]. Based on the IEEE standard 1159-1995, the duration of voltage sag is about 0.5 cycles to 1 minute while the voltage magnitude ranging between 0.1 and 0.9 pu [2].
For supporting the industrial process, load motors are very large implemented. However, the device control and power electronic (converter/inverter) control of motors have an adverse effect to the system, especially during the motor starting and large disturbance. During motor starting, with the nominal voltage, the current starting will acquire of 6-10 times of the nominal current to gain the sufficient starting rotating torque [3]. The large starting current will be suddenly withdrawn from the power system and as an impact the voltage sag will occur. The adverse consequences of voltage sag will cause preventing the motor acceleration to reach the nominal speed and also cause failed operation of the other equipment such as contactor, relay, electronic equipment and etc.
There are some devices has been implemented to improve the voltage sag during the motor starting such as capacitor, Star-Delta Starter, Auto Transformer Motor Starting, Dynamic Voltage Restorer (DVR), and etc.
However, the DVR has main capability to compensate voltage sag, improving power factor and minimizing harmonics [4]. The implementation of DVR has energy storage capacity with low maintenance costs compared with UPS (uninterruptible power supply) and SMEs (Superconducting Magnetic Energy Storage) devices. In addition, DVR has a smaller size comparing with the Distribution Static Compensator (DSTATCOM).
The modeling and analysis of custom power controllers by using DVR has been proposed by Anaya-Lara and Acha [5]. The simulation results indicate that the DVR can compensate voltage sag up to 98% of the nominal voltage during 300-600ms. The DVR capability to compensate the power and voltage sag is mainly determined by two factors, namely rating dc equipment storage and the characteristics of the coupling transformers.
The design and implementation of the DVR in industrial power system with large motors is discussed in this paper. The paper presents power system simulation using the Dynamic Voltage Restorer (DVR), which is part of the Flexible AC Transmission System (FACTS) to improve voltage profile against momentary voltage reduction (voltage sag) due to motor starting problems in the industry. The simulation conducted by using the PSCAD/EMTDC.
DYNAMIC VOLTAGE RESTORER (DVR)
momentary voltage drop. DVR is installed through a transformer in series connection to the feeder and to compensate for voltage sensitive loads in the event of disruption. In general, the configuration of the DVR is given in Figure-1 that consists of four main block components namely: injection/coupling transformers, voltage source converter (VSC), filters, and energy storage [6].
Injection/coupling transformers
Three single-phase transformers are connected in series with a distribution feeder coupled with Voltage Source Converter (VSC) for high-voltage level distribution. The basic function of the injection/coupling transformers are as electrical insulation and to increase the supply of low AC voltage generated by the VSC to produce the desired voltage [7]. The injection/coupling transformers with star and delta connection type is given in Figure-2.
Figure-1. Dynamic voltage restorer (DVR) [6].
Fr
o
m
V
S
C
Fr
o
m
V
S
C
So
u
rc
e
si
d
e
So
u
rc
e
si
d
e
Lo
a
d
s
id
e
(a) (b)
L
o
ad
si
d
e
Figure-2. Connection model of injection/coupling transformers for high voltage level (a) star/open
connection (b) delta/open connection [8].
Voltage Source Converter (VSC)
Pulse-width modulation inverter (PWM-inverter) is used for the VSC, which consist of switching
Transistors). The basic function of the inverter is to convert DC voltage generated by the energy storage devices into an AC voltage required by the injection/coupling transformers. The PWM-VSC is shown in Figure-3.
Injection/ coupling transformer
Source
PWM-VSC
Critical load
Figure-3. PWM-VSC model in the series DVR [9].
Passive filters
Passive filter consists of a capacitor that is placed on the side of the line or at the inverter side of the injection/coupling transformers. The advantage of placing a filter on the side of the inverter is to prevent the harmonics flow through the coil of the transformer. The disadvantage of the filter is that voltage drop and phase shift at the voltage injection. It can affect the control circuit of the DVR. The location of filter on the line can overcome this deficiency (leakage reactance of the transformer can be used as a filter inductor). The filter placement can be seen in Figure-4.
Energy storage
The energy storage function is to produce active power to supply the load at the time the voltage sag. Batteries, lead-acid, flywheel or SMEs (superconducting Magnetic Energy Storage) can be used for energy storage.
Figure-4. Difference filter placement (a) line side, (b). inverter side [10].
The operating principle of DVR
the calculation of reference currents generated by the error signal between the load voltage with a reference voltage signal is processed by the PWM reference signal obtained from the calculation. The reference signal is then modulated with the carrier signal (triangular wave) in the form of saw tooth signals (saw tooth). This error signal is modulated with a sinusoidal-shaped saw tooth signal as the signal carrier. PWM output from above is used for triggering the switching circuit which consists of 6 IGBT. The output voltage alternating current (AC) generated by PWM-voltage inverter will be increased by injection/coupling transformers to compensate for voltage sag that occurs in the critical load.
MODELING SYSTEM AND INPUT DATA
Power system data
The power system to be investigated has the load of 7.124MVA with the power factor 0.85. The system is supplied from the grid through three-phase transformer of 2x8MVA, 20kV/380V. The system loads are static load and induction motors with the total motors are about 39 units.
DVR data
Data input for the DVR series is obtained according to the calculation, including determining the size of capacitors, dc voltage for data storage/VDC, line-side filter and transformer. The data conline-sidered are as follows: Capacitors, Cdc=0.023 µF; Voltage dc storage,
Vdc=5 kV; Line side filter C=10 µF; kV transformers
380Volt/5 kV. The design of the power system with implementation of the DVR by using PSCAD/EMTDC is given in Figure-5. To determine the optimum location of DVR, the load flow analysis is performed. Based on the load flow analysis, the worst voltage bus profile will be determined and as a candidate for the optimum location of DVR. In this case, the DVR is installed at main intake bus MDP P2.1.
Figure-5. Implementation of DVR in power system.
RESULTS AND DISCUSSIONS
Dynamic simulation results
The proposed dynamic simulation of disturbances (short circuit) and motor starting scenarios performed are done with the following events: 1) the power system performed in normal condition from 0.0s to 0.5s in early state; 2) implement the short circuit or motor starting conditions for the duration of 0.45s started at t = 0.5s; 3) remove the short-circuit and rerun the simulation until 2.0s.
The dynamic performance in term of the voltage profile, power and current flows in the system during the motor starting is analyzed with and without implementation of the DVR. To perform the dynamic performance, the proposed scenarios of the motor starting are as follows:
a) Scenario 1: single phase to ground fault (SPTGF) b) Scenario 2: double phase to ground fault (DPTGF) c) Scenario 3: three phase to ground fault (TPTGF) d) Scenario 4: one of the largest motor starting with a
capacity of 55 kW.
Scenario 1: single phase to ground fault (SPTGF)
Before DVR installation
At the initial condition in which the state of the system under normal circumstances, from t = 0s to t = 0.5s, the voltage response is about 1pu on the rating
V=380Volt. The SPTGF then implemented at the location near the main intake of the power supply at t = 0.5s, and voltage sag starts happening until SPTGF removed from the system at t = 0.95s. The resulting voltage drop due to interference SPTGF is reached 0.834pu. After SPTGF removed from the system at t = 1.0s, the voltage on the system back to normal i.e. 1.0pu until t = 2.0s. The voltage response waveform without DVR on the system is illustrated in Figure-6.
Figure-6. Voltage waveform for SPTGF without DVR.
In the event of interruption, the short-circuit current will rise and the system absorbs more power to maintain voltage rating. However, due to the limited availability of the power resources, then this causes voltage sag and power flows in the system are also decreased. The high of the required load in the system during the disturbance, while the supplying power was inadequate, will then impact to the reduction of voltage, and active/reactive powers will be greater.
Figure-7. Active and reactive powers waveform for SPTGF without DVR.
After DVR installation
Prior to the installation of DVR voltage sag that occurs due to an interruption SPTGF is Vrms = 0.834pu. With the installation of the DVR system, the voltage on the system tries to maintain the normal voltage is Vrms = 1pu, but the voltage sag slightly persists with a decrease of Vrms = 0.992pu. However, with the implementation of the DVR, voltage sag can be improved significantly of 19.28% compared without the DVR. After t = 1.0s to t = 2.0s, the system voltage returns to normal in Vrms = 1.0pu. Voltage waveform with the installation of DVR can be seen in Figure-8.
Figure-8. Voltage waveform for SPTGF with DVR.
Waveform active and reactive powers required at the time of the SPTG fault with DVR implementations are given in Figure-9. In the Figure, it can be seen that the waveforms of active and reactive powers under normal conditions are about 3.3MW and 2.5MVAR respectively. While at the time of the SPTG fault, with the installation of DVR, the active and reactive powers absorbed by the system are about 3.26MW and 2.49MVAR respectively. The power absorbed by the system before, during and after the SPTG fault is approximately the same and thus the voltage response also showed the similar result response.
Figure-9. Active and reactive powers waveform for SPTGF with DVR.
Scenario 2: double phase to ground fault (DPTGF)
Before DVR installation
The responses of voltage and power required in the systems in the event of DPTG fault without DVR implementation are given in Figures 10 and 11 respectively. At the time of DPTG fault condition, i.e. during the period t = 0.5s to t = 0.95s, voltage sag occurs with a reduced voltage until the Vrms = 0.775pu. However, after the disturbance is eliminated at t = 0.95s until t = 2.0s, the voltage returns to normal in Vrms = 1.0pu.
Figure-10. Voltage waveform for DPTGF without DVR.
Figure-11. Active and reactive powers waveform for DSPTGF without DVR.
In Figure-11 it can be seen that the waveforms of active and reactive powers under normal conditions are about 3.3MW and 2.5MVAR, while during the DPTG fault, the active and reactive powers will decrease to 2.20MW and 1.31MVAR respectively. In the event of interruption, short circuit current will increase and the system absorbs more power to maintain voltage rating. However, due to the limited availability of the power resources, then this disturbance causes the voltage sag and power flows in the system also decreased. The high of the required load in the system during the disturbance, while the supplying power was inadequate, will then impact to the reduction of voltage, and active/reactive powers will be greater.
After DVR installation
[image:5.612.319.536.242.345.2]Before the installation of DVR, voltage sag occurred due to the DPTG fault is about 0.775pu. With the installation of the DVR, the voltage on the system tries to maintain the normal voltage i.e. 1.0pu, but the voltage sag slightly persists with a decrease of 0.954pu. However, with the implementation of the DVR, voltage sag can be improved significantly that is about of 21.79% compared with the voltage sag without DVR implementation. The voltage response returns to normal condition after DPTGF removed in the system with the voltage response comeback to 1.0pu. The voltage waveform with the installation of DVR can be seen in Figure-12.
Figure-12. Voltage waveform for DPTGF with DVR.
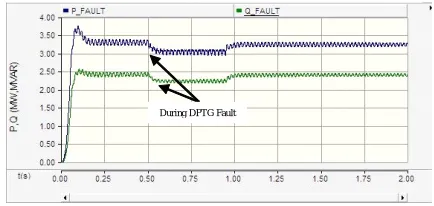
Figure-13. Active and reactive powers waveform for DSPTGF with DVR
Waveform of active power and reactive power required at the time of the interruption system DPTGF with DVR implementations are given in Figure-13. In the figure shows that the active power and reactive power absorbed by the system is 3.03MW and 2.19MVAR. Amount of power absorbed by the system before, during and after the disturbance DPTGF is approximately the same and thus the voltage response also showed the same level.
Scenario 3: Three phase to ground fault (TPTGF)
Before DVR Installation
In the event of TPTG fault during the period of 0.5s to 0.95s, the voltage sag occurs reaches to 0.689pu. Then the voltage response return to the 1.0pu after the TPTG fault is removed from the system. Compared with the previous two disturbances scenarios, voltage sag caused by the TPTGF disturbance give the worst impact on the system, since all phases are shorted and the fault current flows to the ground. Voltage waveform before installing DVR can be seen in Figure-14.
During DPTG Fault
During DPTG Fault
During DPTG Fault
Figure-14. Voltage waveform for TPTGF without DVR.
In Figure-15, it can be seen that the waveforms of active and reactive powers under normal conditions is about 3.3MW and 2.5MVAR respectively. In the event of TPTG fault, the voltage sag occurs during the period between 0.5s to 0.95s, with the active and reactive power absorbed by the system will be decreased to 1.54MW and 1.16MVAR respectively.
Figure-15. Active and reactive powers waveform for TSPTGF without DVR.
After DVR installation
Without the DVR implementation in the system, the voltage sag reaches to 0.689pu during the TPTG fault. On the other hand, the voltage response will improve to 0.909pu with the implementation of the DVR. The percentage improvement of the voltage response reaches to about 31.88% compared with the voltage sag response without DVR implementation. Voltage waveform after the installation of DVR during the TPTG fault can be seen in Figure-16.
In Figure-17, it can be seen that the waveforms of active and reactive powers dropped to 2.73MW and 2.01MVAR respectively under TPTG fault. However the power absorbed by the system load can be fulfilled by the available DVR instead of without DVR implementation which the lack of the active and reactive powers are about 1.54MW and 1.16MVAR, respectively.
Figure-17. Active and reactive powers waveform for TSPTGF with DVR.
Scenario 4: one of the largest motor starting
Before DVR installation
In normal conditions the voltage respons is maintained in rating voltage of 1.0pu or 381V. When the largest motor with the capacity of 55 kW is starting during the period of t=0.5s with the duration of 0.45s, the voltage decrease to 0.93pu or 352V. The voltage sag response is still in the minimum allowable voltage range i.e. 0.9pu as based on the IEEE standard. The voltage response returns to normal rating of 1.0pu when the motor operated in normal speed operation. The voltage waveform response prior the installation of the DVR can be seen in Figure-18.
Figure-18. Voltage waveform for scenario 4 without DVR.
In Figure-19 shows that the waveform of active and reactive powers on conditions before starting a 55 kW motor unit are about 625kW and 469kVAR, after starting a motor unit during the period of t = 0.5s to 0.95s, active power and reactive power absorbed are about 549 kW and
During TPTG Fault
During TPTG Fault
During TPTG Fault
During TPTG Fault
After starting Before starting
Figure-19. Active and reactive powers waveform for scenario 4 without DVR.
After DVR installation
When the DVR is implemented in the system, the voltage response during the motor starting is about 0.998pu or 379V. The voltage sag of system during the motor starting is sufficiently compensated by the DVR. The voltage waveform after the installation of DVR is depicted in Figure-20.
Figure-20. Voltage waveform for scenario 4 with DVR.
Based on the Figure-21 it is shown that the requirement of the active and reactive powers before motor starting are 625kW and 469 kVAR, respectively. However with the DVR implementation, during the period of 0.5s to 0.95s the active and reactive powers absorbed by the system are slightly increased to 658 kW and 490 kVAR, respectively.
Figure-21. Waveform active and reactive powers for scenario 4 with DVR.
Summary result of disturbances motor starting results The result summary of the voltage sag, active power, and reactive power during disturbances and motor starting scenarios, without and with DVR is given in Table-1. The scenario TPTGF gives the worst impact compared with both SPTGF and DPTGF scenarios. In addition, the voltage sag caused by the largest motor starting is still in the range of standard voltage i.e. >0.9pu. The implementation of the DVR shows the significant impact to reduce the voltage sag. All of the voltage responses with the different scenarios are above minimum allowable voltage (>0.9pu).
Table-1. Comparison of voltage, active power, and reactive power without and with DVR.
Scenarios
Without DVR With DVR
V (pu)
P (kW)
Q (kVAR)
V (pu)
P (kW)
Q (kVAR)
SPTGF 0.83 247 156 0.99 326 249
DPTGF 0.78 220 131 0.95 303 219
TPTGF 0.69 154 116 0.91 273 201
Motor starting 0.92 549 401 0.99 658 490
CONCLUSIONS
From the simulation results and analysis performed, it can be drawn several conclusions as follows: a) The implementation of DVR has shown the
significant impact to improve the voltage sag due to the short circuit and motor starting scenarios. DVR specification to overcome the voltage sag due to
disturbances and motor starting scenarios are as follows: Vdc = 5kV, Cdc= 0.023µF, kV Transformer
380V/5 kV, and filter = 10 µF.
improvement due to the largest of the motor starting is about 7.61% compared with without DVR.
REFERENCES
[1] Nguyen, P.T., Saha, T.K. 2004. Dynamic voltage restorer against balanced and unbalanced voltage sags: modelling and simulation. IEEE Power Engineering Society General Meeting, 1, pp. 639-644
[2] IEEE Standard 1159-1995. 1995. IEEE Recommended Practice for Monitoring Electric Power Quality. New York. USA.
[3] Dugan, C. Roger, McGranaghan, F. Mark, Santoso, Surya and Beaty, Wayne. H. 2004. Electrical Power Systems Quality. The McGraw-Hill Companies, Second Edition, USA.
[4] Benachaiba, C. and Ferdi, B. 2008. Voltage Quality Improvement using DVR. Electrical Power Quality and Utilization Journal, 14(1), Bechar University Center. Algeria.
[5] Anaya-Lara, O., Acha, E. 2002. Modeling and analysis of custom power systems by PSCAD/EMTDC. IEEE Transactions on Power Delivery, 17(1), pp. 266-272.
[6] Padiyar, R.K. 2007. FACTS Controllers in Power Transmission and Distribution. 1st Edition, Anshan
Publishers, India.
[7] Ezoji, H. Sheikholeslami, A. Saeednia, M.M. and Tabasi, M. 2009. Simulation of Dynamic Voltage Restorer Using Hysteresis Voltage Control. European Journal of Scientific Research, 27(1), pp.152-166.
[8] Perera, K.., Salomonsson, D., Atputharajah, A., Alahakoon, S. 2006. Automated Control Technique for a Single Phase Dynamic Voltage Restorer. International Conference on Information and Automation 2006 (ICIA 2006), pp. 63-68.
[9] Chi-Jen Huang; Shyh-Jier Huang; Fu-Sheng Pai. 2003. Design of dynamic voltage restorer with disturbance-filtering enhancement. IEEE Transactions on Power Electronics, 18(5), pp. 1202-1210.