www.hydrol-earth-syst-sci.net/16/1063/2012/ doi:10.5194/hess-16-1063-2012
© Author(s) 2012. CC Attribution 3.0 License.
Earth System
Sciences
The Indus basin in the framework of current and future water
resources management
A. N. Laghari1, D. Vanham2, and W. Rauch2
1Energy & Environment Engineering Department, Quaid-E-Awam University of Engineering, Science & Technology
(QUEST), Nawabshah, Pakistan
2Unit of Environmental Engineering, Institute of Infrastructure, University Innsbruck, Technikerstrasse 13,
6020 Innsbruck, Austria
Correspondence to: D. Vanham ([email protected], [email protected])
Received: 8 February 2011 – Published in Hydrol. Earth Syst. Sci. Discuss.: 2 March 2011 Revised: 6 March 2012 – Accepted: 18 March 2012 – Published: 2 April 2012
Abstract. The Indus basin is one of the regions in the world that is faced with major challenges for its water sector, due to population growth, rapid urbanisation and industrialisation, environmental degradation, unregulated utilization of the re-sources, inefficient water use and poverty, all aggravated by climate change. The Indus Basin is shared by 4 countries – Pakistan, India, Afghanistan and China. With a current pop-ulation of 237 million people which is projected to increase to 319 million in 2025 and 383 million in 2050, already to-day water resources are abstracted almost entirely (more than 95 % for irrigation). Climate change will result in increased water availability in the short term. However in the long term water availability will decrease. Some current aspects in the basin need to be re-evaluated. During the past decades wa-ter abstractions – and especially groundwawa-ter extractions – have augmented continuously to support a rice-wheat system where rice is grown during the kharif (wet, summer) sea-son (as well as sugar cane, cotton, maize and other crops) and wheat during the rabi (dry, winter) season. However, the sustainability of this system in its current form is ques-tionable. Additional water for domestic and industrial pur-poses is required for the future and should be made available by a reduction in irrigation requirements. This paper gives a comprehensive listing and description of available options for current and future sustainable water resources manage-ment (WRM) within the basin. Sustainable WRM practices include both water supply management and water demand management options. Water supply management options in-clude: (1) reservoir management as the basin is characterised by a strong seasonal behaviour in water availability (mon-soon and meltwater) and water demands; (2) water quality conservation and investment in wastewater infrastructure; (3)
the use of alternative water resources like the recycling of wastewater and desalination; (4) land use planning and soil conservation as well as flood management, with a focus on the reduction of erosion and resulting sedimentation as well as the restoration of ecosystem services like wetlands and natural floodplains. Water demand management options in-clude: (1) the management of conjunctive use of surface and groundwater; as well as (2) the rehabilitation and modern-ization of existing infrastructure. Other demand management options are: (3) the increase of water productivity for agricul-ture; (4) crop planning and diversification including the crit-ical assessment of agricultural export, especially (basmati) rice; (5) economic instruments and (6) changing food de-mand patterns and limiting post-harvest losses.
1 Introduction
The Indus river basin is one of the most depleted basins in the world (Sharma et al., 2010). During certain periods of the year, water even does not really reach the sea any more, making it a closed basin (Molle et al., 2010). Already today it faces large problems with respect to water resources. These will only become more challenging in the next decades, due to population growth, rapid urbanisation and industrialisa-tion, environmental degradaindustrialisa-tion, inefficient water use and poverty (economic water shortage), all aggravated by climate change.
1064 A. N. Laghari et al.: The Indus basin in the framework of current and future water resources management
change on glaciers and the hydrological regime (Akhtar et al., 2008; Immerzeel et al., 2010; Tahir et al., 2011), agri-cultural water demands and productivity (Cai and Sharma, 2009, 2010), groundwater management (Kerr, 2009; Qureshi et al., 2009; Scott and Sharma, 2009; Shah et al., 2006), reservoir sedimentation (Khan and Tingsanchali, 2009), eco-logical flows and the Indus delta (Leichenko and Wescoat, 1993), water policy (Biswas, 1992; Miner et al., 2009; Shah et al., 2006, 2009; Sharma et al., 2010) and water resources management (Archer et al., 2010; Qureshi et al., 2009).
Within the two latter publications the major challenges facing the Indus basin were described, as well as recommen-dations for sustainable water management. However, both papers have certain limitations. They both focused only on Pakistan, although 40 % of the basin’s surface area is located within 3 other countries. Qureshi et al. (2009) focused on groundwater. The recommendations for sustainable water management within Archer et al. (2010) were far from com-plete, as not all available options were accounted for. Within this latter paper the focus is on water supply management options. The part on “water resources management” is not sufficient, and water demand management options are not ad-dressed. In a world with finite (water) resources the solution is not only in supply management but sustainable manage-ment options require the inclusion of demand managemanage-ment practices. The aim of this paper is to give an overview on all relevant recommendations for the whole Indus basin.
This paper gives a comprehensive listing and description of all available water resources management options and does not restrict itself to the Pakistani part of the Indus basin. Especially the Indian part of the basin is also included in the analysis. Also the topic of flooding and especially the massive floods of 2010 are discussed. The paper also gives a comprehensive overview on water balance quantities ob-tained from different sources, which is currently not available in the literature.
2 The Indus basin
2.1 General
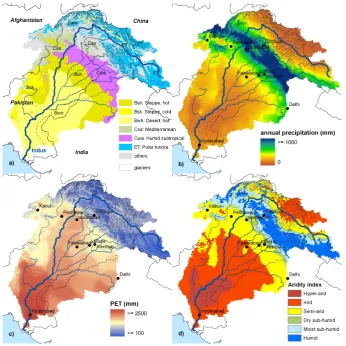
The Indus basin is located in 4 countries, of which the largest part in Pakistan, and substantial upstream parts in India, China and Afghanistan (Fig. 1). More than 40 % is located at an elevation higher than 2000 m a.s.l. The total hydrographic basin – as defined by the International Water Management In-stitute (IWMI) – has an area of 1 137 819 km2. Other authors (Babel and Wahid, 2008; Eastham et al., 2010; Harrington et al., 2009; Hoekstra and Mekonnen, 2011; Jain et al., 2009) indicate an area range from 1 080 000 to 1 218 500 km2. Of a total population of about 237 million (Fig. 1), Pakistan ac-counts for 61 % (145 million) and India for 35 % (83 million). Another 4 % (9 million) live in the Afghani part of the basin, and the Chinese population is very little due to the rough
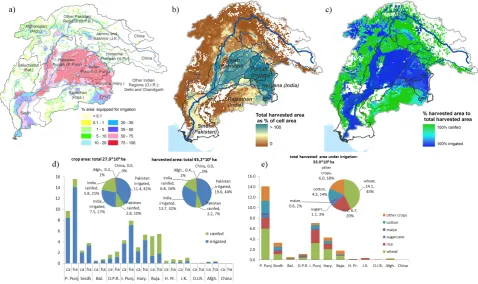
Himalayan landscape character of this part of the basin. Of the irrigated area (228 694 km2, 21 % of basin area) about 60.9 % is located in Pakistan, 37.2 % in India, 1.9 % in Afghanistan and 0 % in China. The Indus Basin Irrigation System (IBIS) is the largest irrigation system in the world. Water demands are thus by far the highest in Pakistan fol-lowed by India. The focus of this paper will therefore be on these two regions.
The wettest regions of the Indus basin are on the south-ern slopes of the Himalaya-Karakoram-Hindu Kush (HKH) mountain range (Fig. 2). The high mountain ranges in the north of the basin – like Ladakh in India – are very dry, as well as the lowlands. The aridity index within the basin ranges from humid to hyper-arid. The glacial area is very large, i.e. 37 134 km2according to the DCW database (Raup et al., 2000). Within the GLIMS-Database (Armstrong et al., 2005) glaciers from India and Pakistan are missing. The lat-ter is definitely more accurate than the DCW database, which overestimates the glacial area for the region. Other sources that refer to the GLIMS-database indicate within the Indus basin a glacial area of about 22 000 km2 (Immerzeel et al., 2010) or 20 325 km2 (Kaser et al., 2010). These values are more realistic estimates.
2.2 Water balance
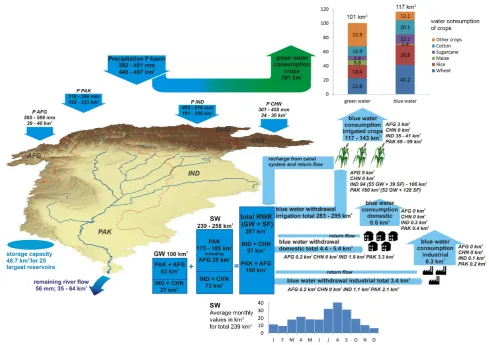
General water balance components have been quantified by different authors and are shown in Fig. 3. Based upon com-putations from the 2 datasets (GWSP, 2008; Hijmans et al., 2005) and values given by different authors (Immerzeel et al., 2010; Karim and Veizer, 2002; Mitchell and Jones, 2005), the average annual basin precipitation is within the range 392 to 461 mm or 446 to 497 km3, for the periods 1950– 2000, 1961–2000 and 2001–2007. Varis et al. (2012) indi-cate that the annual precipitation in the Indus basin is less than 500 mm. The Indian part of the basin receives about the same volume in precipitation as the Pakistani part. The Chal-lenge Program on Water and Food (CPWF) identifies sub-stantial higher values of precipitation for the basin, i.e. 762– 824 km3(Eastham et al., 2010; Harrington et al., 2009). Es-pecially for the mountainous part of the basin the latter au-thors state much higher precipitation values, e.g. annually 1130 mm for the entire Upper Indus basin. This is a very high value as compared to other sources, e.g. Bookhagen and Bur-bank (2010) state annually 0.3 m for the Upper Indus basin or Immerzeel et al. (2009) state 340 mm. These amounts are coherent with the precipitation map of Fig. 2b, where it is shown that the high mountain ranges in the north of the basin are very dry.
Fig. 1. (a) Overview of the DEM and location of political borders of the Indus river basin (boundaries based upon topography, as provided by
the IWMI); (b) population density POPD (persons per km2) in 2005 according to CIESIN (2005), POP = total population in 2005 based upon the GPWv3 dataset (CIESIN, 2005); country codes according to the UN: AFG = Afghanistan, CHN = China, IND = India, PAK = Pakistan.
190 km3. Basin long term average surface water availability is in the order 239 km3(Hoekstra and Mekonnen, 2011) to 258 km3(Gupta and Deshpande, 2004; Kreutzmann, 2011; Sharma et al., 2008). In India, surface water availability is 73 km3 (Gupta and Deshpande, 2004; Sharma et al., 2008) and the Pakistani part accounts for 175 km3 (Briscoe and Qamar, 2007) or 185 km3 (Kreutzmann, 2011). This in-cludes 165 km3 from the 3 western rivers (Indus, Chenab, and Jehlum) and 10 km3from the eastern rivers (Ravi, Beas, and Sutlej). Afghani surface water availability is 25 km3 (Qureshi, 2011) and is included in the latter Pakistani vol-umes. Replenishable groundwater resources in India are 27 km3(Sharma et al., 2008) and in Pakistan 63 km3(Briscoe and Qamar, 2007; Qureshi, 2011). There is an overlap between available surface water resources (about 250 km3) and replenishable groundwater resources (about 100 km3).
Especially in Pakistan, a substantial part of available wa-ter resources diverted in the IBIS canal system leads to the recharge of the groundwater reservoir. According to Van Steenbergen and Gohar (2005), only 21 % (14 km3) of the Pakistani replenishable groundwater resources (total 63 km3) originate directly from rainfall. About 45 % originate from recharge from the canal system, 26 % from irrigation return flows and 6 % from river recharge. The remaining 2 % origi-nate from other return flows. The Indus Basin is underlain by an extensive unconfined aquifer that covers 16 million ha of surface area, of which 6 million ha are fresh and the remain-ing 10 million ha are saline (Qureshi et al., 2008).
[image:3.595.127.471.63.461.2]1066 A. N. Laghari et al.: The Indus basin in the framework of current and future water resources management
Fig. 2. Climatology within the Indus basin: (a) major climatic zones 1950–2000 – the K¨oppen-Geiger system of climate classification
(K¨oppen, 1936) adapted according to Hijmans et al. (2005) by de Bie (2007); (b) average annual precipitation (mm) for the period 1950– 2000, according to Hijmans et al. (2005); (c) average annual potential evapotranspiration PET in mm (interpolated surface from FAOClim-Database) calculated as ETo after the FAO Penman-Monteith equation (Allen et al., 1998); (d) aridity index (AI = PET/P) as defined by UNEP (1992).
in Pakistan is an important agricultural area as well as the Indian province of Haryana; the major irrigation system is located in these regions. The harvested area of the three crops wheat, rice and cotton represent 77 % of the area of all crops harvested under irrigation (33 million ha) (Fig. 4). Total water withdrawals in India add up to 98 km3 (Saleth and Amarasinghe, 2009), of which 94 km3 is for irrigated agriculture (55 km3or 59 % as groundwater, 39 km3or 41 % as surface water). Total water withdrawals in Pakistan add up to 180 km3(Briscoe and Qamar, 2007; Qureshi, 2011), of which 128 km3 (71 %) as surface water and 52 km3(29 %) as groundwater. However, as indicated before the distinc-tion between both is not absolute. A large fracdistinc-tion of the replenishable groundwater originates from surface water. In the Afghani part of the basin about 10 km3are withdrawn, of which 96 % is for irrigated agriculture. Water abstractions in the Chinese part of the basin are neglectable.
Water consumption values (Fig. 3) show that only about 11 % of domestic water in the basin is consumed, the
Fig. 3. Average annual water balance data of the Indus basin, based upon different sources. P= precipitation; RWR = renewable water resources; GW = ground water; SW = surface water. Values calculated by means of GWSP (2008) data are referred to as (1). Data sources: precipitation (1) and Hijmans et al. (2005), Immerzeel et al. (2010), Karim and Veizer (2002), Mitchell and Jones (2005); total RWR (UNEP, 2009; Sharma et al., 2008); national RWR (IUCN, 2010; Sharma et al., 2008); total SW (Hoekstra and Mekonnen, 2011; Sharma et al., 2010); national SW (Briscoe and Qamar, 2007; Gupta and Deshpande, 2004; Kreutzmann, 2011; Qureshi, 2011; Sharma et al., 2008); national GW (Briscoe and Qamar, 2007; Indian M.W.R., 2011; Qureshi, 2011; Sharma et al., 2008); total water withdrawal/consumption irrigation (1) and Immerzeel et al. (2010) and Mekonnen and Hoekstra (2010b); national water withdrawal/consumption irrigation (1) and Kreutzmann (2011) and Saleth and Amarasinghe (2009); total water withdrawal/consumption domestic and industrial (1) and Sharma et al. (2010); national water withdrawal/consumption domestic and industrial (1); remaining river flow (1) and Briscoe and Qamar (2007), Karim and Veizer (2002) and Kreutzmann (2011); storage reservoirs based upon the dataset (Lehner et al., 2008)
is used. Of the available surface water resources of 175 km3, about 75 %, is withdrawn. In a system with little storage and considerable variability, average values can however be de-ceptive. Summer or monsoon crops (kharif, autumn harvest) and winter crops (rabi, spring harvest) have different de-mands and water availability during these periods also differ. Mekonnen and Hoekstra (2010b) calculated both the blue water consumption (irrigated consumption) and green wa-ter consumption of crops in the Indus basin. Large regions within the basin – with extensive agriculture – are rainfed. Irrigation of wheat, rice, cotton and sugarcane crops account for 90 % of the total blue water consumption in the basin (Fig. 3). The same crops and maize account for 67 % of total green water evapotranspiration in the basin.
The remaining river flow to the sea ranges from 35 to 64 km3(Briscoe and Qamar, 2007; Karim and Veizer, 2002; Kreutzmann, 2011).
3 Major challenges
3.1 Introduction
1068 A. N. Laghari et al.: The Indus basin in the framework of current and future water resources management
Fig. 4. Crop area (“ca” – net area) and harvested area (“ha” – gross area) within the Indus basin statistics based upon
MIRCA2000-data (Portmann et al., 2010): (a) principal regions within the basin with representation of % of area equipped for irrigation (FAO-MIRCA2000-database, according to Siebert et al., 2005); (b) total harvested area of both irrigated and rainfed crops as percentage of cell area; (c) relative contribution (%) to total harvested area by irrigated crops and rain fed crops; (d) crop area and harvested area (in 106ha) for all crops within the regions;
(e) crop area and harvested area under irrigation (in 106ha) for the 5 main crops – wheat, rice, sugarcane, maize and cotton.
predicted (Archer et al., 2010). On the short term climate change is expected to have a positive effect on available wa-ter resources, however, on the long wa-term this effect will be negative. The following gives an overview of challenges for the Indus basin:
– Water resources changes due to climate change.
– Population increase and increased urbanisation and in-dustrialisation, resulting in higher water demands for domestic and industrial purposes, food production and energy.
– A shift from surface water to groundwater use resulting in rapid depletion of groundwater resources – an obser-vation made for both the Indus and Ganges basins. – Flooding
Other challenges include the low water productivity in food production at particular locations; a declining reservoir stor-age due to sedimentation; water logging and salinity, loss of productive agricultural land, land degradation, contami-nation of surface and groundwater resources; an increase in environmental flows to sustain ecosystems within the rivers
and the Indus delta, but also to prevent further salt water in-trusion in the delta; and tension between riparian countries. The first 4 challenges are discussed more in detail within the following Sects. 3.2 to 3.5. The section with recommenda-tions (Sect. 4) will however answer to all listed challenges.
3.2 Water resources changes due to climate change
November to February, average monthly surface water avail-ability is about 10 km3whereas during the summer months July to September this value is larger than 30 km3. In systems with considerable water availability and demand variability, averages can therefore be deceptive.
Immerzeel et al. (2010) showed that meltwater is ex-tremely important in the Indus basin. For the present day cli-mate, discharge generated by snow and glacial melt is 151 % of the total discharge naturally generated in the downstream areas. About 40 % of the meltwater originates from glaciers, 60 % from snowpack. Also Kaser et al. (2010) stress the im-portance of glacial melt water to the Indus flow, as well as Tahir et al. (2011). Bookhagen and Burbank (2010) calcu-lated the meltwater contribution to annual discharge for the major southern Himalayan catchments where the rivers flow into the plains (at the foot of the Himalayas): 66 % for the In-dus, 25 % for the Jhelum, 43 % for the Chenab, 16 % for the Ravi, 21 % for the Beas and 57 % for the Sutlej river. Further downstream these fractions become smaller. The regimes in the basin are (Archer, 2003):
– A nival regime at middle altitudes with flow dependent on the melting of seasonal snow. The greatest contribu-tion to total flow comes from this regime.
– A glacial regime at very high altitudes with river flow closely dependent on summer temperatures.
– A rainfall regime dependent on runoff from rainfall mainly during the monsoon season. This regime domi-nates on the southern foothills of the Himalayas (Fig. 2) and also over the plains but with much reduced total amounts.
Climate change will definitely affect the temporal and spatial availability of water resources. A listing of potential effects and studies conducted on the three hydrological regimes is given in Archer et al. (2010). Also Immerzeel et al. (2010) indicate that upstream snow and ice reserves of the Indus basin, important in sustaining seasonal water availability, are likely to be affected substantially by climate change, but to what extent is yet unclear. A new study by Scherler et al. (2011) actually indicates that debris coverage may be a missing link in the understanding of the decline of glaciers in the HKH. Controversy about the current state and future evolution of Himalayan glaciers has been stirred up by erro-neous statements in the fourth report by the IPCC. Accord-ing to Scherler et al. (2011), glaciers in the Karakoram re-gion are mostly stagnating. This anomaly was already de-scribed by Hewitt (2005). However, glaciers in the West-ern, Central, and Eastern Himalaya are retreating. Half of the studied glaciers in the Karakoram region are stable or even advancing, whereas about two-thirds are in retreat else-where throughout High Asia. Also Tahir et al. (2011) con-cluded a rather slight expansion of cryosphere during the pe-riod 2000–2009 in the Hunza basin in the Upper Indus. This
is in contrast to the prevailing notion that all glaciers in the HKH are retreating. Basically glaciers in the Central Karako-ram are stagnating or even expanding, whereas glaciers in the Afghani part and the western Himalayas part of the Indus basin are retreating. An overview on this situation is given in Fig. 5.
There is general consent that in the Indus basin climate change will result in increased water availability in the short term. However in the long term water availability will crease. Immerzeel et al. (2010), for example, indicate a de-crease in mean upstream water supply from the upper Indus (−8.4 %) by 2046–2065 with respect to the reference period 2000–2007. The authors indicate that these changes are con-siderable, but they are less than the decrease in meltwater production would suggest, because this reduction is partly compensated for by increased mean upstream rainfall (In-dus +25 %). Regardless of the compensating effects of in-creased rainfall, summer and late spring discharges are even-tually expected to be reduced consistently and considerably around 2046 to 2065 after a period with increased flows due to accelerated glacial melt. The authors also analyzed an ex-treme scenario in which all glaciers are assumed to have dis-appeared, for which the Indus shows the largest reduction in water availability of all major Himalayan rivers. Mukhopad-hyay (2012) states similar conclusions. According to the author, global warming is expected to dramatically alter the flow regime of the Upper Indus river. The predicted change in flow regime is an initial increase in summer flows in the early decades of 21st century followed by a sharp decline of the same during the latter parts of the century. Similar results were found for the Sutlej river (Singh and Bengtsson, 2004). Although the effects of climate change will not be as vis-ible in the short term, they will be prominent on the long term. Reduced water availability will be the most profound during the spring and summer months. Water from the snow and glacier melt will appear earlier than the main monsoon flows.
3.3 Increase in population
1070 A. N. Laghari et al.: The Indus basin in the framework of current and future water resources management
Fig. 5. Glacier behaviour in the Upper Indus Basin. Data source of Karki et al. (2011).
Setchell and Luther, 2009). The number of people that live in the Chinese part of the basin is extremely low.
3.4 Shift from surface water to groundwater use
During the last decades there has been a shift from surface water resources to groundwater resources within the Indus basin, for irrigation but also for domestic and industrial pur-poses. On demand availability of groundwater has trans-formed the concept of low and uncertain crop yields (be-fore predominantly fed with surface water) into more as-sured crop production (Qureshi et al., 2009). The availability of inexpensive drilling technologies allows even poor farm-ers to access groundwater. Over 80 % of the groundwater exploitation in Pakistan takes place through small capacity private tube wells. During the last decades, the number of tube wells in the main agricultural zones of the Indus basin has increased dramatically. By the early 1960s, an estimated 23 % of Pakistan’s land suffered from waterlogging and crop root zone salinity. Initial response was through the SCARP-project, which aimed at lowering the groundwater table by means of the instalment of 13 500 publicly owned and oper-ated tubewells (Qureshi et al., 2008).
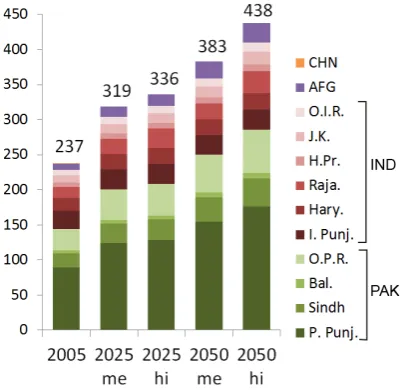
Fig. 6. Population projection data for the different regions within
the borders of the Indus basin for 2025 and 2050. The regions and their codes are displayed in Fig. 4; me = medium popula-tion increase estimate; hi = high populapopula-tion increase estimate; data sources: UN (2011) for PAK, AFG and the Indian states of Hi-machal Pradesh, Jammu and Kashmir and other regions, Mah-mood and Kundu (2008) for the Indian states Punjab, Haryana and Rajasthan.
decreased from 1.3 to 1.0 million ha (decrease of 25 %) and the net irrigated area with groundwater increased from 2.6 to 3.1 million ha (increase of 17 %). Also Shah et al. (2009) in-dicate that in Pakistan’s Indus Basin Irrigation System, the area irrigated with tubewells increased during 1990–2006 by 38 % while that under flow irrigation declined by 11 %. Pub-lic irrigation is shrinking rapidly, whereas private irrigation is growing rapidly. The IBIS is a gravity run system with mini-mum management and operational requirements (Qureshi et al., 2009). Its operation is based upon a continuous water supply and is not related to actual crop water requirements. Despite significant increases in storage capacities, it is essen-tially a supply-based system. It can thus not accommodate changing water demands during the crop season. Ground-water exploitation has enabled many farmers to supplement their irrigation requirements and to cope with the uncertain-ties of surface supplies. The access to the natural buffer of groundwater resources has helped poor farmers not only to increase their production and incomes, but also enhance their opportunities to diversify their income base and to reduce their vulnerability against seasonality of agricultural produc-tion and external shocks such as droughts. This is a first rea-son for the drastic increase in groundwater use: the inability of the large irrigation systems to meet the variable and on-demand nature of the farmers’ water requirements, as well as their poor maintenance and management.
However, current groundwater exploitation rates are un-sustainable in many regions. There is a large imbalance
between extraction and replenishment. Water tables are falling at alarming rates, both on the Pakistani (Qureshi et al., 2009; Tiwari et al., 2009) and Indian sides (Rodell et al., 2009; Sundarajan et al., 2008; Tiwari et al., 2009). For the Indus basin Tiwari et al. (2009) estimated a change (loss) of terrestrial water storage of about 10 km3yr−1 be-tween April 2002 and June 2008. The Indian Ministry of Water Resources (Indian M.W.R., 2011) lists for the Indian states of Punjab and Haryana an annual overdraft of 9.89 km3 (stage of groundwater development 145 %) and 1 km3(stage of groundwater development 109 %), respectively. Excessive lowering of the groundwater table has made pumping more expensive. As a result, many wells have gone out of pro-duction, yet the water table continues to decline and salinity increases.
A factor which also contributed to the increase in ground-water withdrawals is simply the increase in cropped and irri-gated areas during the past decades as well as the increased cultivation of more water intensive crops like rice, cotton and sugarcane. The harvested area of these crops accounted for 20 % 13 % and 3 %, respectively, of all harvested area under irrigation in the year 2000 (Fig. 4). The principal regions where these crops are grown are the both Punjabs and to a lesser extent Haryana and Sindh. The irrigation of these 3 crops accounts for 28 % 19 % and 13 %, respectively, of the total blue water consumption in the basin (Fig. 4). These values show their water intensive nature as compared to the harvested areas. Figure 8a shows the increase in both the area (million ha) and production (million t) of rice (bas-mati and other varieties) in Pakistani Punjab from 1987– 1988 to 2004–2005. Note the increasing gap between area and production due to increased yields. Punjab accounts for more than 50 % of the total rice production and more than 90 % of the total basmati production in Pakistan. About 70– 80 % of rice produced in the province is basmati. However, large quantities of rice produced in Pakistan are for export (Fig. 8b). From 2001 to 2005, about 40–60 % of all rice pro-duced in Pakistan was exported. Basmati exports increased from 0.6 to 0.9 million t during that period.
3.5 Flooding
Flooding has always been an issue in the Indus basin (Tariq and van de Giesen, 2011). Monsoon rainfalls are the main source of floods in the basin. High flows are experienced in summer due to the increased rate of meltwater and monsoon rains. The nature of flooding varies according to geography. Fluvial floods in the Indus plain prove most devastating, as the terrain is flat, densely populated and economically devel-oped. Hill torrents (flash floods) are the second most destruc-tive type of flood.
1072 A. N. Laghari et al.: The Indus basin in the framework of current and future water resources management
Fig. 7. (a) Increase in private tubewells in the main Pakistani provinces of the Indus Basin. Data source: GOP (2005); (b) net irrigated area
under surface and groundwater irrigation for the periods 1993–1994 and 2000–2001 for the 3 provinces Sindh, Pakistani and Indian Punjab. Data Source: Shah et al. (2009) for Pak. Punjab and Sindh; Minor Irrigation Census 1993–1994 (Government of India, 2001; CWC, 2010) for Indian Punjab.
almost 2000 lost their lives and financial damages were in the range of 40 billion dollars (Webster et al., 2011). Although excessive rainfall has been cited as the major causative fac-tor for this disaster (Houze et al., 2011; Tariq and van de Giesen, 2011), the human interventions in the river system over the years made this disaster a catastrophe (Gaurav et al., 2011). Also its geomorphic character with a high sediment load, typical for many Himalayan rivers, adds to the extent of the catastrophe and the unpredictability of the river. As a matter of fact, Gaurav et al. (2011) compare the 2010 Indus floods to the Kosi disaster in 2008 in India because of many similarities. The average annual sediment load – originating from the relatively young Karakoram and Himalaya moun-tains ranges – of 291 million t per year (Gaurav et al., 2011), ranks the Indus as one of the highest sediment load carrying rivers in the world.
Geomorphic analysis suggests that the Indus River has had a very dynamic regime in the past. However, the river has now been constrained by embankments on both sides, cut-ting it off from its natural floodplains. Barrages and dams were built. Flood control strategies on Himalayan rivers are primarily embankment based. Therefore the river has been accumulating sediment and aggrading rapidly during the last decades, making it a “superelevated river” in several reaches, which is considered to be prone to avulsion. Deforestation in the basin has led to increased erosion and sedimentation (Da Silva and Koma, 2011; Ali et al., 2005), as well as faster flood runoffs. The draining of natural wetlands has increased flooding. The wetlands that once surrounded the Indus River tamed floods, by regularly taking up parts of flood waters
during monsoonal seasons and slowly releasing them again. Change in flow regimes due to low flows in eastern rivers after the Indus Water Treaty and enhanced flood protection measures have attracted economic activities and settlements in the floodplains, in a country with an increasing population and substantial poverty. Vulnerability on such locations has increased due to a false sense of safety. Due to increased settlements and constructions in the floodplains, water that enters the inundation zone has its drainage path back to the main river interrupted by levees, roads, railway lines and canal embankments. The result is that water does not drain back. The relationship between anthropogenic environmen-tal degradation and catastrophic flooding is well documented (Mustafa and Wrathall, 2011). Conversely, we know there is an established link between healthy watersheds with flow capacity – wetlands, marshes, estuaries and mangroves – and flood mitigation. This disaster has stressed the urgent need to move from “river control” to “river management” strategies. The latter will be discussed in the following Sect. 4.1.4 “Land use planning and soil conservation; flood management”.
4 Recommendations in the framework of water resources management (WRM)
[image:10.595.100.495.65.274.2]Fig. 8. (a) Area (million ha) and production (million t) of rice (basmati and other varieties) in Pakistani Punjab from 1987–1988 to 2004–
2005. Data source: GOP (2005); (b) total production and export of rice (basmati and other varieties) for Pakistan from 2001–2002 to 2005–2006. Data source: GOP (2005).
managing of water demands. Applicable practices for the In-dus basin are discussed in the following sections. Section 4.1 discusses water supply or availability management, Sect. 4.2 water demand management and Sect. 4.3 discusses the topic of international collaboration.
4.1 Water supply-availability management
4.1.1 Reservoirs, rain water harvesting and artificial ground water recharge (AGWR)
Due to the monsoonal characteristic of precipitation and the seasonal character of melt water flow in the basin as well as the seasonal changes in crop water demands, the storage of water and rain water is essential. In a system with little stor-age and considerable variability in both water demand and water availability, average water balance values can be de-ceptive. In the past large reservoirs have been built (e.g. the Tarbela Dam) and farmers gradually shifted from surface wa-ter usage to groundwawa-ter for irrigation to cope with these nat-ural conditions. The use of the natnat-ural buffer of the ground-water reservoir has, however, led to an unsustainable fall of the groundwater table, draining aquifers faster than natural processes can replenish them (Qureshi et al., 2009; Rodell et al., 2009; Tiwari et al., 2009).
The 25 largest reservoirs in the basin represent a volume of 48.7 km3 (Fig. 3) – based upon the dataset of Lehner et al. (2008). Of this volume 22.2 km3is located in India, es-pecially in the reservoirs of the Pong Dam (8.6 km3) on the Beas River, Bhakra Dam (9.6 km3) on the Sutlej River and Thein Dam (3.7 km3) on the Ravi River. In Afghanistan the two included dams represent a volume of 0.6 km3. The
[image:11.595.99.498.64.273.2]1074 A. N. Laghari et al.: The Indus basin in the framework of current and future water resources management
a minimum by means of land management measures as de-scribed in the following Sect. 4.1.4 “Land use planning and soil conservation; flood management”.
Reservoir management needs to be sophisticated to maxi-mize yield from a given catchment and storage combination, the desire to minimize evaporative losses, and the demand for optimum water quality outcomes. There should be a multi-purpose controlled management for hydropower generation, other uses and flooding control.
Apart from these multipurpose dams, decentralised rain-water harvesting can have a small impact in the Indus basin. Rainwater harvesting also prevents soil erosion, an essen-tial matter in the basin. It can focus on (1) capturing water for domestic use (e.g. by rooftop rainfall collection); (2) re-plenishing green water (e.g. through stone bunds on the con-tour line); or (3) increasing blue water availability locally (e.g. through small check dams that increase recharge to the groundwater or store water in small reservoirs). Decen-tralised water harvesting is definitely an important factor for poor communities.
If suitable aquifers are accessible, AGWR has many ben-efits when compared to other storage options, e.g. low evaporation rates, natural treatment and storage capacity to buffer seasonal supply and demand variations. Basically the aquifers in the Indus basin have large reservoir capacities. The observed gradual depletion of the ground water table can be (partly) compensated by AGWR. It can compensate for the lack in reservoir storage which is highly vulnerable to sedimentation. This storage has to be conducted in the frame-work of IWRM. Also, Qureshi (2011) indicate that aquifer management is considered as the most effective way of es-tablishing a balance between discharge and recharge com-ponents. In recent years, India has taken serious steps to use harvested rainwater to recharge its aquifers and recently allo-cated significant funds in the central government budget for further promotion of the practice.
Natural floodplains of the Indus and its tributaries should be maintained as much as possible. This topic is discussed in the Sect. 4.1.4 “Land use planning and soil conserva-tion; flood management”. With sustainable floodplain man-agement, large water quantities of monsoon floods could be temporarily stored and groundwater reservoirs thereby replenished.
4.1.2 Water quality conservation and investment in wastewater infrastructure
The conservation of water quality and investment in wastew-ater infrastructure are a necessity in order to maintain the already quantitative scarce water availability. Especially the wastewater generated by municipalities, cities and industries should be purified before discharging them again in the re-ceiving water bodies. In 2000, total wastewater produced in Pakistan was estimated at 12.33 km3while treated wastewa-ter was estimated at 0.135 km3; this is only 1 %. Total water
withdrawn for domestic and industrial purposes in the Indus Basin is 8.8 km3 (Fig. 3). Water consumption values show that only about 11 % of domestic water in the basin is con-sumed, the remaining 89 % returns to the system. Industrial water is returned for 91 % back to the system. In other words, 7.9 km3 of wastewater is returned to the system of which only a small fraction is purified. In order to maintain quality standards of the receiving water bodies, massive investments need to be made. Water quality conservation includes the im-plementation of water pollution prevention strategies (legis-lation, polluting taxes, ...) for the different polluters (Kumar et al., 2005). Society and individuals in the riparian coun-tries should have a greater knowledge and ability to bring about the required changes and mentality.
Deteriorating groundwater quality is also a big issue in the Indus basin. The quality of groundwater in the basin varies from fresh to saline. Salinity remains a serious problem es-pecially in the irrigated areas of the Sindh province, where much of the groundwater is naturally saline (of marine ori-gin) and thus unsuitable for irrigation as a substitute for canal water. The joint management of surface and groundwater is a key requirement. Farmers need to be educated about suitable crops that can be grown under the conjunctive management of surface water and groundwater resources (Qureshi et al., 2009). In the Punjab provinces farmers largely rotate crops of wheat and paddy over the year. Since the Green revolu-tion these intensive monocultures of wheat and paddy have displaced other crops. The immediate impact of intensive monoculture cultivation practices is seen on the soils, farm-ers have started using much larger doses of chemical fertilis-ers and pesticides in the last 50 yr. After Andhra Pradesh, per hectare application of fertilisers is the highest in Indian Punjab. These substances have contaminated water bodies. Additionally, groundwater in the Punjab is contaminated by urban runoff, seepage from contaminated industrial sites, and industrial discharges (Singh, 2001). A more green approach in farming is required and the policies that impose them. Quantification and timing of fertilisation has to be managed carefully in order to avoid water pollution.
4.1.3 Use of alternate water resources
wastewater is therefore substantial. A general discussion on recycling of wastewater in India is given by Kumar (2009). A role model in sustainable urban water management and recycling of wastewater can be seen in Singapore (Vanham, 2011). The city state has invested and still is investing mas-sively in a sustainable self-sufficient water supply system. Singapore aims at being self-sufficient in its water supply by effective measures like water recycling (NEWater) and de-salinization, amongst others. Water purification is 100 %. By 2060, the city plans to increase the current NEWater capacity so that NEWater can meet 50 % of future water demand. Al-ready today citizens are drinking recycled wastewater. The water cycle of the city is becoming more and more closed. Singapore has, of course, the financial and technical means to implement such a system. Nevertheless, the city shows sustainable solutions, which could also be implemented in the future in cities throughout the Indus Basin.
The use of domestic and industrial wastewater for irri-gation also creates possibilities for irrigating crops. Not only will greater benefits be generated per unit of water di-verted from a freshwater source, but some of the nutrients required to produce crops also will be recycled at a cost that is smaller than continuously developing new supplies. How-ever, wastewater irrigation also creates health risks for farm-ers, their families, and consumers. An overview on the differ-ent aspects of wastewater for irrigation is given by Wichelns and Drechsel (2011). With increasing water withdrawals for domestic and industrial purposes, this issue offers a lot of op-portunities as generally 90 % of withdrawn water is returned to the system. When the bulk of this returned water is used for irrigation, a required reduction in irrigation requirements to meet other future demands will be not so substantial.
In the Sindh Province there are substantial deposits of brackish water in the underground. As the cost of desalin-isation is falling (Kumar et al., 2005), the prospects of de-salinating brackish water – and also seawater for the coastal communities – are becoming more attractive. Studies done in Pakistan and India have also shown that brackish wa-ter can be used for irrigating different crops under different soil types and environmental conditions (Qadir et al., 2001; Sharma and Rao, 1998).
4.1.4 Land use planning and soil conservation; flood management
These practices include a change of land use, reforestation and the reduced sealing of areas in order to prevent ero-sion and high surface flow coefficients. As discussed in the Sect. 3.5 “Flooding”, erosion and the resulting high sedi-mentation loads in the river system of the Indus basin lead to the rise of the river beds between their embankments as well as the level of floodplains, diminishing their buffer ca-pacity. Additionally the capacity of reservoirs is reduced substantially due to sedimentation. An important cause of increased sedimentation is past deforestation (Da Silva and
Koma, 2011). Current forests should be maintained and re-forestation should be considered as an option to reduce ero-sion, especially in the mountainous regions of the basin to control flash floods. Erosion can also be reduced within agricultural zones by particular resource-conserving agricul-tural practices. For an overview on such practices refer to Bossio et al. (2010). These include agroforestry (the incor-poration of trees into agricultural systems) or conservation agriculture (which combines non-inversion tillage (minimum or zero tillage in place of plowing) with mulching or cover cropping and crop rotation).
The 2010 floods in the Indus Basin stressed the urgent need to move from “river control” to “river management” strategies (Gaurav et al., 2011). Alternatives to embankments for flood management must be implemented with an empha-sis on the “living with the flood” concept. Floodplain zoning and mapping projects need to be completed on priority basin (Tariq and van de Giesen, 2011; Gaurav et al., 2011). Basin-scale flood risk maps should be based on historical data as well as modelling approaches. They could be linked to an online database and flood warning system.
Where possible wetlands should be restored and inunda-tion zones should be implemented. In the past, wetlands have generally been considered as wastelands, and have been used for drainage of water, reclaimed for agriculture, or treated as dumping grounds for all kind of refuse (Briscoe and Qamar, 2007). Both wetlands and inundation zones would have a large impact in moderating high flow peaks, in addition to providing important ecosystem services such as groundwa-ter recharge and biodiversity benefits (Mustafa and Wrathall, 2011). People living in such inundation zones could be relo-cated after fair and just compensation. Water managers and engineers of the Indus basin need to be sensitised to the need for adapting to the rhythm of the Indus basin rivers instead of the urge for engineering to control the river. Especially in the wake of climate change, due to which the monsoons will become more unpredictable, the idea of controlling the rivers 100 % is an illusion.
4.2 Water demand management
4.2.1 Managing conjunctive use of surface and groundwater
1076 A. N. Laghari et al.: The Indus basin in the framework of current and future water resources management
in waterlogging whereas at the tail-ends salinity problems are increasing. Through the encouragement of planned conjunc-tive use this situation can be improved. Upstream farmers should make better use of the surface supplies – more re-liable to them – in the canals. For this purpose, the canal department needs to regulate the canal flows to match the requirements.
4.2.2 Rehabilitation and modernization of existing infrastructure
Existing infrastructure for domestic, industrial and agricul-tural water supply should be rehabilitated and modernised. Leakage reduction in domestic water use should be ad-dressed. A major task is adapting yesterday’s irrigation sys-tems to tomorrow’s needs. Modernization, a mix of tech-nological and managerial upgrading to improve responsive-ness to stakeholder needs, will enable more productive and sustainable irrigation. The average irrigation efficiency in India is about 40 % for surface and 60 % for groundwater irrigation (Singh, 2007). Total crop consumption in the In-dian part of the Indus basin is 35 km3for 94 km3withdrawn (Fig. 3). Irrigation efficiencies in the IBIS are also very low (Archer et al., 2010). Of the 175 km3available surface wa-ter resources, about 125 km3(72 %) is withdrawn in the IBIS (Fig. 3). About 25 % of this amount (31 km3) can be quan-tified as conveyance loss in the canal system. Due to water course conveyance losses and field application losses, 69 km3 according to Kreutzmann (2011) or 99 km3according to the dataset (GWSP, 2008) are still available for irrigation agri-culture as blue water consumption (Fig. 3). This low value is responsible for the continuous shortage of irrigation wa-ter in Pakistan as a whole and especially in tail-enders such as Sindh province. The present methods of surface irriga-tion are wasteful and larger doses of through flood irrigairriga-tion with fresh water only add to the non-retrievable pool of poor quality saline groundwater. As such irrigation infrastructure should enable farmers to apply just the right amount of water in small and frequent quantities (e.g. by installation of drip or sprinkler irrigation). Irrigation efficiencies can also be in-creased by reducing irrigation canal leakage.
4.2.3 Increasing water productivity (WP) for agriculture (irrigated and rainfed)
Basically the crop system in the Indus basin is a rice-wheat system. During kharif (summer months, wet season, autumn harvest) rice is grown. In Indian Punjab sowing occurs from Mai to July and harvest from September to October (CWC, 2010). Other kharif crops include cotton, sugarcane and maize. During rabi (winter months, dry season, spring har-vest, water availability is generally lower) wheat is grown. In Indian Punjab sowing occurs from October to November and harvest from April to Mai (CWC, 2010).
An overview on crop areas and harvested areas is shown in Fig. 4. Dominant agricultural production regions are the two Punjabs, Indian Haryana and Pakistani Sindh. The crop area and harvested area under irrigation for the five main crops – wheat, rice, sugarcane, maize and cotton – are also displayed in Fig. 4. Figure 8 displays the area and production of rice (basmati and other varieties) in Pakistani Punjab from 1987–1988 to 2004–2005. This province accounts for more than 50 % of the total rice production and more than 90 % of the total basmati production in Pakistan.
An overview on yields in selected states/regions in the In-dus basin and national averages (India and Pakistan) for the period 1950–1951 to 2008–2009 for the four major crops rice, wheat, cotton and sugarcane is displayed in Fig. 9. It is shown that average yields generally rose during the past decades. The average yield of rice, e.g. in India, rose from about 1000 kg per ha in 1960 to more than 2000 kg per ha currently. Similarly the average yield of rice in Pakistan rose from about 1500 kg per ha in the eighties to about 2000 kg per ha at the beginning of this century. The average yield of wheat in India rose from about 850 kg per ha in 1960 to al-most 3000 kg per ha currently. Similarly, the average yield of wheat in Pakistan rose from about 1700 kg per ha in the eighties to about 2500 kg per ha at the beginning of this cen-tury. There is also an important difference in yields of a cer-tain crop between different regions in the Indus basin and production method. Yields are very high in certain areas and low in other regions of the basin. In the Indian Punjab, for example the yield of irrigated rice is more than 3500 kg per ha, whereas the yield of rainfed rice in Himachal Pradesh is only about 1500 kg per ha. The average rice yield in India is about 2000 kg per ha. Average rice yields of basmati rice in Pakistan are only about 1500 kg per ha. The same observa-tions are valid for wheat. As a country average in Pakistan and India, the yield of wheat increased to about 2500 kg per ha in 2005. In the Indian Punjab irrigated wheat has an av-erage yield of more than 4000 kg per ha, although rainfed wheat in the same province only has an average yield half of this value. The figure also shows that average yields of cot-ton are much less than the yields of wheat and rice, which are in the same range. Especially rainfed cotton has low yields (e.g. about 250 kg per ha in Haryana) whereas irrigated cot-ton yields are higher. Cotcot-ton yields are lower in India as com-pared to Pakistan. Sugar cane has very high yields, ranging from about 25 000 kg per ha as rainfed sugarcane in Haryana up to 60 000 kg per ha in the same state.
Fig. 9. Yield (in kg per ha) in selected states/regions in the Indus basin and national averages (India and Pakistan) for the period 1950–1951
to 2008–2009 of (a) rice; (b) wheat; (c) cotton and (d) sugarcane. Data sources: for Pakistan (GOP, 2005), for India (CWC, 2010).
the total annual production of wheat in the Pakistani part of the Indus Basin was about 18.5 million t (98 % of total Pak-istani production) whereas in the Indian part of the basin this amount was 18.7 million t (27 % of total Indian production). For the total basin production, this results in an average WP of 0.6 kg km−3for wheat. For the Indo-Gangetic basin, Cai et al. (2010) state an average value for wheat of 0.94 kg m−3. For the IBIS, Bastiaanssen et al., (2003) state a productivity per unit consumed of 0.64 kg m−3. The same authors list for the IBIS a WP of 0.42 kg m−3for rice, 0.22 kg m−3for cot-ton and 4.79 kg m−3 for sugarcane. For the Indo-Gangetic basin, Cai et al. (2010) state an average value for rice of 0.74 kg m−3. In Indian Punjab this value is 1.18 kg m−3,
whereas in the Pakistani part of the basin it is 0.69 kg m3. Cai et al. (2010) and Mahajan et al. (2009) give a value of 1.1– 1.63 for rice in Indian Punjab. According to Mekonnen and Hoekstra (2010b), the blue water consumption of rice in the Indus basin is 29 km3 and the green water consumption is 18 km3. For a total annual production of 17.6 million t (of which 4.6 million t in Pakistan, GOP, 2005 and 13 million t in India – 9.2 million t in Punjab alone) the WP is 0.37 kg m−3, considerable lower than wheat. In Pakistan the fraction of blue water to total consumption is relatively higher than in India. Not included in these consumption values is the ad-ditional percolation water required for traad-ditional rice pro-duction. Only for Pakistan, Chapagain and Hoekstra (2011) estimate this value at 1.7 km3green water and 9.6 km3 irriga-tion water. According to Mekonnen and Hoekstra (2010b),
the blue water consumption of cotton in the Indus basin is 20 km3and the green water consumption is 14 km3. For a to-tal annual production of 17.6 million t (of which 5.1 million t in Pakistan and 0.7 million t in India), the WP is 0.17 kg m−3. The latter is a very low value, and cotton is defined as a water intensive crop. Gaining more yield and value from less water can reduce future demands for water, limiting environmental degradation and easing competition for water. Specific ir-rigation techniques (drip irir-rigation, sprinkler irir-rigation) that can deliver water at the appropriate timing and quantifica-tion for the different growing stages of the plants, have large potential for increasing water productivity. The percentage of irrigated area under drip irrigation, e.g. in Indian Pun-jab and Haryana, was 0.5 % in 2000 whereas the potential for both states is estimated at 5.5 % of total irrigated area (Narayanamoorthy, 2009). In 2005 0.5 % of the irrigated area of Punjab was under sprinkler irrigation, whereas in Haryana this value was 30 %. For rice the system of SRI (System of Rice intensification) has a lot of potential. Average yields are considerably increased with this technique, with a reduc-tion in water requirements up to 70%. An overview of this methodology is given by Sharif (2011).
1078 A. N. Laghari et al.: The Indus basin in the framework of current and future water resources management
situ soil and water management and water harvesting tech-niques (bunds, terracing, contour cultivation, land levelling, etc.). An overview on resource-conserving agricultural prac-tices that increase water productivity is given by Bossio et al. (2010).
Not included in the WP values water withdrawals are lost in the system due to poor irrigation efficiencies. This topic was addressed in the previous Sect. 4.2.2 “Rehabilitation and modernization of existing infrastructure”.
4.2.4 Crop planning and diversification; concept virtual water import-export
Cropping planning and diversification includes the growing of crops in regions where or at times of the year when ET requirements are lower. An example of a policy acting on this, is the Punjab Preservation of Sub-Soil Water Act (2010) which prevents farmers from transplanting of paddy before 15 June to reduce ET (groundwater pumpage and energy) during the extremely hot summer months. Pakistani Punjab and other states may also emulate such regulations.
Certain crops produced in the Indus basin are partially ex-ported out of the basin. Especially rice is exex-ported from Pakistan and rice and wheat from Indian Punjab to other In-dian states. Figure 8 shows the area and production of rice (basmati and other varieties) in Pakistani Punjab from 1987– 1988 to 2004–2005 and was discussed in Sect. 3.4 “Shift from surface water to groundwater use”. Punjab province represents 90 % of overall Basmati rice production and more than 50 % of the total rice production in Pakistan. About 70–80 % of rice produced here is basmati. However, from 2001 to 2005, about 40–60 % of all rice produced in Pak-istan was exported (Fig. 8b). Basmati exports increased from 0.6 to 0.9 million t during that period. As discussed in the previous Sect. 4.2.3 “Increasing water productivity (WP) for agriculture (irrigated and rainfed)”, rice is a water intensive crop with an average WP of 0.37 kg m−3. Additionally, large quantities of water (percolation and soil moisture) are re-quired in traditional rice production, which are not consumed by the plant. Especially basmati from Pakistan has low yields as displayed in Fig. 9. Therefore, it is to be re-evaluated whether the production of such a water intensive crop for export is defendable in the current and future situation of the Indus basin. Reducing areas under rice crop may be a long term policy by encouraging rice cultivation in wetter ar-eas or growing water-efficient but high value crops. Also, Qureshi (2011) questions whether Pakistan should continue to grow rice for export or instead use this water for other crops that represent a comparative advantage for the country. According to Verma et al. (2009), the state of Punjab is amongst the largest net virtual water exporters (total amount 20.9 km3per year) within India. Basically large amounts of crops produced are consumed elsewhere in the country, out-side the Indus basin. Proponents of the virtual water trade argue that if certain policies – where farmers receive highly
subsidized agricultural inputs (including water for irrigation) and are assured high prices for the wheat and rice they pro-duce as in Punjab – were to be revised in favour of the wet-ter Indian states, wawet-ter rich states would no longer have to import virtual water from water scarce states (Verma et al., 2009). Since wheat is a low-value crop, one may question whether water allocation to wheat production for export in states such as Punjab is worth the cost (Mekonnen and Hoek-stra, 2010a). Especially for products that are exported out of the Indus basin, an evaluation of benefits (economically and livelihoods) to costs (depletion of water resources) should be made.
4.2.5 Economic instruments (e.g. water pricing)
According to Singh (2007), part of the reason for the low irrigation efficiencies is the highly subsidized price of irriga-tion water that encourages the excessive applicairriga-tion of water to crops. An overview of potentials, problems and prospects for water pricing for irrigation is given by Reddy (2009), and particularly for the Indus basin by Shah et al. (2006, 2009). However, Qureshi et al. (2009) argue that direct manage-ment of an economy with such a large number of farmers through enforcing laws, installing licensing and permit sys-tems and establishing tradable property rights did not prove to be effective in Pakistan. In Pakistan, the use of electric-ity for groundwater pumping started in 1970s. During this period, all capital installation costs were borne by the gov-ernment and electricity tariffs were based on a metering sys-tem. In the 1980s, the population of tube wells surged and due to increasing electricity costs, the government withdrew subsidies on electricity tariffs in the Punjab and the Sindh provinces. As a result, large numbers of electric tube wells were replaced with diesel tube wells. The massive increase in private tubewells, as displayed in Fig. 7a, is thus due to diesel pumps and not electric pumps (which amount has remained rather stable at about 100 000 since the 1980s). Diesel pumps however increased from about 200 000 in 1987 to 900 000 in 2005 (GOP, 2005). This clearly shows that changing energy prices only forces farmers to shift from one mode of energy to another but could not help resolve the real issue of ground-water overdraft. Therefore, changing electricity pricing poli-cies, as the case in parts of India, would have a minor im-pact on controlling the groundwater overdraft. This clearly demonstrates the need to search for more innovative ways to solve the problem of groundwater over-exploitation while maintaining the current levels of agricultural production in view of the increasing population. In the wake of this paper these options are not further explored.
4.2.6 Changing food demand patterns and limiting post-harvest losses
Diets can be influenced through advertising campaigns and appropriate pricing of foods to reflect the scarce resources used in food production (de Fraiture and Wichelns, 2010). The food requirements of diets based on meat from grain-fed cattle may require twice the water required to support vegetarian diets. A diet without meat requires an estimated 2000 l per day to produce, while a diet high in grain-fed beef requires 5000 l of water (Renault and Wallender, 2000). Thus, the potential to reduce pressure on water resources by changes in food consumption patterns seems high. However, in both rural and urban India, the demand for non-grain food crops (vegetables, fruits, oil crops, ...) and animal products (milk, chicken, eggs, fish, ...) is increasing (Amarasinghe et al., 2008). Increasing income and urbanization will further increase the demand for non-grain food products in the In-dian and Pakistani diet.
Post-harvest losses can be reduced by improving trans-portation and storage infrastructure and systems. Estimates of agricultural produce lost in the steps between production and consumption are between 40 % and 50 % (Lundqvist et al., 2008). A study commissioned by the FAO (Gustavsson et al., 2011) has quantified the amount of global food losses and food waste. Roughly one third of the food produced in the world for human consumption every year – approximately 1.3 billion to – gets lost or wasted globally. Fruits and veg-etables, plus roots and tubers have the highest wastage rates of any food. Food losses – occurring at the production, har-vest, post-harvest and processing phases – are most impor-tant in developing countries. Food waste is more a problem in industrialized countries, most often caused by both retail-ers and consumretail-ers throwing perfectly edible foodstuffs into the trash. Per capita food loss in South Asia is about 125 kg a year, whereas per capita food waste is only 6–11 kg per year.
4.3 International collaboration
For nearly 50 yr a relatively stable Indus Water Treaty (IWT) moderated competition for the Indus water between Pakistan and India (Miner et al., 2009). Rising demand for water in each nation could unsettle this stable relationship. For the benefit of their people, Pakistan and India could coordinate bilateral development and resolve issues rather than defer them.
The Permanent Indus Commission (PIC) is responsible for resolving disputes between India and Pakistan over the im-plementation of the Indus Waters Treaty. Disputes are man-aged primarily through regular meetings of the engineers and officials that make up the two national sections of the com-mission (Zawahri, 2009b). Monitoring development projects in the Indus river system by PIC has eased fears of cheat-ing between India and Pakistan (includcheat-ing the confirmation of accuracy of all exchanged data) and helped promote com-pliance with the 1960 Indus Waters Treaty (Zawahri, 2009a).
5 Conclusions
The Indus river basin – shared by Pakistan, India, China and Afghanistan – is one of the most depleted river basins in the world. The basin is confronted with a list of cur-rent and future challenges. Irrigated agriculture is by far the most important water demand stakeholder, but water demands for domestic and industrial purposes are increas-ing, due to population increase (from currently 237 million people to 319 million in 2025 and 383 million in 2050), in-creased urbanisation and industrialisation and the rise in liv-ing standards. Water availability will decrease on the long run due to climate change. A shift from surface water to groundwater use resulted in rapid depletion of groundter resources in the past. There is a large gap between wa-ter withdrawals for irrigation and actual wawa-ter consumed for crop production. Irrigation efficiencies are low. Much of the surface water that enters the system is wasted (also to groundwater recharge). Other challenges in the basin in-clude water logging and salinity, loss of productive agricul-tural land, land degradation and the contamination of surface and groundwater resources.
1080 A. N. Laghari et al.: The Indus basin in the framework of current and future water resources management
to the drainage of wetlands. Due to both deforestation and one of the worldwide highest sediment loads, reservoirs in the Indus basin tend to lose their capacity rather fast. Only by accepting the natural character of the basin again, flood-ing can be addressed. Current forests should be maintained and reforestation should be considered as an option to reduce erosion. Floodplain zoning and mapping projects need to be completed on priority basin. Where possible wetlands should be restored and inundation zones should be implemented.
Water supply management options that need to be ad-dressed to deal with the challenges of the Indus basin are: (1) reservoir management (an increase in reservoir age and the implementation of artificial groundwater stor-age (AGWR)); (2) water quality conservation and invest-ment in wastewater infrastructure; (3) the use of alterna-tive water resources like the recycling of wastewater and desalination (with a substantial potential due to the future increase in domestic and industrial water demands in the basin); (4) land use planning and soil conservation as well as flood management.
In addition to the presented water supply management options, water demand management options are a necessity. Options that are applicable to the Indus basin and would have an important impact to deal with the basin’s challenges are: (1) the management of conjunctive use of surface and groundwater; (2) the rehabilitation and modernization of existing infrastructure; (3) the increase of water productivity for agriculture; (4) crop planning and diversification includ-ing the critical assessment of agricultural export, especially (basmati) rice; (5) economic instruments and (6) changing food demand patterns and limiting post-harvest losses.
Edited by: A. Gelfan
References
Akhtar, A. M., Ahmad, A. N., and Booij, M. J.: The impact of climate change on the water resources of Hindukush-Karakorum-Himalaya region under different glacier coverage scenarios, J. Hydrol., 355, 148–163, 2008.
Ali, J., Benjaminsen, T. A., Hammad, A. A., and Dick, O. B.: The road to deforestation: An assessment of forest loss and its causes in Basho Valley, Northern Pakistan, Global Environ. Change, 15, 370–380, doi:10.1016/j.gloenvcha.2005.06.004, 2005.
Allen, R. G., Pereira, L. S., Raes, D., and Smith, M.: Crop evap-otranspiration – Guidelines for computing crop water require-ments, FAO Irrigation and drainage paper 56, FAO – Food and Agriculture Organization of the United Nations, Rome, 1998. Amarasinghe, U. A., Shah, T., and Malik, R. P. S.: India’s Water
Futures: Drivers of Change, Scenarios and Issues, in: Strategic Analyses of the National River Linking Project (NRLP) of In-dia Series 1 – InIn-dia’s Water Future: Scenarios and Issues, edited by: Amarasinghe, U. A., Shah, T., and Malik, R. P. S., Interna-tional Water Management Institute, Colombo, Sri Lanka, 101– 113, 2008.
Archer, D. R.: Contrasting hydrological regimes in the upper Indus Basin, J. Hydrol., 274, 198–210, 2003.
Archer, D. R., Forsythe, N., Fowler, H. J., and Shah, S. M.: Sus-tainability of water resources management in the Indus Basin under changing climatic and socio economic conditions, Hy-drol. Earth Syst. Sci., 14, 1669–1680, doi:10.5194/hess-14-1669-2010, 2010.
Armstrong, R., Raup, B., Khalsa, S. J. S., Barry, R., Kargel, J., Helm, C., and Kieffer, H.: GLIMS glacier database. Boulder, Colorado USA: National Snow and Ice Data Center, Digital me-dia, http://glims.colorado.edu/glacierdata (last access: 1 Decem-ber 2010), 2005.
Babel, M. S. and Wahid, S. M.: Freshwater under threat: South Asia, Asian Institute of Technology (AIT), United Nations Envi-ronment Programme (UNEP), 2008.
Bastiaanssen, W., Ahmad, M.-U.-D., and Tahir, Z.: Upscaling Wa-ter Productivity in Irrigated Agriculture Using Remote-sensing and GIS Technologies, in: Water Productivity in Agriculture: Limits and Opportunities for Improvement, edited by: Kijne, W., Barker, R., and Molden, D., CAB International, 2003.
Biswas, A. K.: Indus Water Treaty: the Negotiating Process, Water Int., 17, 201–209, 1992.
Bookhagen, B. and Burbank, D. W.: Toward a complete Himalayan hydrological budget: Spatiotemporal distribution of snowmelt and rainfall and their impact on river discharge, J. Geophys. Res., 115, F03019, doi:10.1029/2009jf001426, 2010.
Bossio, D., Geheb, K., and Critchley, W.: Managing water by man-aging land: Addressing land degradation to improve water pro-ductivity and rural livelihoods, Agr. Water Manage., 97, 536– 542, doi:10.1016/j.agwat.2008.12.001, 2010.
Briscoe, J. and Qamar, U.: Pakistan’s Water economy running dry, Oxford University Press, Karachi, Commissioned by World Bank, 2007.
Cai, X., Sharma, B. R., Matin, M. A., Sharma, D., and Gunasinghe, S.: An Assessment of Crop Water Productivity in the Indus and Ganges River Basins: Current Status and Scope for Improve-ment, IWMI Research Report 140, International Water Manage-ment Institute (IWMI), Colombo, 2010.
Cai, X. L. and Sharma, B.: Remote sensing and census based as-sessment and scope for improvement of rice and wheat water productivity in the Indo-Gangetic Basin, Sci. China Ser. E, 52, 3300–3308, doi:10.1007/s11431-009-0346-3, 2009.
Cai, X. L. and Sharma, B. R.: Integrating remote sens-ing, census and weather data for an assessment of rice yield, water consumption and water productivity in the Indo-Gangetic river basin, Agr. Water Manage., 97, 309–316, doi.org/10.1016/j.agwat.2009.09.021, 2010.
Chapagain, A. K. and Hoekstra, A. Y.: The blue, green and grey wa-ter footprint of rice from production and consumption perspec-tives, Ecol. Econom., 70, 749–758, 2011.
CIESIN: Gridded Population of the World Version 3 (GPWv3), Palisades, NY, Socioeconomic Data and Applications Center (SEDAC), Columbia University, 2005.
CWC: Water and related statistics, Central Water Commission of India, 253 pp., 2010.