Does Size Matter? Comparison of Extraction Yields for
Different-Sized DNA Fragments by Seven Different Routine
and Four New Circulating Cell-Free Extraction Methods
Linda Cook,a,bKimberly Starr,cJerry Boonyaratanakornkit,dRandall Hayden,eSoya S. Sam,fAngela M. Caliendog
aVirology Division, Department of Laboratory Medicine, University of Washington, Fred Hutchinson Cancer
Research Center, Seattle, Washington, USA
bVaccine and Infectious Diseases Division, University of Washington, Fred Hutchinson Cancer Research Center,
Seattle, Washington, USA
cMicrobiology Division, Department of Laboratory Medicine, University of Washington, Seattle, Washington,
USA
dExact Diagnostics, Inc., Fort Worth, Texas, USA
eDepartment of Pathology, St. Jude Children’s Research Hospital, Memphis, Tennessee, USA
fDivision of Infectious Diseases, The Miriam Hospital, Providence, Rhode Island, USA
gDepartment of Medicine, Alpert Medical School of Brown University, Providence, Rhode Island, USA
ABSTRACT An element essential for PCR detection of microbial agents in many sample types is the extraction step, designed to purify nucleic acids. Despite the im-portance of this step, yields have not been extensively compared across methods to determine whether the method used contributes to quantitative differences and the lack of commutability seen with existing clinical methods. This may in part explain why plasma and blood viral load assays have proven difficult to standardize. Also,
studies have identified small DNA fragments of ⬍200 bp in plasma (cell-free DNA
[cfDNA]), which may include significant quantities of viral DNA. Our study evaluated extraction yields for 11 commercially available extraction methods, including 4 new methods designed to isolate cfDNA. Solutions of DNA fragments with sizes ranging from 50 to 1,500 bp were extracted, and then the eluates were tested by droplet digital PCR to determine the DNA fragment yield for each method. The results dem-onstrated a wide range of extraction yields across the variety of methods/instru-ments used, with the 50- and 100-bp fragment sizes showing especially inconsistent quantitative results and poor yields of less than 20%. Slightly higher, more consis-tent yields were seen with 2 of the 4 circulating cell-free extraction kits. These re-sults demonstrate a significant need for further evaluation of nucleic acid yields across the variety of extraction platforms and highlight the poor extraction yields of small DNA fragments by existing methods. Further work is necessary to determine the impact of this inconsistency across instruments and the relevance of the low yields for smaller DNA fragments in clinical virology testing.
KEYWORDS extraction yield, ccfDNA, extraction methods, viral diagnostics, viral DNA processing
A
critically important step in the detection of infectious agents in mostpatient-derived samples is the extraction of nucleic acid. Many extraction instruments are available from manufacturers, and each instrument may have a variety of kits and/or protocols, leading to multiple sources of possible variation in extraction results. Most published comparison studies have been limited to 2 to 3 instruments, often from the same manufacturer, or the data may be restricted to a single organism or sample type. In one larger study, Verheyen et al. compared the performance of 5 instruments for the
Received28 June 2018Returned for
modification7 August 2018 Accepted26
September 2018
Accepted manuscript posted online3
October 2018
CitationCook L, Starr K, Boonyaratanakornkit J,
Hayden R, Sam SS, Caliendo AM. 2018. Does size matter? Comparison of extraction yields for different-sized DNA fragments by seven different routine and four new circulating cell-free extraction methods. J Clin Microbiol 56:e01061-18.https://doi.org/10.1128/JCM .01061-18.
EditorYi-Wei Tang, Memorial Sloan Kettering
Cancer Center
Copyright© 2018 American Society for
Microbiology.All Rights Reserved. Address correspondence to Linda Cook, [email protected].
crossm
on May 16, 2020 by guest
http://jcm.asm.org/
extraction of norovirus RNA from stool and cytomegalovirus (CMV) DNA from plasma
(1). They found a spread of more than 3 cycle thresholds (CTs) (equivalent to a 10-fold
difference in extraction yield) in norovirus-positive samples, while CMV-positive sam-ples showed a 5.5-fold spread between the mean for the lowest- and highest-yielding instruments. A limited number of other studies have examined 3 or more extraction systems and evaluated the viral yield for HIV (2–5), hepatitis B virus (6, 7), CMV (8), enterovirus (9), and herpes simplex virus (10). Yang et al. evaluated 6 different extrac-tion instruments targeting 5 different respiratory bacterial and viral pathogens (11);
Dundas et al. used 4 methods with 3 viruses, mycoplasma, andBordetella(12). None of
these studies have identified a clearly superior extraction instrument among the studied applications; rather, 2- to 10-fold differences in yield are often seen across instruments. Thus, for studies that compare molecular test results across multiple laboratories, a significant component of the variation seen could be a result of extraction method differences. When comparing methods that have extraction coupled to PCR, it is often difficult to partition the amount of variability seen in the 2 different steps. We designed this study to evaluate extraction yields across 11 methods, 7 of which are commonly used in clinical laboratories and 4 of which use newly available circulating cell-free (CCF) extraction kits (CCF kits) designed to maximize the yield of cell-free DNA (cfDNA). This is a companion study to a recently completed CMV and Epstein-Barr virus (EBV) commutability study performed with all 6 of the instrument systems utilized in this study (R. Hayden, unpublished data).
Circulating cell-free DNA in blood was initially described by Mandel and Metais in 1948 (13). A possible clinical utility of cfDNA quantitation was proposed when higher concentrations of both normal DNA (cfDNA) and circulating tumor DNA (ctDNA) were found in the sera of cancer patients (14, 15). Under normal conditions, cfDNA consists predominantly of fragments of about 167 bp, which is equivalent to the size of DNA in the chromatosome and similar to the size of fragments produced by apoptosis (16, 17) rather than to the size of the larger, less uniformly sized fragments seen in necrosis (18). In the last 10 years, an explosion of papers in the literature have described the utility of the detection and quantification of cfDNA and ctDNA in a variety of cancers. Significant advancements have included the following. (i) The use of cell-stabilizing sample collection tubes to prevent contamination of plasma with cellular DNA gave increased cfDNA purity and yield. (ii) It was recognized that routinely utilized DNA and total nucleic acid extraction methods lead to the further fragmentation of cfDNA during the extraction process. (iii) The cfDNA plasma/serum concentration was found to be very low, 10 to 100 ng/ml, necessitating the development of better extraction methods for small fragments (14). (iv) Newer CCF extraction methods utilizing starting volumes of up to 5.0 ml and altered temperatures and/or buffer conditions have significantly improved cfDNA yields. Several extensive circulating cell-free DNA (ccfDNA) extraction method comparisons (19–26) and several excellent reviews describing the technical aspects of cfDNA extraction have recently been published (27–32). For this study, we compared the extraction yields for different-sized DNA fragments obtained by seven routine extraction methods to those obtained by four more recently available CCF kit methods.
Although cfDNA has been extensively studied in cancer, little is known about cfDNA in infectious diseases other than EBV-associated tumors. In 2003, Chan et al. demon-strated that an EBV PCR assay with an 82-bp amplicon detected 7.5 times more EBV in nasopharyngeal cancer patients’ plasma than an assay with a 181-bp amplicon (60). The sensitivity of this assay for EBV cfDNA was enhanced using PCR primers specific for the internal repeat 1 region of the EBV genome (about 10 repeated copies/genome). Many studies have now confirmed the utility of EBV cfDNA measurements for the detection of nasopharyngeal carcinoma, therapeutic response monitoring, prediction of a recur-rence, and monitoring of at-risk populations (33–39). It is unknown for other viruses whether small fragments of viral nucleic acid are present in the cfDNA. For CMV, there are multiple published studies indicating the possibility that fragmented DNA may be important for CMV PCR quantitation. CMV DNA in plasma has been shown to
on May 16, 2020 by guest
http://jcm.asm.org/
inantly consist of very small fragments of⬍138 bp (40–42). Given these observations from CMV and EBV studies, it seems vital that we more clearly understand what nucleic acid-sized fragments are present in plasma and other body fluids for all clinically relevant viruses and how effectively they are extracted with the methods currently used. We have designed this study to carefully evaluate the yields of artificially created small DNA fragments with a variety of commonly used clinical extraction methods to begin to address this important issue.
MATERIALS AND METHODS
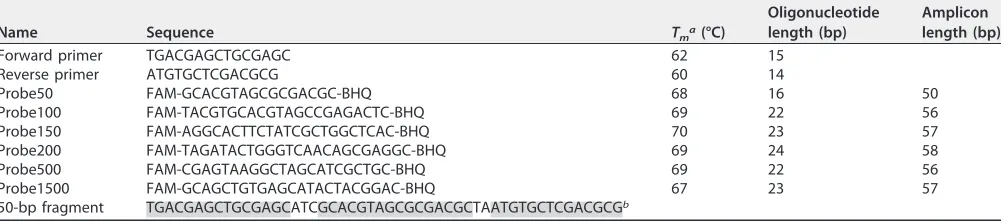
Sample preparation and extraction.Oligonucleotide fragments with sizes of 50, 100, 150, 200, 500, and 1,500 bp were constructed by the generation of random DNA sequences (Table 1) at GenScript (Piscataway, NJ). Imbedded within each oligonucleotide were identical forward and reverse primer sequences separated by random intervening sequences of different lengths for which a corresponding 6-carboxyfluorescein (FAM)-labeled black hole quencher (BHQ) probe was designed. Each fragment had an ATC at the 3=end of the 5=primer sequence and a TA at the 5=end of the 3=primer. Each of the fragments had a single amplicon sequence inserted into the fragment. In order to minimize PCR variability, the amplicons were designed to have very similar sizes; the amplicon sizes varied from 50 to 58 bp in length for the different fragment sizes. For each fragment size, the DNA fragments were assigned quantities on the basis of the results from the droplet digital PCR (ddPCR) assay and then diluted in EDTA plasma to concentrations of 4.0, 5.0, and 6.0 log10copies/ml for subsequent extraction. The fragments were separately diluted in TE (Tris-EDTA) buffer for use as nonextracted controls. Aliquots of each fragment were frozen at⫺20°C and then shipped to the 3 participating laboratories. Four replicate extractions for each size/concentration were done with each of the 11 different instruments/ methods, as described in Table 2. Kit selection and the method used for each assay were based on the manufacturers’ recommendations for optimum routine DNA virus extraction. All extractions were per-formed according to the manufacturers’ instructions. After extraction, the resulting eluates were frozen until tested with the ddPCR assay.
[image:3.585.43.547.84.195.2]ddPCR quantitation of extracted fragments.Quantitation of the extracted fragments was done by ddPCR with the primers and probes listed in Table 1 in the laboratory at Exact Diagnostics, Inc. (Fort Worth, TX). A Bio-Rad QX200 system (Bio-Rad Laboratories, Inc., Hercules, CA) was used for analysis, with the final master mix containing 15.5l Bio-Rad ddPCR SuperMix and 6.5l of eluate with the primers
TABLE 1Primers/probes and oligonucleotide sequences
Name Sequence Tma(°C)
Oligonucleotide length (bp)
Amplicon length (bp)
Forward primer TGACGAGCTGCGAGC 62 15
Reverse primer ATGTGCTCGACGCG 60 14
Probe50 FAM-GCACGTAGCGCGACGC-BHQ 68 16 50
Probe100 FAM-TACGTGCACGTAGCCGAGACTC-BHQ 69 22 56
Probe150 FAM-AGGCACTTCTATCGCTGGCTCAC-BHQ 70 23 57
Probe200 FAM-TAGATACTGGGTCAACAGCGAGGC-BHQ 69 24 58
Probe500 FAM-CGAGTAAGGCTAGCATCGCTGC-BHQ 69 22 56
Probe1500 FAM-GCAGCTGTGAGCATACTACGGAC-BHQ 67 23 57
50-bp fragment TGACGAGCTGCGAGCATCGCACGTAGCGCGACGCTAATGTGCTCGACGCGb
aT
m, melting temperature.
bShading indicates the locations of the primers and probe in the sequence.
TABLE 2Extraction instrument information
Extraction instrument Extraction kit
Input vol (l)
Elution vol (l)
Fold
concn Lab performing the assay
Qiagen EZ1 Advanced DSP virus kit 400 60 6.7 Miriam Hospital
Abbott M2000sp mSample Preparation SystemDNA 500 110 4.5 Miriam Hospital
Qiagen QIAsymphony SP DNA minikit 200 200 1.0 St. Jude
BioMerieux Nuclisens EasyMag Universal RNA/DNA kit 200 100 2.0 St. Jude
Roche MagNaPure 96 DNA/viral NA small volume 200 100 2.0 University of Washington
Promega Maxwell 16 RSC Total nucleic acid 200 100 2.0 University of Washington
Qiagen spin column (manual) Qiagen MinElute virus spin column 200 100 2.0 Exact Diagnostics, Inc.
CCF kits
Promega Maxwell 16 CCF RSC ccfDNA plasma 200a 100 2.0 University of Washington
Qiagen spin column (manual) QIAamp circulating nucleic acid 1,000 100 10.0 Exact Diagnostics, Inc.
Qiagen EZ1 Advanced EZ1 CCF DNA 200 60 3.3 Miriam Hospital
Qiagen QIAsymphony SP CCF kit 2,000 60 33.3 St. Jude
aThis kit takes up to a 1.0-ml volume, but only 200l was used for this evaluation.
on May 16, 2020 by guest
http://jcm.asm.org/
[image:3.585.41.553.581.730.2]at 900 nM and the probes at 250 nM. Each set of 4 replicate extraction eluates was individually tested. After droplet generation utilizing a Bio-Rad droplet generator was completed, standard PCR was done using a Bio-Rad C1000 Touch thermal cycler. Reactions were as follows: 95°C for 10 min; 60 cycles of 94°C for 30 s and then 58°C for 60 s; then 98°C for 10 min; and then, finally, a hold at 12°C until the samples were removed from the instrument. After the completion of the PCR amplification, samples were analyzed on a Bio-Rad QX200 ddPCR instrument. Data from 4 replicate extractions for each sample were merged in Bio-Rad QuantaSoft analysis software (v1.7.4) to calculate a final mean number of copies per milliliter for each extraction eluate (45,000 to 50,000 droplets were analyzed per extraction point). The mean number of copies per milliliter and the 95% Poisson distribution of the mean for each extraction point were obtained from the Bio-Rad analysis result tables. The coefficient of variation (CV) was calculated from the 95% Poisson distribution using Microsoft Excel software. All graphics were made with GraphPad Prism (v7) software.
To more closely examine the extraction yields for the CCF kits, a percent yield was calculated to compare the yields of the CCF kits to those of their corresponding routine kits [(CCF kit yield/routine kit yield)⫻ 100⫽percent yield]. In addition, the percent yield for each extraction was calculated by comparison to that for the unextracted material [(extracted material yield/unextracted material yield)⫻ 100⫽percent yield]. Because the unextracted control was diluted in TE buffer rather than EDTA plasma, the absolute quantity of the fragments might be different in the two solutions. When percent yield results were calculated, some results were significantly higher than 100%, implying that use of the unextracted DNA quantities may underestimate the actual DNA quantity in the corresponding unex-tracted EDTA plasma samples (the ideal denominator for the percent yield calculation). Despite this limitation, unextracted quantities were used to calculate percent yields to allow yields across all extraction methods to be compared to each other. Thus, all percent yields given in the Results are relative rather than absolute values.
RESULTS
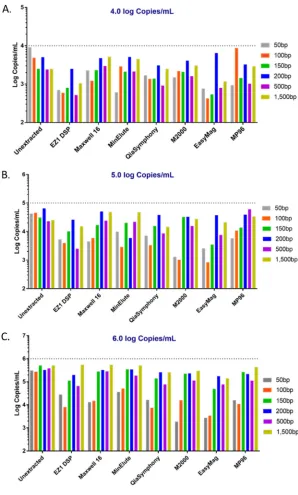
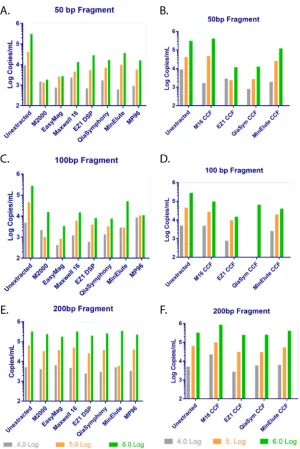
Evaluation of extraction yields for routine methods.There was a large variation in the quantity and percent yield across the data. Figure 1 displays the yields seen for each method and fragment size stratified by fragment concentration. Essentially all unextracted fragments made in TE buffer were measured to be present at concentra-tions that were about 50% of the theoretical concentration, demonstrating that our process for making the fragment solutions probably resulted in a quantity 50% lower than expected based on the theoretical concentration. This was relatively consistent across all concentrations and extractions. Overall extraction yields were the highest with the Promega Maxwell 16 and Qiagen MinElute kits and lowest with the bioMérieux EasyMag kit. Compared to the yields for the unextracted controls, the yields were the lowest at the lowest fragment concentration and the highest at the highest fragment concentration. Yields significantly lower than expected were seen with essentially all 50-bp and 100-bp extractions, indicating the poor extraction of smaller DNA fragments with all 7 routine methods. The highest yields and greatest agreement across methods
were seen for the 6.0-log10-copy/ml concentration with the larger 200-, 500-, and
1,500-bp fragments. All extraction data are graphically presented for both quantity and percent yield in Fig.S1 and S2 in the supplemental material.
Evaluation of extraction yields for CCF methods.The fragment yields obtained for the 4 CCF kits are displayed in Fig. 2. As was true for the routine methods, the yields for the CCF kit extractions were also extremely variable across methods and fragment concentrations. Extraction yields were higher with the Promega Maxwell 16 and Qiagen MinElute CCF kits than the other two CCF kits. Although they were designed to increase the yields of smaller fragments, CCF kit yields for the smaller 50- and 100-bp fragments were still very low, although they were somewhat higher than those for the routine kits. As was seen with the routine kits, the highest yields and best precision were seen with the larger 200-, 500-, and 1,500-bp fragments.
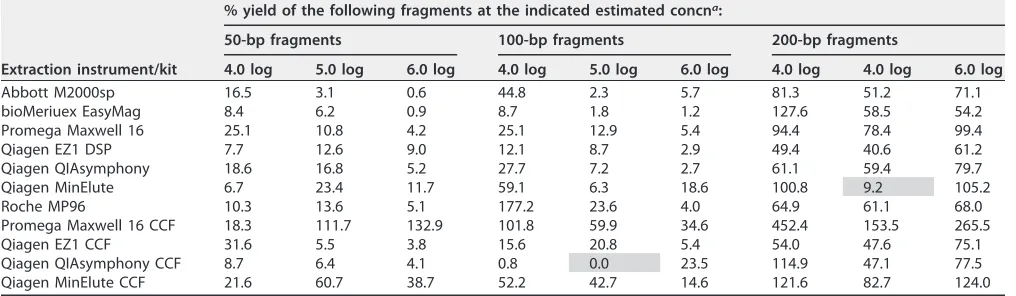
Extraction yields for smaller DNA fragments.Table 3 contains quantitative per-cent yields for all methods compared to those for their nonextracted controls for the
50-, 100-, and 200-bp fragments. Most of the methods extracted⬍20% of the 50-bp
fragments, with most methods displaying decreasing percent yields as the fragment concentration increased. The 100-bp fragments showed a similar pattern, with the percent yields being slightly higher for some methods. This may imply that there is a limited capacity to bind or elute smaller fragments within the components of most methods. This was clearly not the case with the larger fragments, as percent yields ranged from 50 to 100% for the 200-, 500-, and 1,500-bp fragments at all 3
on May 16, 2020 by guest
http://jcm.asm.org/
trations (see Fig. S2 in the supplemental material for the yields for the 150-, 500-, and 1,500-bp fragment sizes). In contrast, the Promega M16 CCF method appeared to have a good overall percent yield for all combinations except for the sample with the lowest concentration of 50 bp. The Qiagen MinElute CCF kit appeared to perform with the 2nd highest yields overall. Surprisingly, the other 2 CCF kits did not appear to significantly outperform their non-CCF kits for the 50- and 100-bp fragments in this analysis.
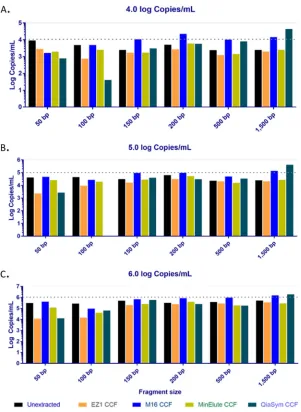
Figure 3 shows these data in graphic form. Compared to the unextracted control material, only the 200-bp fragment showed relatively consistent extraction yields across the different concentrations and methods.
Routine versus CCF kit performance.To further investigate the performance of the CCF methods, we compared the relative yields of the CCF methods with those of
FIG 1Quantitative yields for all routine DNA extraction methods separated by instrument and fragment concentration. Dotted horizontal lines represent the theoretical 100% yield at each concentration.
on May 16, 2020 by guest
http://jcm.asm.org/
[image:5.585.55.353.70.565.2]the routine methods for the 4 instruments/methods which had both methods available. Table 4 contains the quantitative yields for each of the 4 methods for the 50-bp and 100-bp fragment sizes at all 3 concentrations. Similar patterns were seen for fragments of both sizes. These consisted of overall low yields with similar quantities at the lowest concentration, with only a 4- to 8-fold difference in quantity being seen between the lowest and the highest yields and with little impact of the CCF method being seen. In contrast, at the highest concentration, the Promega Maxwell 16 and Qiagen MinElute CCF kits gave significantly higher yields than the routine kits, with 32-fold and 3.3-fold higher yields, respectively, for the 50-bp fragment extraction and a 6.4-fold higher yield with the Promega Maxwell 16 kit for the 100-bp fragment extraction. Extraction yields for the Qiagen QIAsymphony and the Qiagen EZ1 CCF kits were low and not signifi-cantly different from the yields seen with their routine kits. Even with the increased yields for 2 of the CCF kits, most yields were under 10%.
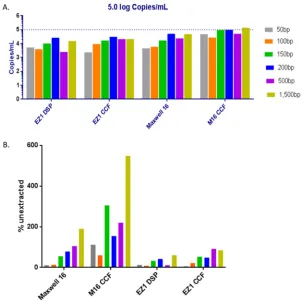
Figure 4 graphically represents the results comparing two of the CCF kit methods.
Figure 4A focuses on the 5.0-log10-copy/ml fragment concentration and shows that the
FIG 2CCF kit extraction yields. Quantitative yields for all CCF kits are shown, with the data being separated by instrument and fragment concentration. Dotted horizontal lines represent the theoretical 100% yield at each concentration. The unextracted samples were fragments made to 4.0, 5.0, and 6.0 log10copies/ml in TE (Tris-EDTA) buffer and run by ddCPR without extraction. M16, Maxwell 16; QiaSym, QIAsymphony.
on May 16, 2020 by guest
http://jcm.asm.org/
[image:6.585.56.357.69.481.2]highest yields were seen under all conditions for the Promega Maxwell 16 CCF kit. Figure 4B contains percent yields relative to that the unextracted control for the same 4 methods. Again, the highest relative yields were seen with the Promega Maxwell 16 CCF extraction. Although the Promega Maxwell 16 kit clearly gave the highest yields for the 50- and 100-bp fragments, the overall yield was still poor for all kits with these small fragments.
Extraction and ddCPR result precision.All data previously presented represent the mean number of copies per milliliter calculated by pooling the data generated from 4 individual extraction/ddPCR replicates done for each combination of instrument, fragment size, and fragment concentration. Because the results generated had a tremendous amount of variability overall, we examined the coefficient of variation (CV) for the 4 individual results in an effort to further identify possible sources of variation and to determine whether the large variability seen between extraction methods is a result of extraction reproducibility or ddPCR variability. The CV that we calculated reflects all between-sample within-run precision, whether variation was due to the extraction or the ddPCR assay step. PCRs are known to have lower precision at small quantities, and our data support that conclusion. Our data also support a second conclusion: that the methods extract smaller fragments less precisely than larger fragments. The CVs for all results are found in Table S1. Overall, the variability within the replicates was the highest with samples with lower concentrations and with smaller fragment sizes. Representative results are found in Fig. 5, where the highest variability is seen with the 50-bp fragment at the lowest fragment concentration (average CV for
all methods⫽16.11%), while the highest precision (lowest variability) was seen with
the 1,500-bp fragment and the highest concentration (CV⫽0.97%).
When the CVs for the unextracted fragment yield were compared to those for the extracted material, they appeared to be similar. This may imply that the majority of the variation seen at a given fragment concentration/size was due to the ddPCR process rather than the extraction process. However, variation due to an instrument component was also present, as some instruments had higher CVs than others, while EasyMag gave the highest CVs at 8 of 18 points (Table S1). Surprisingly, the manual Qiagen MinElute method, which may be expected to have higher variation, had CVs within the range of those of the automated methods except at the lowest fragment size/concentration. Overall, the precision appeared to be the best for the CCF kits, with the Qiagen MinElute CCF manual kit or the Promega Maxwell 16 CCF kit methods producing the lowest overall CV values for 14 of the 18 points. This may be partly due to the increased concentrations of the eluates in some of the CCF kit methods, but this was not true for
the Promega Maxwell 16 method done with a 2⫻concentration factor. Alternatively,
[image:7.585.41.549.85.233.2]there may have been something unique to the CCF extraction methods that allowed for increased precision during the extraction process.
TABLE 3Extraction percent yields by fragment size
Extraction instrument/kit
% yield of the following fragments at the indicated estimated concna:
50-bp fragments 100-bp fragments 200-bp fragments
4.0 log 5.0 log 6.0 log 4.0 log 5.0 log 6.0 log 4.0 log 4.0 log 6.0 log
Abbott M2000sp 16.5 3.1 0.6 44.8 2.3 5.7 81.3 51.2 71.1
bioMeriuex EasyMag 8.4 6.2 0.9 8.7 1.8 1.2 127.6 58.5 54.2
Promega Maxwell 16 25.1 10.8 4.2 25.1 12.9 5.4 94.4 78.4 99.4
Qiagen EZ1 DSP 7.7 12.6 9.0 12.1 8.7 2.9 49.4 40.6 61.2
Qiagen QIAsymphony 18.6 16.8 5.2 27.7 7.2 2.7 61.1 59.4 79.7
Qiagen MinElute 6.7 23.4 11.7 59.1 6.3 18.6 100.8 9.2 105.2
Roche MP96 10.3 13.6 5.1 177.2 23.6 4.0 64.9 61.1 68.0
Promega Maxwell 16 CCF 18.3 111.7 132.9 101.8 59.9 34.6 452.4 153.5 265.5
Qiagen EZ1 CCF 31.6 5.5 3.8 15.6 20.8 5.4 54.0 47.6 75.1
Qiagen QIAsymphony CCF 8.7 6.4 4.1 0.8 0.0 23.5 114.9 47.1 77.5
Qiagen MinElute CCF 21.6 60.7 38.7 52.2 42.7 14.6 121.6 82.7 124.0
aEstimated fragment concentrations are in log
10number of copies per milliliter. Results in shaded cells appear to be extraction failures.
on May 16, 2020 by guest
http://jcm.asm.org/
DISCUSSION
Results from these studies demonstrate significant differences in fragment extrac-tion yields across multiple routinely utilized instruments. We also clearly showed overall poor yields of smaller DNA fragments even at high concentrations in essentially all routinely used methods, and in only 2 of 4 CCF methods was there an improved yield of smaller fragments, although they were still low. Thus, the extraction of these artificial lab-generated small DNA fragments from plasma was performed poorly by all kits evaluated in this study. Further study is necessary to determine if a similar lack of yield would be seen for small viral DNA fragments present in clinical patient samples, in plasma (as studied here), as well as in other clinically relevant sample types. It is possible that these artificial DNA fragments could differ in some way to cause
extrac-tion of them to have a profile different from that of viral DNA fragments generatedin
vivo. We did not attempt to adjust instrument protocols to maximize small fragment
yields but, rather, attempted to assess small DNA fragment yields with existing clinical
FIG 3Quantitative yields displayed on the basis of the fragment size for the 50-, 100-, and 200-bp fragments. (A, C, E) Results obtained by routine extraction methods; (B, D, F) results obtained with the CCF kits.
on May 16, 2020 by guest
http://jcm.asm.org/
[image:8.585.56.356.68.517.2]extraction instruments/protocols for plasma CMV and EBV. It is possible that the manufacturers of these instruments could have or may develop other protocols to increase DNA fragment yields, but that was not the purpose of this study.
[image:9.585.46.544.84.232.2]Significant differences in yields between the plasma-extracted and unextracted controls in TE buffer were seen, making it difficult to determine the 100% yield value. The use of carrier RNA, DNA, or protein in the TE buffer may have increased the stability during storage and impacted the PCR yield of the unextracted control fragments. After review of the data, we chose to present most of the data as quantitative data rather than as percent yield to minimize this issue within the results.
TABLE 4Yields for the 50-bp and 100-bp fragment extractions
Instrument/kit
Yield (log10no. of copies/ml) of the following fragments at the indicated estimated concna:
50-bp fragment 100-bp fragment
4.0 log 5.0 log 6.0 log 4.0 log 5.0 log 6.0 log
Promega Maxwell 16 2,280 4,520 13,000 1,220 5,870 14,900
Promega Maxwell 16 CCF 1,660 46,900 412,000 4,960 27,200 95,600
Qiagen QIAsymphony 1,690 7,070 16,200 1,350 3,280 7,580
Qiagen QIAsymphony CCF 790 2,690 12,700 41 0 64,900
Qiagen EZ1 DSP 696 5,280 27,900 589 3,960 8,070
Qiagen EZ1 CCF 2,870 2,330 11,700 762 9,440 14,800
Qiagen MinElute 609 9,820 36,400 2,880 2,880 51,400
Qiagen MinElute CCF 1,960 25,500 120,000 2,540 19,400 40,400
aThe yield is the final concentration measured by ddPCR. Initial estimated fragment concentrations are in log
10number of copies per milliliter.
FIG 4Quantitative yields displayed on the basis of the fragment size for all fragment sizes at 5.0 log10 copies/ml. (A) Fragment yields separated by the instrument/kit utilized and then the yields of each fragment size. (B) The yield for each method compared to the yield for the unextracted (TE buffer) control (extracted/unextracted control).
on May 16, 2020 by guest
http://jcm.asm.org/
[image:9.585.54.356.395.697.2]Since all the extractions were evaluated for fragment quantity by the same ddPCR assay, it was possible for us to evaluate instrument extraction precision. Our analysis, based on the CV data, demonstrated that for a given fragment size at difference concentrations, most of the variation seen is due to increased ddPCR variability at low quantities. In addition, at a given concentration with different-sized fragments, most of the variation was due to the extraction variability of the smaller fragments. Given the
very tight CVs for the larger fragments and the CVs of ⬍20% overall even at the
smallest fragment sizes, we conclude that variation from the ddPCR assay is a relatively insignificant component of the total variation seen across extraction methods for fragment DNA yields in this study.
Unfortunately, this study did not include the Roche Cobas AmpliPrep/Cobas TaqMan instrument (Pleasanton, CA), which is the method most commonly used for CMV quantitation (46% of respondents in the 2017 to 2018 College of American Pathologists proficiency surveys indicate that they use this method). This method was not included due to the inability to obtain eluate prior to the automated addition of PCR reagents to the eluate tube. However, for the next 3 most commonly used instrument systems, the extraction methods used in this study are essentially equivalent to those used in other FDA-cleared CMV and/or EBV assays, the Abbott RealTime M2000sp (Des Plaines, IL), the Qiagen QIAsymphony RGQ MDx, and the Qiagen EZ1 Advanced (Germantown, MD) assays. Extraction yields for these three methods compared to each other dem-onstrated 3- to 20-fold differences in results across all fragment sizes and concentra-tions. A careful examination of the data contained in Table 3 reveals significant differences between the yields obtained with each of these clinical instruments across the variety of fragment sizes and concentrations. In some cases, the differences were more than a log. Given these results with the artificially created fragments, if similar differences were demonstrated for viral DNA fragments in clinical samples, these extraction differences may contribute to the significant variation in results seen in clinical CMV and EBV studies. Extraction differences may also negatively impact stan-dardization efforts, since existing WHO and NIST standards are intact virus, while some patient samples may contain levels of DNA fragments that may further impact the commutability of standard materials and patient results.
These studies clearly demonstrate the failure of even the CCF extraction methods to extract artificially created smaller DNA fragments efficiently. The Promega Maxwell 16 CCF kit performed significantly better than the other kits, and the Qiagen MinElute CCF
FIG 5Comparison of the coefficients of variation for four selected combinations of fragment size and concentration. The percent CVs for the extraction yields for 4 selected combinations of fragment size and concentration are represented graphically. The unextracted control is represented by the black bar, and for each of the 4 sets represented, the remaining bars present in order from left to right the results for EasyMag, EZ1 DSP, MP96, MinElute, Maxwell 16, m2000sp, QIAsymphony and then a space, followed by the results for the CCF kits (EZ1 CCF, MinElute CCF, Maxwell 16 CCF, and QIAsymphony CCF).
on May 16, 2020 by guest
http://jcm.asm.org/
[image:10.585.87.327.68.243.2]kit performed somewhat better than the other 2 methods, but overall yields were still
⬍20% for most fragment sizes and concentrations. Utilizing CCF kits with large sample
input volumes could improve assay sensitivity; however, this increased volume may be a drawback in some clinical settings and with some sample types. Intensive efforts are ongoing in the tumor DNA field to design and validate better-performing CCF meth-ods/kits for clinical testing. Similar efforts are needed to validate better extraction methods and determine the clinical utility of improved CCF methods in clinical micro-biology laboratories, especially for viral diagnostics.
Currently, little is known about the clinical impact of our observations of extremely low extraction yields for small DNA fragments in viral disease testing. Only in EBV-associated nasopharyngeal cancer has the size of DNA been carefully studied and has it been clearly shown that accurate measurements of small fragments are critical to the measurement of the EBV-associated tumor burden. Small DNA fragment detection is less carefully studied in the large variety of other EBV-associated infections and tumors. A strong indication that the measurement of cfDNA may have clinical utility can be found in a study by Ryan et al. which showed that plasma from lymphoma patients contained unencapsulated DNA (cfDNA?), while plasma from patients with active infections contained both encapsulated and naked DNA (43). Many studies have found utility for EBV PCR plasma testing in patients with EBV-associated malignancies (44–55), but few have utilized newer CCF extraction methods. Lit et al. studied EBV-associated lymphoma patients and demonstrated cfDNA in some but not all patients with active disease, while inactive/remission cases had only larger cell-associated EBV DNA (47). In summary, the detection and quantitation of both EBV cfDNA and larger EBV DNA fragments may be important for diagnosis and monitoring with plasma/whole-blood EBV PCR testing. Further studies are necessary to determine how useful the detection of cfDNA may be in all EBV-associated diseases.
A few studies have described cfDNA-sized fragments in CMV infections, but addi-tional studies are critical to elucidate this further. Boom et al. measured CMV DNA in plasma and whole blood from 3 renal transplant cases with primary CMV infections and
demonstrated that the CMV DNA present was predominantly⬍2,000 bp in size (40).
Preiksaitis et al. evaluated 10 CMV DNA quantitation methods in 6 labs and found a
strong high bias for assay results with PCR amplicons of ⬍100 bp (41). Tong et al.
analyzed CMV quantities in plasma from 20 solid organ transplant recipients and demonstrated that 10 of the patients had predominantly unencapsulated CMV DNA detected at 2.6-fold higher levels when amplifying an 81-bp amplicon than when amplifying a 138-bp amplicon (42).
Finally, four single case reports offer tantalizing additional evidence that measure-ments of cfDNA may be useful in infections and malignancies associated with viruses other than EBV and CMV. A recent study by Chesnais et al. successfully detected CMV cfDNA sequences in mothers with low CMV viral loads (56) and also detected other viruses in some mothers and preterm babies. Two single case reports for Kaposi’s sarcoma and BK polyomavirus-associated bladder cancer demonstrated that quantita-tive measurements of cfDNA containing human herpesvirus 8 or BK virus were useful in tumor detection and therapeutic monitoring of these two virus-associated cancers (57, 58). Finally, Kowarsky et al. utilized next-generation shotgun sequencing of cfDNA in the blood of 188 transplant patients and pregnant women and identified hundreds of new bacterial and viral species (59).
Clearly, the study of viral fragments in cfDNA extracted with CCF kits could be an exciting area of investigation leading to increased sensitivity and better consistency in the detection and quantification of viral sequences in plasma/serum. Our study has clearly demonstrated that extraction differences, including those from the use of CCF kits, could contribute to the lack of agreement across different methods when samples contain fragmented viral DNA. Further work is necessary to determine the clinical utility of accurately measuring small viral DNA fragments in clinical settings.
on May 16, 2020 by guest
http://jcm.asm.org/
SUPPLEMENTAL MATERIAL
Supplemental material for this article may be found athttps://doi.org/10.1128/JCM
.01061-18.
SUPPLEMENTAL FILE 1, PDF file, 0.2 MB.
ACKNOWLEDGMENTS
We thank Wahaj Zuberi for DNA fragment material preparation and ddPCR testing; Ederlyn Atienza, Sir Suganda, and Vijaya Rajagopal for help with the technical aspects of all extractions; and all manufacturers of instruments and reagents for their support. The work was supported in part by Lifespan/Tufts/Brown Center for AIDS Research (P30AI042853) and by ALSAC.
REFERENCES
1. Verheyen J, Kaiser R, Bozic M, Timmen-Wego M, Maier BK, Kessler HH. 2012. Extraction of viral nucleic acids: comparison of five automated nucleic acid extraction platforms. J Clin Virol 54:255–259.https://doi.org/ 10.1016/j.jcv.2012.03.008.
2. Cornelissen M, Gall A, Vink M, Zorgdrager F, Binter S, Edwards S, Jurri-aans S, Bakker M, Ong SH, Gras L, van Sighem A, Bezemer D, de Wolf F, Reiss P, Kellam P, Berkhout B, Fraser C, van der Kuyl AC, Consortium B. 2017. From clinical sample to complete genome: comparing methods for the extraction of HIV-1 RNA for high-throughput deep sequencing. Virus Res 239:10 –16.https://doi.org/10.1016/j.virusres.2016.08.004. 3. Alp A, Hascelik G. 2009. Comparison of 3 nucleic acid isolation methods
for the quantification of HIV-1 RNA by Cobas TaqMan real-time poly-merase chain reaction system. Diagn Microbiol Infect Dis 63:365–371.
https://doi.org/10.1016/j.diagmicrobio.2008.12.014.
4. Stevens W, Horsfield P, Scott LE. 2007. Evaluation of the performance of the automated NucliSENS easyMAG and EasyQ systems versus the Roche AmpliPrep-AMPLICOR combination for high-throughput monitoring of human immunodeficiency virus load. J Clin Microbiol 45:1244 –1249.
https://doi.org/10.1128/JCM.01540-06.
5. Swanson P, Holzmayer V, Huang S, Hay P, Adebiyi A, Rice P, Abravaya K, Thamm S, Devare SG, Hackett J, Jr. 2006. Performance of the automated Abbott RealTime HIV-1 assay on a genetically diverse panel of specimens from London: comparison to VERSANT HIV-1 RNA 3.0, AMPLICOR HIV-1 MONITOR v1.5, and LCx HIV RNA quantitative assays. J Virol Methods 137:184 –192.https://doi.org/10.1016/j.jviromet.2006.06.010.
6. Kang SH, Lee EH, Park G, Jang SJ, Moon DS. 2012. Comparison of MagNA Pure 96, Chemagic MSM1, and QIAamp MinElute for hepatitis B virus nucleic acid extraction. Ann Clin Lab Sci 42:370 –374.
7. Pyne MT, Vest L, Clement J, Lee J, Rosvall JR, Luk K, Rossi M, Cobb B, Hillyard DR. 2012. Comparison of three Roche hepatitis B virus viral load assay formats. J Clin Microbiol 50:2337–2342.https://doi.org/10.1128/ JCM.00746-12.
8. Bravo D, Clari MÁ, Costa E, Muñoz-Cobo B, Solano C, José Remigia M, Navarro D. 2011. Comparative evaluation of three automated systems for DNA extraction in conjunction with three commercially available real-time PCR assays for quantitation of plasma cytomegalovirus DNAe-mia in allogeneic stem cell transplant recipients. J Clin Microbiol 49: 2899 –2904.https://doi.org/10.1128/JCM.00785-11.
9. Shulman LM, Hindiyeh M, Muhsen K, Cohen D, Mendelson E, Sofer D. 2012. Evaluation of four different systems for extraction of RNA from stool sus-pensions using MS-2 coliphage as an exogenous control for RT-PCR inhibi-tion. PLoS One 7:e39455.https://doi.org/10.1371/annotation/c5a7bd78 -0cd2-4575-a9fe-6729b2c2a217.
10. Espy MJ, Rys PN, Wold AD, Uhl JR, Sloan LM, Jenkins GD, Ilstrup DM, Cockerill FR, III, Patel R, Rosenblatt JE, Smith TF. 2001. Detection of herpes simplex virus DNA in genital and dermal specimens by Light-Cycler PCR after extraction using the IsoQuick, MagNA Pure, and BioRo-bot 9604 methods. J Clin Microbiol 39:2233–2236. https://doi.org/10 .1128/JCM.39.6.2233-2236.2001.
11. Yang G, Erdman DE, Kodani M, Kools J, Bowen MD, Fields BS. 2011. Comparison of commercial systems for extraction of nucleic acids from DNA/RNA respiratory pathogens. J Virol Methods 171:195–199.https:// doi.org/10.1016/j.jviromet.2010.10.024.
12. Dundas N, Leos NK, Mitui M, Revell P, Rogers BB. 2008. Comparison of automated nucleic acid extraction methods with manual extraction. J Mol Diagn 10:311–316.https://doi.org/10.2353/jmoldx.2008.070149.
13. Mandel P, Metais P. 1948. Les acides nucleiques du plasma sanguin chez i’homme. C R Seances Soc Biol Fil 142:241–243. (In French.)
14. Leon SA, Shapiro B, Sklaroff DM, Yaros MJ. 1977. Free DNA in the serum of cancer patients and the effect of therapy. Cancer Res 37:646 – 650. 15. Stroun M, Anker P, Maurice P, Lyautey J, Lederrey C, Beljanski M. 1989.
Neoplastic characteristics of the DNA found in the plasma of cancer patients. Oncology 46:318 –322.https://doi.org/10.1159/000226740. 16. Jahr S, Hentze H, Englisch S, Hardt D, Fackelmayer FO, Hesch RD,
Knippers R. 2001. DNA fragments in the blood plasma of cancer patients: quantitations and evidence for their origin from apoptotic and necrotic cells. Cancer Res 61:1659 –1665.
17. Kornberg RD, Lorch Y. 1999. Twenty-five years of the nucleosome, fundamental particle of the eukaryote chromosome. Cell 98:285–294.
https://doi.org/10.1016/S0092-8674(00)81958-3.
18. Underhill HR, Kitzman JO, Hellwig S, Welker NC, Daza R, Baker DN, Gligorich KM, Rostomily RC, Bronner MP, Shendure J. 2016. Fragment length of circulating tumor DNA. PLoS Genet 12:e1006162.https://doi .org/10.1371/journal.pgen.1006162.
19. Devonshire AS, Whale AS, Gutteridge A, Jones G, Cowen S, Foy CA, Huggett JF. 2014. Towards standardisation of cell-free DNA measure-ment in plasma: controls for extraction efficiency, fragmeasure-ment size bias and quantification. Anal Bioanal Chem 406:6499 – 6512. https://doi.org/10 .1007/s00216-014-7835-3.
20. Fong SL, Zhang JT, Lim CK, Eu KW, Liu Y. 2009. Comparison of 7 methods for extracting cell-free DNA from serum samples of colorectal cancer patients. Clin Chem 55:587–589.https://doi.org/10.1373/clinchem.2008 .110122.
21. Stemmer C, Beau-Faller M, Pencreac’h E, Guerin E, Schneider A, Jaqmin D, Quoix E, Gaub MP, Oudet P. 2003. Use of magnetic beads for plasma cell-free DNA extraction: toward automation of plasma DNA analysis for molecular diagnostics. Clin Chem 49:1953–1955. https://doi.org/10 .1373/clinchem.2003.020750.
22. Perez-Barrios C, Nieto-Alcolado I, Torrente M, Jimenez-Sanchez C, Calvo V, Gutierrez-Sanz L, Palka M, Donoso-Navarro E, Provencio M, Romero A. 2016. Comparison of methods for circulating cell-free DNA isolation using blood from cancer patients: impact on biomarker testing. Transl Lung Cancer Res 5:665– 672.https://doi.org/10.21037/tlcr.2016.12.03. 23. Sorber L, Zwaenepoel K, Deschoolmeester V, Roeyen G, Lardon F, Rolfo
C, Pauwels P. 2017. A comparison of cell-free DNA isolation kits: isolation and quantification of cell-free DNA in plasma. J Mol Diagn 19:162–168.
https://doi.org/10.1016/j.jmoldx.2016.09.009.
24. Spindler KL, Pallisgaard N, Vogelius I, Jakobsen A. 2012. Quantitative cell-free DNA, KRAS, and BRAF mutations in plasma from patients with metastatic colorectal cancer during treatment with cetuximab and iri-notecan. Clin Cancer Res 18:1177–1185.https://doi.org/10.1158/1078 -0432.CCR-11-0564.
25. Wolf A, Beller K, Groemminger S, Hofmann W, Sachse M, Fassunke J. 2016. Purification of circulating cell-free DNA from plasma and urine using the automated large-volume extraction on the QIAsymphony(R) SP instrument. Adv Exp Med Biol 924:179 –185.https://doi.org/10.1007/ 978-3-319-42044-8_33.
26. Haselmann V, Ahmad-Nejad P, Geilenkeuser WJ, Duda A, Gabor M, Eichner R, Patton S, Neumaier M. 2018. Results of the first external quality assessment scheme (EQA) for isolation and analysis of circulating tumour DNA (ctDNA). Clin Chem Lab Med 56:220 –228.https://doi.org/ 10.1515/cclm-2017-0283.
on May 16, 2020 by guest
http://jcm.asm.org/
27. Volckmar AL, Sultmann H, Riediger A, Fioretos T, Schirmacher P, Endris V, Stenzinger A, Dietz S. 2018. A field guide for cancer diagnostics using cell-free DNA: from principles to practice and clinical applications. Genes Chromosomes Cancer 57:123–139.https://doi.org/10.1002/gcc.22517. 28. Chang Y, Tolani B, Nie X, Zhi X, Hu M, He B. 2017. Review of the clinical
applications and technological advances of circulating tumor DNA in cancer monitoring. Ther Clin Risk Manag 13:1363–1374.https://doi.org/ 10.2147/TCRM.S141991.
29. Volik S, Alcaide M, Morin RD, Collins C. 2016. Cell-free DNA (cfDNA): clinical significance and utility in cancer shaped by emerging technol-ogies. Mol Cancer Res 14:898 –908.https://doi.org/10.1158/1541-7786 .MCR-16-0044.
30. Stebbing J, Bower M. 2012. Cell-free DNA as a biomarker in the context of cancer, viruses, and methylation. J Infect Dis 205:1032–1034.https:// doi.org/10.1093/infdis/jis023.
31. Ng CKY, Di Costanzo GG, Terracciano LM, Piscuoglio S. 2018. Circulating cell-free DNA in hepatocellular carcinoma: current insights and outlook. Front Med (Lausanne) 5:78.https://doi.org/10.3389/fmed.2018.00078. 32. Santarpia M, Liguori A, D’Aveni A, Karachaliou N, Gonzalez-Cao M,
Daffina MG, Lazzari C, Altavilla G, Rosell R. 2018. Liquid biopsy for lung cancer early detection. J Thorac Dis 10:S882–SS97.https://doi.org/10 .21037/jtd.2018.03.81.
33. Fung SY, Lam JW, Chan KC. 2016. Clinical utility of circulating Epstein-Barr virus DNA analysis for the management of nasopharyngeal carci-noma. Chin Clin Oncol 5:18.https://doi.org/10.21037/cco.2016.03.07. 34. Shoda K, Ichikawa D, Fujita Y, Masuda K, Hiramoto H, Hamada J, Arita T,
Konishi H, Kosuga T, Komatsu S, Shiozaki A, Okamoto K, Imoto I, Otsuji E. 2017. Clinical utility of circulating cell-free Epstein-Barr virus DNA in patients with gastric cancer. Oncotarget 8:28796 –28804.
35. Chan KCA, Woo JKS, King A, Zee BCY, Lam WKJ, Chan SL, Chu SWI, Mak C, Tse IOL, Leung SYM, Chan G, Hui EP, Ma BBY, Chiu RWK, Leung SF, van Hasselt AC, Chan ATC, Lo YMD. 2017. Analysis of plasma Epstein-Barr virus DNA to screen for nasopharyngeal cancer. N Engl J Med 377: 513–522.https://doi.org/10.1056/NEJMoa1701717.
36. Kim KY, Le QT, Yom SS, Pinsky BA, Bratman SV, Ng RH, El Mubarak HS, Chan KC, Sander M, Conley BA. 2017. Current state of PCR-based Epstein-Barr virus DNA testing for nasopharyngeal cancer. J Natl Cancer Inst 109:djx007.https://doi.org/10.1093/jnci/djx007.
37. Kim KY, Le QT, Yom SS, Ng RHW, Chan KCA, Bratman SV, Welch JJ, Divi RL, Petryshyn RA, Conley BA. 2017. Clinical utility of Epstein-Barr virus DNA testing in the treatment of nasopharyngeal carcinoma patients. Int J Radiat Oncol Biol Phys 98:996 –1001.https://doi.org/10.1016/j.ijrobp .2017.03.018.
38. Liu TB, Zheng ZH, Pan J, Pan LL, Chen LH. 2017. Prognostic role of plasma Epstein-Barr virus DNA load for nasopharyngeal carcinoma: a meta-analysis. Clin Invest Med 40:E1–E12.
39. Vo JH, Nei WL, Hu M, Phyo WM, Wang F, Fong KW, Tan T, Soong YL, Cheah SL, Sommat K, Low H, Ling B, Ng J, Tan WL, Chan KS, Oon L, Ying JY, Tan MH. 2016. Comparison of circulating tumour cells and circulating cell-free Epstein-Barr virus DNA in patients with nasopharyngeal carci-noma undergoing radiotherapy. Sci Rep 6:13.https://doi.org/10.1038/ s41598-016-0006-3.
40. Boom R, Sol CJ, Schuurman T, Van Breda A, Weel JF, Beld M, Ten Berge IJ, Wertheim-Van Dillen PM, De Jong MD. 2002. Human cytomegalovirus DNA in plasma and serum specimens of renal transplant recipients is highly fragmented. J Clin Microbiol 40:4105– 4113. https://doi.org/10 .1128/JCM.40.11.4105-4113.2002.
41. Preiksaitis JK, Hayden RT, Tong Y, Pang XL, Fryer JF, Heath AB, Cook L, Petrich AK, Yu B, Caliendo AM. 2016. Are we there yet? Impact of the first international standard for cytomegalovirus DNA on the harmonization of results reported on plasma samples. Clin Infect Dis 63:583–589.
https://doi.org/10.1093/cid/ciw370.
42. Tong Y, Pang XL, Mabilangan C, Preiksaitis JK. 2017. Determination of the biological form of human cytomegalovirus DNA in the plasma of solid-organ transplant recipients. J Infect Dis 215:1094 –1101.https://doi .org/10.1093/infdis/jix069.
43. Ryan JL, Fan H, Swinnen LJ, Schichman SA, Raab-Traub N, Covington M, Elmore S, Gulley ML. 2004. Epstein-Barr virus (EBV) DNA in plasma is not encapsidated in patients with EBV-related malignancies. Diagn Mol Pathol 13:61– 68.https://doi.org/10.1097/00019606-200406000-00001. 44. Lei KI, Chan LY, Chan WY, Johnson PJ, Lo YM. 2000. Quantitative analysis
of circulating cell-free Epstein-Barr virus (EBV) DNA levels in patients with EBV-associated lymphoid malignancies. Br J Haematol 111: 239 –246.https://doi.org/10.1046/j.1365-2141.2000.02344.x.
45. Lei KI, Chan LY, Chan WY, Johnson PJ, Lo YM. 2001. Circulating cell-free Epstein-Barr virus DNA levels in patients with EBV-associated lymphoid malignancies. Ann N Y Acad Sci 945:80 – 83.
46. Lei KI, Chan LY, Chan WY, Johnson PJ, Lo YM. 2002. Diagnostic and prognostic implications of circulating cell-free Epstein-Barr virus DNA in natural killer/T-cell lymphoma. Clin Cancer Res 8:29 –34.
47. Lit LC, Chan KC, Leung SF, Lei KI, Chan LY, Chow KC, Chan AT, Lo YM. 2004. Distribution of cell-free and cell-associated Epstein-Barr virus (EBV) DNA in the blood of patients with nasopharyngeal carcinoma and EBV-associated lymphoma. Clin Chem 50:1842–1845.https://doi.org/10 .1373/clinchem.2004.036640.
48. Musacchio JG, Carvalho MDG, Morais JC, Silva NH, Scheliga A, Romano S, Spector N. 2006. Detection of free circulating Epstein-Barr virus DNA in plasma of patients with Hodgkin’s disease. Sao Paulo Med J 124: 154 –157.https://doi.org/10.1590/S1516-31802006000300009. 49. Au WY, Pang A, Choy C, Chim CS, Kwong YL. 2004. Quantification of
circulating Epstein-Barr virus (EBV) DNA in the diagnosis and monitoring of natural killer cell and EBV-positive lymphomas in immunocompetent pa-tients. Blood 104:243–249.https://doi.org/10.1182/blood-2003-12-4197. 50. Suwiwat S, Pradutkanchana J, Ishida T, Mitarnun W. 2007. Quantitative
analysis of cell-free Epstein-Barr virus DNA in the plasma of patients with peripheral T-cell and NK-cell lymphomas and peripheral T-cell prolifer-ative diseases. J Clin Virol 40:277–283.https://doi.org/10.1016/j.jcv.2007 .08.013.
51. Machado AS, Da Silva Robaina MC, Magalhães De Rezende LM, Apa AG, Amoêdo ND, Bacchi CE, Klumb CE. 2010. Circulating cell-free and Epstein-Barr virus DNA in pediatric B-non-Hodgkin lymphomas. Leuk Lymphoma 51:1020 –1027.https://doi.org/10.3109/10428191003746331.
52. Jones K, Nourse JP, Keane C, Crooks P, Gottlieb D, Ritchie DS, Gill D, Gandhi MK. 2012. Tumor-specific but not nonspecific cell-free circulating DNA can be used to monitor disease response in lymphoma. Am J Hematol 87:258 –265.https://doi.org/10.1002/ajh.22252.
53. Mussolin L, Burnelli R, Pillon M, Carraro E, Farruggia P, Todesco A, Mascarin M, Rosolen A. 2013. Plasma cell-free DNA in paediatric lym-phomas. J Cancer 4:323–329.https://doi.org/10.7150/jca.6226. 54. Welch JJG, Schwartz CL, Higman M, Chen L, Buxton A, Kanakry JA,
Kahwash SB, Hutchison RE, Friedman DL, Ambinder RF. 2017. Epstein-Barr virus DNA in serum as an early prognostic marker in children and adolescents with Hodgkin lymphoma. Blood Adv 1:681– 684.https://doi .org/10.1182/bloodadvances.2016002618.
55. Sinha M, Rao CR, Shafiulla M, Appaji L, Bs AK, Sumati BG, Avinash T, Jayshree RS. 2013. Cell-free Epstein-Barr viral loads in childhood Hodgkin lymphoma: a study from South India. Pediatr Hematol Oncol 30: 537–543.https://doi.org/10.3109/08880018.2013.796026.
56. Chesnais V, Ott A, Chaplais E, Gabillard S, Pallares D, Vauloup-Fellous C, Benachi A, Costa JM, Ginoux E. 2018. Using massively parallel shotgun sequencing of maternal plasmatic cell-free DNA for cytomegalovirus DNA detection during pregnancy: a proof of concept study. Sci Rep 8:4321.https://doi.org/10.1038/s41598-018-22414-6.
57. Shamay M, Hand N, Lemas MV, Koon HB, Krown SE, Wrangle J, Desai P, Ramos JC, Ambinder RF. 2012. CpG methylation as a tool to characterize cell-free Kaposi sarcoma herpesvirus DNA. J Infect Dis 205:1095–1099.
https://doi.org/10.1093/infdis/jis032.
58. Kuppachi S, Holanda D, Eberlein M, Alexiev B, Tyler AJ, Wissel MC, Kleiboeker SB, Thomas CP. 2017. An unexpected surge in plasma BKPyV viral load heralds the development of BKPyV-associated metastatic blad-der cancer in a lung transplant recipient with BKPyV nephropathy. Am J Transplant 17:813– 818.https://doi.org/10.1111/ajt.14057.
59. Kowarsky M, Camunas-Soler J, Kertesz M, De Vlaminck I, Koh W, Pan W, Martin L, Neff NF, Okamoto J, Wong RJ, Kharbanda S, El-Sayed Y, Blumenfeld Y, Stevenson DK, Shaw GM, Wolfe ND, Quake SR. 2017. Numerous uncharacterized and highly divergent microbes which colo-nize humans are revealed by circulating cell-free DNA. Proc Natl Acad Sci U S A 114:9623–9628.https://doi.org/10.1073/pnas.1707009114. 60. Chan KCA, Zhang J, Chan ATC, Lei KIK, Leung S-F, Chan LYS, Chow KCK,
Lo YMD. 2003. Molecular characterization of circulating EBV DNA in the plasma of nasopharyngeal carcinoma and lymphoma patients. Cancer Res 63:2028 –2032.