comment
reviews
reports
deposited research
interactions
information
refereed research
Research
Microarray profile of differentially expressed genes in a monkey
model of allergic asthma
Jun Zou*, Simon Young*, Feng Zhu*, Ferdous Gheyas
†
, Susan Skeans*,
Yuntao Wan*, Luquan Wang
‡
, Wei Ding
‡
, Motasim Billah*, Terri
McClanahan
§
, Robert L Coffman
§
, Robert Egan* and Shelby Umland*
Addresses: *Departments of Allergy, †Biostatistics, and ‡Bioinformatics, Schering-Plough Research Institute, 2015 Galloping Hill Rd, Kenilworth, NJ 07033, USA. §DNAX Research Institute, 901 California Ave, Palo Alto, CA 94304, USA.
Correspondence: Jun Zou. E-mail: [email protected]
Abstract
Background: Inhalation of Ascaris suum antigen by allergic monkeys causes an immediate bronchoconstriction and delayed allergic reaction, including a pulmonary inflammatory infiltrate. To identify genes involved in this process, the gene-expression pattern of allergic monkey lungs was profiled by microarrays. Monkeys were challenged by inhalation of A. suumantigen or given interleukin-4 (IL-4) treatment; lung tissue was collected at 4, 18 or 24 h after antigen challenge or 24 h after IL-4. Each challenged monkey lung was compared to a pool of normal, unchallenged monkey lungs.
Results:Of the approximately 40,000 cDNAs represented on the microarray, expression levels of 169 changed by more than 2.5-fold in at least one of the pairwise probe comparisons; these cDNAs encoded 149 genes, of which two thirds are known genes. The largest number of regulated genes was observed 4 h after challenge. Confirmation of differential expression in the original tissue was obtained for 95% of a set of these genes using real-time PCR. Cluster analysis revealed at least five groups of genes with unique expression patterns. One cluster contained genes for several chemokine mediators including eotaxin, PARC, MCP-1 and MCP-3. Genes involved in tissue remodeling and antioxidant responses were also identified as regulated by antigen and IL-4 or by antigen only.
Conclusion: This study provides a large-scale profile of gene expression in the primate lung following allergen or IL-4 challenge. It shows that microarrays, with real-time PCR, are a powerful tool for identifying and validating differentially expressed genes in a disease model.
Published: 11 April 2002
GenomeBiology2002, 3(5):research0020.1–0020.13
The electronic version of this article is the complete one and can be found online at http://genomebiology.com/2002/3/5/research/0020 © 2002 Zou et al., licensee BioMed Central Ltd
(Print ISSN 1465-6906; Online ISSN 1465-6914)
Received: 5 November 2001 Revised: 14 January 2002 Accepted: 5 March 2002
Background
Asthma is one of the most serious allergic diseases. Charac-teristic features of atopic asthma are circulating specific IgE antibodies, positive skin tests to common allergens, and infiltration of the bronchial mucosa with eosinophils and Th2 cells. The resulting pulmonary inflammation leads to
from the interaction of an unknown number of genes with environmental factors [3]. Studies of twins have shown that concordance rates for asthma are significantly higher in monozygotic twins than in dizygotic twins, and that the her-itability of asthma may be as high as 75% [4]. Linkage analysis of asthma within families has revealed that there are multiple chromosomal regions, containing potential candidate genes, associated with various asthma pheno-types [3,5,6].
Microarray technology offers a new opportunity to gain insight into global gene-expression profiles in asthma, leading to the identification of asthma-associated genes. Microarrays are a ‘gene-chip’-based technology in which cDNA sequences representing individual genes are spotted on glass slides at high density [7]. These sequences are then hybridized to cDNA probes derived from paired RNA samples of interest. The two sets of cDNA probes can be labeled with two different fluorescent dyes. The competitive hybridization of a fluorescently labeled probe pair to a microarray enables a comparison of the relative abundance of transcripts of that gene in each sample. In this way, microarrays can detect the differential expression levels of thousands of genes simultaneously.
Cluster analysis is often applied to the analysis of microarray data. In this method, statistical algorithms are used to arrange genes according to similarity in their pattern of expression [8]. The combination of microarray data and cluster analysis to make a genetic portrait of a disease has been used to characterize breast tumors [9], to categorize the subtype of diffuse large B-cell lymphoma [10], and to iden-tify genes whose expression is associated with mitotic mis-regulation and human aging [11].
The allergic cynomolgus monkey (Macaca fascicularis) has been used as a non-human primate model to study inflam-matory responses in the lung following allergen challenge [12,13]. This monkey has a natural hypersensitivity to the antigen of the nematode Ascaris suum. Inhalation of the
A. suum extract causes IgE-mediated immediate and delayed allergic reactions and an influx of inflammatory cells into the lung [14]. The resulting lung airway inflammation, eosinophilia and hypersensitive bronchoconstriction have similarities to the symptoms and processes seen in human asthma [1]. Therefore, examination of the gene-expression profile in this non-human primate model could provide useful insights into genes regulated in asthma and the mediators produced.
In the study reported here we investigated the differential gene-expression profile in the acute phase of allergic reac-tion to the Ascarisantigen in monkey lungs. As the cytokine IL-4 is an important inflammatory mediator in asthma [2], an IL-4-challenged monkey lung was also included in this study.
Results and discussion
Experimental design
DNA microarrays were used to identify the gene expression pattern induced in the lung of allergic monkeys by inhalation of A. suum extract. Six control animals and four experimen-tal animals were used for microarray hybridization experi-ments. Because of initial limitations on the availability of allergic monkeys, a strategy was used whereby microarray studies were conducted using a single animal at each of three different time points: 4, 18 and 24 h after challenge by inhalation of A. suum extract. The selection of time points is based on our previous study of Ascaris-challenged monkeys [14]. Following the identification of regulated genes, a second method - quantitative reverse transcription poly-merase chain reaction (RT-PCR) using TaqmanTM- was used
to establish that selected, regulated genes detected by microarray could be confirmed in the same sample by RT-PCR, to compare the magnitude of regulation determined by microarray and RT-PCR and to verify the validity of selected regulated genes by examining the gene expression levels in lung RNA from multiple, individual control and challenged monkeys. Lastly, because IL-4 is implicated as an important inflammatory mediator in asthma [2], one monkey was treated with recombinant human IL-4 by inhalation and lung RNA isolated 24 h later. In summary, a total of four experimental monkey lung tissue samples were used for microarray hybridization (4, 18 and 24 h after allergen chal-lenge, or 24 h after IL-4 challenge). The gene-expression levels in each of these samples were compared to those of an RNA pool prepared from equivalent amounts of lung RNA from each of six normal control monkeys.
Approximately 40,000 cDNA elements on the microarrays were hybridized with the four probe pairs to examine differen-tial gene expression. Genes were chosen for further study by being up- or down-regulated by at least 2.5-fold compared to controls in at least one of the four probe pairs. The selection of these genes was empirical. The use of a higher criterion (that is, threefold) excluded some genes, such as those for MCP-1 and ICAM-1, which are known to be regulated in the acute phase of allergen challenge [15,16]; on the other hand, a lower criterion, such as twofold, increased the probability of false-positive genes and lack of confirmation by RT-PCR (see Vali-dation of the microarray gene expression, below).
comment
reviews
reports
deposited research
interactions
information
refereed research
number of genes induced by the allergen may be higher. In comparison, a large-scale gene-expression study of a complex tissue - breast tumors - demonstrated that 22% of the total genes examined were regulated by at least fourfold in at least three of the 84 probe pairs tested [9].
Lastly, the interspecies hybridization using monkey cDNA to probe human cDNA arrays could also contribute to the low number of regulated genes identified. The sequence homol-ogy between monkey and human genes is quite high, however. For example, our analysis of all available cDNA sequences of cynomolgus monkey for 139 known genes shows that the average percentage identity between monkey and human cDNA is about 95%, ranging from 88 to 99%. Only five sequences (3.5%) have identity less than 90%. A study of the sensitivity and specificity of oligonucleotide (50mer) microarray demonstrated that sequences with greater than 75-80% identity will cross-hybridize and con-tribute to the overall signal intensity [17]. When we use RT-PCR to validate microarray results, most of the primers and probes in RT-PCR are designed on the basis of human sequences, which in fact works well on monkey cDNAs. Therefore, most of genes on the human cDNA array should have been detected by monkey cDNA probes in this study.
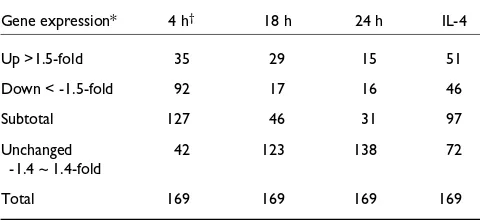
A total of 149 genes were represented by the 169 cDNA ele-ments identified as regulated in this study. Of the 149 genes, 52 were novel and 97 were known genes. Table 1 provides a summary of the numbers of differentially expressed cDNA elements in each of the four probe pairs. At 4 h after chal-lenge, the highest number of downregulated cDNA elements (92) was observed, while the highest number of upregulated cDNA elements (51) was seen in the IL-4-challenged monkey. The largest number of differentially expressed cDNA elements (127) was seen 4 h after the allergen chal-lenge, with fewer observed at 18 h (46 cDNA elements) or 24 h after challenge (31 cDNA elements). Interestingly, the second highest number of regulated genes (97) occurred in the IL-4-challenged monkey at 24 h. While definitive conclu-sions are precluded by the fact that each time point or condi-tion is represented by only a single probe pair, it is noteworthy that the highest number of regulated genes was observed early (4 h) after challenge.
Cluster analysis of microarray data
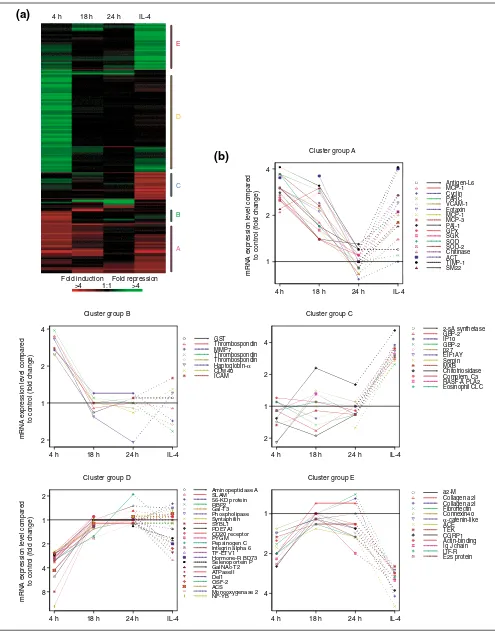
A statistical cluster program was used to analyze the 169 cDNA elements identified as regulated by more than 2.5-fold in one or more probe pairs. Of the 169 cDNA elements, 161 met with the minimal requirements of the cluster program (see Materials and methods) and were subjected to hierar-chical cluster analysis. This methodology [8] has been used by others to define the gene-expression profile of breast tumors [9], to subtype diffuse large B-cell lymphomas [10] and to identify genes whose expression is associated with mitotic misregulation and human aging [11]. Figure 1a illus-trates the cluster-analysis results. All the genes with a
similar spatial and temporal expression pattern were clus-tered together on the basis of their similarity scores. To visu-alize the temporal expression pattern of the clusters, the gene-expression levels are displayed for a majority of genes with known functions (Figure 1b).
One of the clusters that displayed the largest number of the upregulated genes is cluster A. The genes in this cluster demonstrated a similar temporal gene-expression pattern (Figure 1b). Four hours after allergen challenge, genes in this cluster were increased by two- to fourfold of the level observed in normal controls. The elevated gene expression observed at 4 h after challenge was decreased by 18 h post-challenge and was generally near baseline levels 24 h after the challenge. Most of the genes in this cluster were also upregulated by IL-4. Cluster A is dominated by genes for chemokines and adhesion molecules, which are known to be involved in inflammatory responses.
More specifically, MCP-1 [2,16], MCP-3 [2,18], eotaxin [16,18], pulmonary and activation-related chemokine (PARC) [19], and vascular cell adhesion molecule 1 (VCAM-1) [15] have been identified as mediators of pulmonary inflamma-tion in asthma or relevant animal models. Many of the genes in cluster A derived from the IL-4-treated monkey were gen-erally increased above the control level. Importantly, several of these genes - those for eotaxin [20], VCAM-1 [21], MCP-1 [22] and MCP-3 [20] - were previously known to be inducible by IL-4 in cells relevant to pulmonary inflamma-tion, and this regulation is corroborated here in vivoin the pulmonary tissue of a non-human primate.
The gene expression pattern of cluster B resembled that of cluster A. One of the main differences between cluster A and cluster B is that most of genes in cluster B were mini-mally regulated by IL-4. As for cluster A, the expression of the genes in cluster B was also two- to fourfold higher at 4 h after challenge compared to control. However, the elevated gene expression was at baseline levels 18 h after challenge. Due to the low number of known genes identified by these microarray studies (149) and the few genes contained within the clusters, such as cluster B, specifying the bio-chemical pathway(s) defined by each cluster is difficult; however, several genes of note are included in this cluster. In contrast to the three antioxidant genes in cluster A, which are inducible by IL-4, the gene for glutathione-S -transferase (GST), a member of cluster B, is not regulated by IL-4. Additional genes involved in remodeling are con-tained within cluster B, such as those for MMP-7 (also known as matrilysin [31]), thrombospondin [32] and hapto-globin-alpha. Haptoglobin-alpha is highly expressed in alveolar macrophages and eosinophils in inflamed human lung tissues [33]. Lastly, the intercellular adhesion mole-cule, ICAM-1, a cluster B gene, was previously found to be increased on inflamed airway epithelium in a primate model of pulmonary inflammation [34].
It should be noted that genes for cytokines such as IL-4, IL-5, IL-9 and IL-13, which are known to be involved in allergic
pulmonary inflammation [2] and would be expected to be observed in cluster A or B, were not identified because their cDNA sequences were not present on the microarrays used.
In contrast to clusters A and B, the genes in cluster D were downregulated in response to the allergen challenge (Figure 1b). The level of expression of genes in this cluster was decreased between 2.5-fold and 12-fold 4 h after chal-lenge compared to the control pool, with minimal changes observed 18 h after challenge. The largest changes in gene-expression levels were observed in this cluster: the genes for CCAAT-binding transcription factor-B (NF-YB) (12-fold), SYBL1 (8-fold) and aminopeptidase A (5-fold). IL-4 treat-ment had a minimal effect on the genes in this cluster. They do not clearly define any one cellular pathway, but rather multiple processes. One gene in particular is interesting -SLAM, signaling lymphocytic activation molecule. In vitro
studies in polarized human Th1 and Th2 CD4+T-cell subsets
indicate that higher levels of SLAM are observed in Th1 cells [35]. The downregulation of SLAM gene expression observed here after allergen challenge, which induces a Th2 response, is consistent with this earlier observation. In addi-tion, levels of soluble SLAM in serum were found to be lower in patients with elevated IgE than in normal controls, and low production of SLAM was associated with a Th2 response
in vivo [36].
[image:4.609.55.295.128.238.2]Clusters C and E are composed of genes that are regulated 24 h after IL-4 inhalation but not significantly regulated by the antigen challenge, even at a similar time point. The clus-ters differ in that the genes in cluster C were upregulated and genes in cluster E were downregulated by IL-4. Three genes are noteworthy. The genes for complement C3 and IP-10 (IFN-induced protein of IP-10 kDa), a non-ELR CXC chemokine, were among the genes upregulated by IL-4 in the monkey lung. In support of the microarray findings, IL-4 is known to increase C3 mRNA levels and subsequent protein production in A549 cells, a pulmonary epithelial cell line [37]. In addition, IP-10mRNA, which is induced in a variety of cell types by interferon-J(IFN-J), is augmented by IL-4 in bone marrow stromal cells [38] and keratinocytes [39] but not in respiratory epithelial primary cells or cell lines [40]. The upregulation of IP-10mRNA observed here in monkeys challenged by IL-4 inhalation warrants further Table 1
cDNA elements differentially expressed in challenged monkey lungs
Gene expression* 4 h† 18 h 24 h IL-4
Up >1.5-fold 35 29 15 51
Down < -1.5-fold 92 17 16 46
Subtotal 127 46 31 97
Unchanged 42 123 138 72
-1.4 ~ 1.4-fold
Total 169 169 169 169
*In the challenged lungs versus the pool of normal, control lungs. †Hours after A. suumchallenge or 24 h post IL-4 challenge.
Figure 1 (see figure on the next page)
comment
reviews
reports
deposited research
interactions
information
[image:5.609.58.553.85.718.2]refereed research
Figure 1(see legend on the previous page)
Cluster group B
4 h 18 h 24 h IL-4
2 1 2 4
GST Thrombospondin MMP7 Thrombospondin Thrombospondin Haptoglobin-α CDw40 ICAM
Cluster group C
4 h 18 h 24 h IL-4
2 1 2 4
2-5A synthetase GBP-2 IP10 GBP-2 p27 EIF1AY Serpin MXB Chitotriosidase Complem. C3 RASF-A PLA2 Eosinophil CLC
Cluster group D
4 h 18 h 24 h IL-4
8 4 2 1 2
Aminopeptidase A SLAM 56-KD protein RBP2 Gal-T3 Phospholipase Syntaphilin SYBL1 PDE7A1 CD20 receptor PYGM Pepsinogen C Integrin alpha 6 TF-ETV1 Hormone-R BD73 Selenoportein P GalNAc-T2 ATPaseII Del1 OSF-2 ACS
Monooxygenase 2 NF-YB
Cluster group E
4 h 18 h 24 h IL-4
4 2 1
a2-M Collagen a2I Collagen a2I Fibronectin Connexin40 α-catenin-like ACE TEK CGRP1 Actin-binding Ig J chain LIF-R E25 protein Cluster group A
4 h 18 h 24 h IL-4
1 2 4
Antigen-L6 MCP-1 Cyclin PARC VCAM-1 Eotaxin MCP-1 MCP-3 PAI-1 GPx SGK SOD SOD-2 Chitinase ACT TIMP-1 SM22
mRNA e
xpression le
v
el compared
to control (f
old change)
mRNA e
xpression le
v
el compared
to control (f
old change)
mRNA e
xpression le
v
el compared
to control (f
old change)
4 h 18 h 24 h IL-4
A
B C
D E
Fold repression Fold induction
1:1 >4 >4
(a)
investigation to determine the cell type and mechanism of IL-4 regulation of IP-10 in vivo. Lastly, the cyclin-dependent kinase inhibitor p27 was upregulated by IL-4 in the monkey lung. The p27 protein is a negative regulator of cytokine-stimulated T-cell growth [41] as revealed in p27-deficient mice. The upregulation of p27mRNA by IL-4, identified by microarray studies, suggests that p27 is an IL-4-inducible gene. Further studies of IL-4-mediated regulation of this and other genes in cluster A, such as those for PAI-1 and TIMP-1, and in cluster E, such as angiotensin I-converting enzyme (ACE), tyrosine kinase receptor (TEK), and leukemia inhibitory factor receptor (LIF-R), are warranted on the basis of the microarray results presented here.
Validation of microarray gene-expression data
The quality of the microarray data was estimated by examin-ing a small subset of the cDNA elements that was present in duplicate or triplicate on the microarrays. Each of these repli-cate cDNA elements on the microarray encodes a different region of the same gene. Therefore, where possible, the simi-larity of the expression levels of the replicate cDNA elements representing a given gene was examined. For example, among 149 genes encoded by the 169 cDNA elements, nine genes were represented by two cDNA elements and two genes by three cDNA elements. For seven of these eleven genes, their multiple cDNA elements were located on the different microarrays in the total set of six microarrays used. Impres-sively, the microarray readings between these duplicate or triplicate cDNA elements were similar to each other, such that the standard deviations were in general less than 30% of the mean expression value for the 4-, 18-, 24-h and IL-4-challenged groups. Furthermore, all the replicate cDNA ele-ments that encoded the same gene were grouped into the same cluster and were generally in the adjacent rows in the cluster (data not shown), indicating that the replicate cDNAs on microarray produce very similar hybridization results.
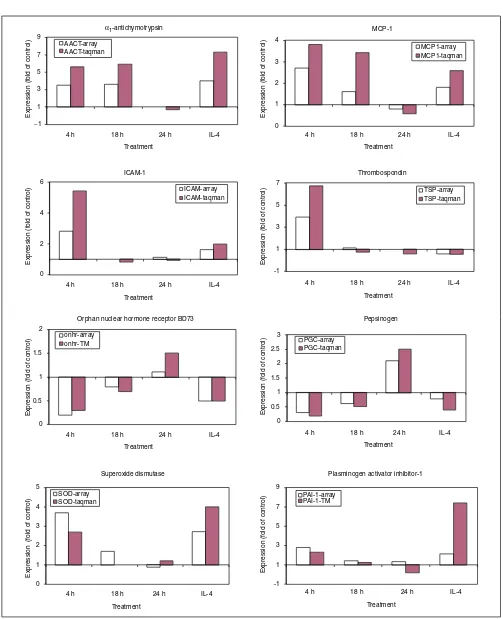
Verification of differential gene expression in the lungs of challenged monkeys was examined on a small set of known genes. First, the accuracy of microarray technology was tested using quantitative real-time RT-PCR (Taqman). The gene-expression levels obtained by RT-PCR were normalized to that of gene for the enzyme hypoxanthine-guanine phos-phoribosyl transferase (HPRT) and expressed as the fold increase or decrease relative to that of the normal control pool. Twenty known genes were chosen from among the five clusters for this analysis; the majority were selected from cluster A, which contained the largest number of the most highly upregulated genes. Microarray gene-expression levels were compared to those obtained by RT-PCR, using the same monkey lung samples used in the microarray hybridization. Figure 2 displays the results of 8 of 20 genes tested for confirmation and these are among the 10 genes that were significantly regulated (p < 0.05) when subse-quently tested by RT-PCR on multiple 4-h-challenged monkeys (see below). The pattern of gene expression (up- or
down-regulation) was similar for the genes when the two methods of measurement were compared. The differences between these two methods become prominent at lower levels of expression. Importantly, the direction and degree of differential expression of 19 of 20 genes initially identified by microarray were confirmed by quantitative RT-PCR (Figure 2, Table 2).
Table 3 summarizes the ratio of expression levels derived from the two methods for 20 genes (listed in Table 2). Among 80 pairs of results compared, 55% of data pairs are almost identical (ratio of microarray to RT-PCR, or vice versa, is 1-1.4-fold expression relative to normal control). In the remaining 45% of the data pairs, which differed by 1.5-fold or more between the two methods, 35% of the paired comparisons were higher by RT-PCR than by microarray, whereas only 10% were higher by microarray than by quanti-tative PCR. This suggests a smaller dynamic range for microarray technology compared to that of RT-PCR.
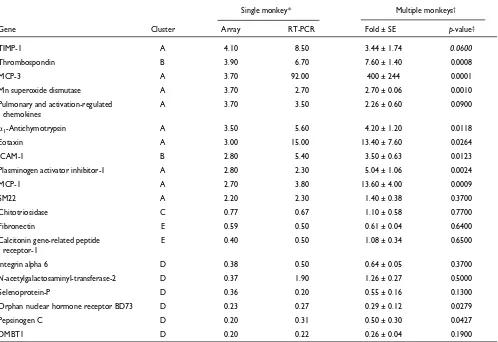
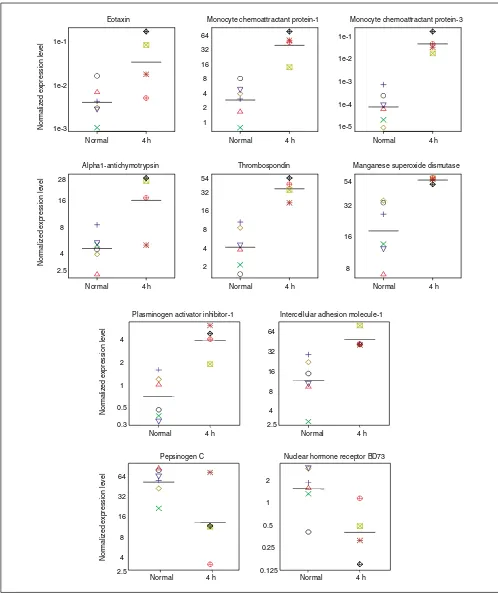
For the second level of validation, we sought to establish that genes identified by microarray technology represented genes truly regulated by inhalation antigen challenge. This was done by determining that the regulated expression levels identified by microarray technology from a single animal could be confirmed by RT-PCR using multiple similarly treated animals. The timepoint chosen for these studies was 4 h after challenge, the timepoint representing the largest number of regulated genes (Table 1). Twenty genes were tested by quantitative RT-PCR in each of four challenged animals (each was 4 h after challenge, of which one was the original monkey) as well as in the six individual, normal unchallenged monkey lungs, which previously constituted the normal control pool. Representative genes are shown in Figure 3 and all 20 genes are summarized in Table 2. Ten of the 20 genes showed significant differences (p< 0.05) between the challenged and normal control lungs (Table 2); 8 of these 10 genes were initially identified by microarray as being expressed t2.7-fold above control. Thus the genes most highly induced in multiple monkeys 4 h after allergen challenge were those for: MCP-3 (400-fold), MCP-1 (14-fold), eotaxin (13-fold), thrombospondin (8-fold), PAI-1 (5-fold), and alpha1-antichymotrypsin (4-fold). The
comment
reviews
reports
deposited research
interactions
information
[image:7.609.54.557.72.691.2]refereed research
Figure 2
Comparison of gene-expression level by microarray and RT-PCR (Taqman). The genes displayed and the cluster they belong to are as follows: cluster A: alpha1-antichymotrypsin, MCP-1, superoxide dismutase, plasminogen activator inhibitor-1; cluster B: ICAM-1, thrombospondin; cluster D: orphan nuclear hormone receptor BD73, pepsinogen C. The expression levels are displayed as the fold of the control unchallenged level, which is set to a value of one.
α1-antichymotrypsin
−1 1 3 5 7 9
4 h 18 h 24 h IL-4
Treatment
4 h 18 h 24 h IL-4
Treatment
4 h 18 h 24 h IL-4
Treatment
4 h 18 h 24 h IL-4
Treatment
4 h 18 h 24 h IL-4
Treatment
4 h 18 h 24 h IL-4
Treatment
4 h 18 h 24 h IL-4
Treatment
4 h 18 h 24 h IL-4
Treatment
Expression (f
old of control)
Expression (f
old of control)
Expression (f
old of control)
Expression (f
old of control)
Expression (f
old of control)
Expression (f
old of control)
Expression (f
old of control)
AACT-array AACT-taqman
MCP-1
0 1 2 3 4
MCP1-array MCP1-taqman
ICAM-1
0 2 4 6
ICAM-array ICAM-taqman
Thrombospondin
-1 1 3 5 7
TSP-array TSP-taqman
Orphan nuclear hormone receptor BD73
0 0.5 1 1.5 2
onhr-array onhr-TM
Pepsinogen
0 0.5 1 1.5 2 2.5 3
PGC-array PGC-taqman
0 1 2 3 4 5
Expression (f
old of control)
SOD-array SOD-taqman
Plasminogen activator inhibitor-1 Superoxide dismutase
-1 1 3 5 7 9
were not found to be significantly regulated when tested in multiple 4-h antigen-challenged monkeys, as the expression signal driving the grouping of genes in cluster E originated from IL-4, as opposed to antigen challenge.
In summary, the validation tests, though limited in scope, indicate that differential expression by microarray is highly predictive (> 80% confirmation) of differential expression determined by RT-PCR. This suggests a strategy whereby with the use of a confirmatory RT-PCR step, even in the absence of replicate initial tissues and microarrays, microar-ray experiments can be used as a high-throughput screen to identify genes regulated in a complex in vivodisease model.
[image:8.609.57.555.118.460.2]It is important to note, however, that no animal disease model is identical to human disease. Although there have been many efforts to develop animal models that approxi-mate human asthma or allergy, each of the models has its own advantages and limitations. In this study, the cynomol-gus monkey, which has a naturally occurring respiratory Table 2
Validation of microarray expression levels by RT-PCR in multiple 4-h challenged monkeys
Single monkey* Multiple monkeys†
Gene Cluster Array RT-PCR Fold ± SE p-value‡
TIMP-1 A 4.10 8.50 3.44 ± 1.74 0.0600
Thrombospondin B 3.90 6.70 7.60 ± 1.40 0.0008
MCP-3 A 3.70 92.00 400 ± 244 0.0001
Mn superoxide dismutase A 3.70 2.70 2.70 ± 0.06 0.0010
Pulmonary and activation-regulated A 3.70 3.50 2.26 ± 0.60 0.0900
chemokines
D1-Antichymotrypsin A 3.50 5.60 4.20 ± 1.20 0.0118
Eotaxin A 3.00 15.00 13.40 ± 7.60 0.0264
ICAM-1 B 2.80 5.40 3.50 ± 0.63 0.0123
Plasminogen activator inhibitor-1 A 2.80 2.30 5.04 ± 1.06 0.0024
MCP-1 A 2.70 3.80 13.60 ± 4.00 0.0009
SM22 A 2.20 2.30 1.40 ± 0.38 0.3700
Chitotriosidase C 0.77 0.67 1.10 ± 0.58 0.7700
Fibronectin E 0.59 0.50 0.61 ± 0.04 0.6400
Calcitonin gene-related peptide E 0.40 0.50 1.08 ± 0.34 0.6500
receptor-1
Integrin alpha 6 D 0.38 0.50 0.64 ± 0.05 0.3700
N-acetylgalactosaminyl-transferase-2 D 0.37 1.90 1.26 ± 0.27 0.5000
Selenoprotein-P D 0.36 0.20 0.55 ± 0.16 0.1300
Orphan nuclear hormone receptor BD73 D 0.23 0.27 0.29 ± 0.12 0.0279
Pepsinogen C D 0.20 0.31 0.50 ± 0.30 0.0427
DMBT1 D 0.20 0.22 0.26 ± 0.04 0.1900
*Fold expression level determined by microarray or RT-PCR in original 4-h challenged monkey. †Mean fold expression (± SE) determined by RT-PCR in 4-h challenged monkeys (n= 4) compared to normal, control monkey (n= 6). ‡p-values were determined by t-test (unpaired).
Table 3
Comparison of microarray versus RT-PCR
Ratio* Pairs† Percentage‡
Microarray:Taqman 1:1 44 55
1.5:1 4 5
2:1 3 4
> 3:1 1 1
1:1.5 12 15
1:2 6 8
> 1:3 10 12
Total 80 100
[image:8.609.54.298.530.684.2]comment
reviews
reports
deposited research
interactions
information
[image:9.609.55.553.85.678.2]refereed research
Figure 3
Gene-expression levels in multiple individual monkey lungs determined by RT-PCR. Expression levels in control unchallenged monkeys (normal, n= 6) and 4-h post-challenge monkey lungs (4 h, n= 4) are shown. Genes shown are those that are significantly different between these two groups (p< 0.1, unpaired t-test, Table 2). Expression levels in each animal were calculated as described in Materials and methods and normalized to HPRT, and are on a log scale. The 4-h challenged monkey used in the microarray analysis is designated by the green boxed cross (_).
Eotaxin
Normal 4 h
Normal 4 h Normal 4 h Normal 4 h
Normal 4 h
Normal 4 h
Normal 4 h Normal 4 h
Normal 4 h Normal 4 h
1e-3 1e-2 1e-1
Monocyte chemoattractant protein-1
1 2 4 8 16 32 64
Monocyte chemoattractant protein-3
1e-5 1e-4 1e-3 1e-2 1e-1
Alpha1-antichymotrypsin
2.5 4 8 16 28
Thrombospondin
2 4 8 16 32 54
Manganese superoxide dismutase
8 16 32 54
Nor
maliz
ed e
xpression le
v
el
Nor
maliz
ed e
xpression le
v
el
Nor
maliz
ed e
xpression le
v
el
Nor
maliz
ed e
xpression le
v
el
Plasminogen activator inhibitor-1
0.3 0.5 1 2 4
Intercellular adhesion molecule-1
2.5 4 8 16 32 64
Pepsinogen C
2.5 4 8 16 32 64
Nuclear hormone receptor BD73
0.125 0.25
hypersensitivity to A. suumextract, was used. Inhalation of the antigen results in an IgE-mediated bronchoconstriction and inflammatory response in monkey lung characterized by an influx of eosinophils [14]. This model was used to investigate the mechanisms underlying the acute inflamma-tory response and hypersensitivity reaction in monkey airways. Thus, the gene-expression profile in this non-human primate model could provide useful insights into genes regulated in asthma and the mediators produced, although there is no evidence that the antigen used in this study would produce the same allergic reaction in humans. The gene-expression profiles of monkey lung are also limited to the airway responses within 4-24 h after antigen challenge, which may not be relevant to the asthmatic lung or reflect the chronic aspect of asthma. Nevertheless, this is the first attempt to produce an allergen-induced gene-expression profile in the lung of a non-human primate using genomic tools such as microarray and RT-PCR.
Conclusion
This study provides a novel large-scale profile of gene expression in the lung in allergen-induced pulmonary inflammation in non-human primates. Not only are many novel genes differentially expressed in this disease model identified by microarray, but also many known genes which include many previously observed as regulated in asthma (for example those for eotaxin and VCAM-1) or regulated by relevant stimuli, such as IL-4, in cellular systems (for example, VCAM-1, C3). The results show that microarray analysis in combination with quantitative real-time PCR is a powerful tool for identifying mediators of allergic asthmatic disease through a genomic-based strategy using non-human primates.
Materials and methods
The experiments were carried out on mature male cynomol-gus monkeys. Animals were housed in accordance with National Institutes of Health guidelines at the Schering-Plough Research Institute, a facility approved by the Ameri-can Association for Accreditation of Laboratory Animal Care. The experimental protocols were approved by the Animal Care and Use Committee of the Schering-Plough Research Institute. A total of 13 monkeys were used in this study (microarray and Taqman), and were divided into the following groups: (1) six untreated control animals, referred to as normal controls; (2) one animal challenged by inhala-tion with recombinant human IL-4 (see below); (3) six animals challenged with A. suumextract by inhalation (see below). Lung tissue was collected 4 h (four animals), 18 h (one animal) or 24 h (one animal) after inhalation chal-lenge. Inhalation of A. suumextract in these animals pro-duced a typical IgE-mediated hypersensitivity reaction, with mast-cell degranulation and bronchoconstriction [34].
Normal control animals
The animals were lightly anesthetized with 10 mg/kg intra-muscular ketamine (Ketaject; Phoenix Pharmaceuticals, St Joseph, MO) and euthanized with an overdose of intra-venous pentobarbital (Euthanasia-V; Henry Schein, Port Washington, NY). Lung tissue was collected, snap frozen in liquid nitrogen and maintained at -80°C pending analysis.
IL-4 treatment
The monkey was lightly anesthetized with 10 mg/kg intra-muscular ketamine and anesthesia was maintained with intravenous propofol (Diprivan; Zeneca Pharmaceuticals, Wilmington, DE). A fiber-optic bronchoscope (BF type 3C20; Olympus America, Melville, NY) was passed into the right mainstem bronchus. A thin polyethylene catheter was advanced through the biopsy channel of the bronchoscope until the tip was clear of the bronchoscope. Recombinant human IL-4 (0.5 mg; Schering-Plough, Kenilworth, NJ) was dissolved in 1 ml PBS and injected into the bronchus through the catheter. The procedure was repeated on the left side of the lung and the monkey was allowed to recover from anes-thesia. After 24 h, the monkey was re-anesthetized with intramuscular ketamine and euthanized with an overdose of intravenous pentobarbital. Lung tissue was collected and frozen as described above.
Pulmonary antigen challenge of monkeys with
A. suumextract
The monkeys were anesthetized with ketamine and propofol as before. The trachea was intubated and the animals venti-lated with 100% oxygen. Respiratory airflow and transpul-monary pressure were measured and pultranspul-monary resistance and compliance were calculated online (Model 6; Buxco Elec-tronics, Sharon, CT) from the pressure and flow signals using the isovolume technique [42]. The animals were then chal-lenged with 15 breaths of ultrasonically nebulized (Ultra-Neb 99; DeVilbiss, Somerset, PA) A. suumextract (Greer Labora-tories, Lenoir, NC) diluted in saline. The dilution used was titrated for each animal to produce at least a 100% increase in pulmonary resistance. Animals in the 4 h group were kept anesthetized with an intravenous infusion of either propofol or pentobarbital (Nembutal sodium; Abbott Laboratories, North Chicago, IL) for 4 h. During this time they were venti-lated with air, body temperature was maintained with a heated blanket and physiological parameters (blood pressure, heart rate, arterial oxygen saturation) were monitored. At the end of the 4 h time period the animals were euthanized with an overdose of intravenous pentobarbital and lung tissue col-lected. The two animals designated for 18 h or 24 h
post-A. suum challenge were recovered from anesthesia after the antigen challenge. They were re-anesthetized with intramus-cular ketamine either 18 or 24 h later and euthanized.
comment reviews
reports deposited research
interactions
information refereed research
http://genomebiology.com/2002/3/5/research/0020.11
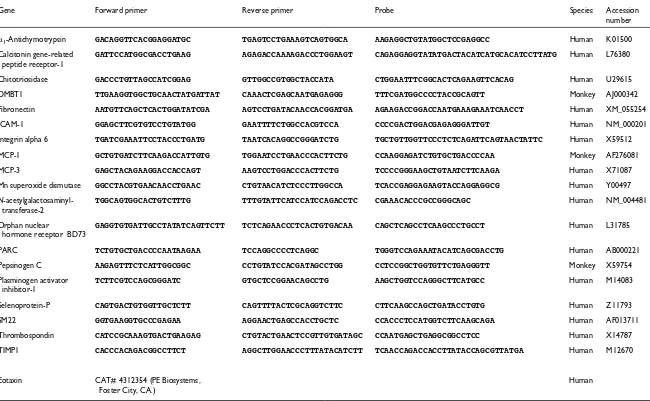
Gene Forward primer Reverse primer Probe Species Accession
number
D1-Antichymotrypsin GACAGGTTCACGGAGGATGC TGAGTCCTGAAAGTCAGTGGCA AAGAGGCTGTATGGCTCCGAGGCC Human K01500 Calcitonin gene-related GATTCCATGGCGACCTGAAG AGAGACCAAAAGACCCTGGAAGT CAGAGGAGGTATATGACTACATCATGCACATCCTTATG Human L76380
peptide receptor-1
Chitotriosidase GACCCTGTTAGCCATCGGAG GTTGGCCGTGGCTACCATA CTGGAATTTCGGCACTCAGAAGTTCACAG Human U29615
DMBT1 TTGAAGGTGGCTGCAACTATGATTAT CAAACTCGAGCAATGAGAGGG TTTCGATGGCCCCTACCGCAGTT Monkey AJ000342
Fibronectin AATGTTCAGCTCACTGGATATCGA AGTCCTGATACAACCACGGATGA AGAAGACCGGACCAATGAAAGAAATCAACCT Human XM_055254
ICAM-1 GGAGCTTCGTGTCCTGTATGG GAATTTTCTGGCCACGTCCA CCCCGACTGGACGAGAGGGATTGT Human NM_000201
Integrin alpha 6 TGATCGAAATTCCTACCCTGATG TAATCACAGGCCGGGATCTG TGCTGTTGGTTCCCTCTCAGATTCAGTAACTATTC Human X59512
MCP-1 GCTGTGATCTTCAAGACCATTGTG TGGAATCCTGAACCCACTTCTG CCAAGGAGATCTGTGCTGACCCCAA Monkey AF276081
MCP-3 GAGCTACAGAAGGACCACCAGT AAGTCCTGGACCCACTTCTG TCCCCGGGAAGCTGTAATCTTCAAGA Human X71087
Mn superoxide dismutase GGCCTACGTGAACAACCTGAAC CTGTAACATCTCCCTTGGCCA TCACCGAGGAGAAGTACCAGGAGGCG Human Y00497
N-acetylgalactosaminyl- TGGCAGTGGCACTGTCTTTG TTTGTATTCATCCATCCAGACCTC CGAAACACCCGCCGGGCAGC Human NM_004481 transferase-2
Orphan nuclear GAGGTGTGATTGCCTATATCAGTTCTT TCTCAGAACCCTCACTGTGACAA CAGCTCAGCCTCAAGCCCTGCCT Human L31785 hormone receptor BD73
PARC TCTGTGCTGACCCCAATAAGAA TCCAGGCCCCTCAGGC TGGGTCCAGAAATACATCAGCGACCTG Human AB000221
Pepsinogen C AAGAGTTTCTCATTGGCGGC CCTGTATCCACGATAGCCTGG CCTCCGGCTGGTGTTCTGAGGGTT Monkey X59754
Plasminogen activator TCTTCGTCCAGCGGGATC GTGCTCCGGAACAGCCTG AAGCTGGTCCAGGGCTTCATGCC Human M14083 inhibitor-1
Selenoprotein-P CAGTGACTGTGGTTGCTCTT CAGTTTTACTCGCAGGTCTTC CTTCAAGCCAGCTGATACCTGTG Human Z11793
SM22 GGTGAAGGTGCCCGAGAA AGGAACTGAGCCACCTGCTC CCACCCTCCATGGTCTTCAAGCAGA Human AF013711
Thrombospondin CATCCGCAAAGTGACTGAAGAG CTGTACTGAACTCCGTTGTGATAGC CCAATGAGCTGAGGCGGCCTCC Human X14787
TIMP1 CACCCACAGACGGCCTTCT AGGCTTGGAACCCTTTATACATCTT TCAACCAGACCACCTTATACCAGCGTTATGA Human M12670
Eotaxin CAT#: 4312354 (PE Biosystems, Human
[image:11.793.54.704.85.486.2]total RNA was isolated from lung tissue by standard guani-dinium isothiocyanate/cesium chloride gradients [43]. For each probe pair, poly(A) mRNA was isolated from approxi-mately 200 Pg of total RNA using oligotex beads (Qiagen, Chatsworth, CA). Labeled cDNA was prepared by reverse transcription with fluorescent dyes: Cy3 for probe 1 (normal controls) and Cy5 for probe 2 (treated animals). The labeled probe pairs were used for microarray hybridization to Gene Album Arrays 1-6, containing more than 40,000 human cDNA elements (Incyte Genomics, Palo Alto, CA) as described ([44] and Incyte, unpublished data). The specifi-cally bound probes on the microarray were scanned for the two individual fluorescent colors and the signals were cor-rected for the differences between the Cy3 and Cy5 channels: each probe 2 (Cy5) signal value was multiplied by a balance coefficient in order to normalize the gene-expression data relative to probe 1 (Cy3). The coefficient equals the sum of probe 1 signals divided by the sum of probe 2 signals for the entire microarray chip. The ratio of the two normalized probe signals provided a quantitative measurement of the relative gene-expression level for the challenged lungs com-pared to the normal controls.
Cluster analysis
Cluster analysis was carried out on the gene-expression data from microarray experiments. An average linkage hierarchi-cal clustering algorithm was used to group cDNAs according to the similarity of their expression patterns. These computa-tions were carried out using the S-PLUS software package (Mathsoft, Seattle, WA). Valid microarray signals had a ratio of signal to background > 2.5. Genes were selected for cluster analysis on the following criteria: the signal intensity was at least 100 units above the background; among all probe pairs for any given gene, at least one pair had the probe 2 versus probe 1 ratio larger than 2.5-fold; and no more than one missing value among all probe pairs was allowed for a given gene. The expression levels of those known genes in individ-ual cluster are also displayed in Figure 1b. The log(fold expression) values are plotted on these graphs. However, the
y-axis represents the corresponding anti-log values, that is, original fold expression values.
Quantitative RT-PCR (TaqmanTM)
The gene-specific probes and primers for the quantitative detection of the target mRNAs were designed using Primer Express (PE Biosystems, Foster City, CA). Table 4 summa-rizes all the Taqman primers and probe information and sequences. Three of the 20 sets of primers and probes were designed from monkey cDNA sequences that were available from GenBank. The remaining gene-specific primers and probes were designed using conserved regions of human ortholog cDNA sequences based on the alignment of cDNA sequences from several species. Total RNA was isolated from monkey lungs with a Qiagen RNA/DNA kit (Qiagen, Valen-cia, CA), followed by DNase treatment (Ambion, CA) to remove genomic DNA contamination. The RNA was then
used for the first-strand cDNA synthesis. Two micrograms of total RNA were primed with oligo(dT)15and oligo(dN)6and were reverse transcribed into cDNA (Superscript II; Gibco/BRL) in a total volume of 20 Pl. Aliquots of cDNA target template were diluted serially and mixed with 300 nM of primers and 200 nM of fluorogenic probe (Perkin-Elmer, Foster City, CA). The reactions were carried out in the Uni-versal PCR master mix, containing MgCl2, dNTP and DNA
polymerase AmpliTaq GoldTM (Perkin-Elmer) in a total
volume of 50 Pl. The PCR reactions were in duplicate on an ABI PRISM 7700 Sequence detection system (TaqmanTM).
The reaction program was as follows: the initial step of 2 min at 50°C; denaturation at 95°C for 10 min, followed by 45 thermal cycles of denaturation (15 sec at 95°C) and elonga-tion (1 min at 60°C). The relative quantitaelonga-tion of the target mRNAs was carried out using the comparative method according to [45]. The mRNA expression levels for all samples were normalized to the levels for the housekeeping gene HPRT.
Statistical analysis
One-way analyses of variance were carried out on the expression data obtained from quantitative RT-PCR. The results for each gene were analyzed separately using log(nor-malized expression level) as the dependent variable and the challenge status of the monkeys as the group variable.
Acknowledgements
We thank C. Garlisi and J. Jakway for their review of the microarray data and suggestions for genes for further analysis, R. W. Chapman for revision of the manuscript, and L. Xia for technical support.
References
1. Bousquet J, Jeffery PK, Busse WW, Johnson M, Vignola AM:
Asthma. From bronchoconstriction to airways
inflamma-tion and remodeling. Am J Respir Crit Care Med 2000, 161:
1720-1745.
2. Barnes PJ, Chung KF, Page CP: Inflammatory mediators of
asthma: an update. Pharmacol Rev 1998, 50:515-596.
3. Cookson W: The alliance of genes and environment in
asthma and allergy.Nature 1999, 402:B5-B11.
4. Duffy DL, Martin NG, Battistutta D, Hopper JL, Mathews JD:
Genetics of asthma and hay fever in Australian twins. Am Rev
Respir Dis 1990, 142:1351-1358.
5. Barnes KC: Atopy and asthma genes - where do we stand?
Allergy 2000, 55:803-817.
6. Borish L: Genetics of allergy and asthma. Ann Allergy Asthma Immunol 1999, 82:413-424.
7. Schena M, Shalon D, Davis RW, Brown PO: Quantitative moni-toring of gene expression patterns with a complementary
DNA microarray.Science 1995, 270:467-470.
8. Eisen MB, Spellman PT, Brown PO, Botstein D: Cluster analysis
and display of genome-wide expression patterns. Proc Natl
Acad Sci USA 1998, 95:14863-14868.
9. Perou CM, Sorlie T, Eisen MB, van de Rijn M, Jeffrey SS, Rees CA, Pollack JR, Ross DT, Johnsen H, Akslen LA, et al.: Molecular
por-traits of human breast tumours.Nature 2000, 406:747-752.
10. Alizadeh AA, Eisen MB, Davis RE, Ma C, Lossos IS, Rosenwald A, Boldrick JC, Sabet H, Tran T, Yu X, et al.: Distinct types of diffuse large B-cell lymphoma identified by gene expression profil-ing.Nature 2000, 403:503-511.
11. Ly DH, Lockhart DJ, Lerner RA, Schultz PG: Mitotic
12. Gundel RH, Gerritsen ME, Gleich GJ, Wegner CD: Repeated antigen inhalation results in a prolonged airway eosinophilia
and airway hyperresponsiveness in primates. J Appl Physiol
1990, 68:779-786.
13. Turner CR, Andresen CJ, Smith WB, Watson JW: Characteriza-tion of a primate model of asthma using
anti-allergy/anti-asthma agents. Inflamm Res 1996, 45:239-245.
14. Young SS, Ritacco G, Skeans S, Chapman RW: Eotaxin and nitric oxide production as markers of inflammation in allergic
cynomolgus monkeys.Int Arch Allergy Immunol 1999, 120:209-217.
15. Schleimer RP, Bochner BS: The role of adhesion molecules in allergic inflammation and their suitability as targets of
antiallergic therapy. Clin Exp Allergy 1998, 28:15-23.
16. Teran LM: CCL chemokines and asthma. Immunol Today 2000,
21:235-242.
17. Kane MD, Jatkoe TA, Stumpf CR, Lu J, Thomas JD, Madore SJ:
Assessment of the sensitivity and specificity of
oligonu-cleotide (50mer) microarrays.Nucleic Acids Res 2000, 28:
4552-4557.
18. Ying S, Robinson DS, Meng Q, Barata LT, McEuen AR, Buckley MG, Walls AF, Askenase PW, Kay AB: C-C chemokines in allergen-induced late-phase cutaneous responses in atopic subjects: association of eotaxin with early 6-hour eosinophils, and of eotaxin-2 and monocyte chemoattractant protein-4 with the later 24-hour tissue eosinophilia, and relationship to basophils and other C-C chemokines (monocyte chemoattractant
protein-3 and RANTES).J Immunol 1999, 163:3976-3984.
19. Kodelja V, Muller C, Politz O, Hakij N, Orfanos CE, Goerdt S:
Alternative macrophage activation-associated CC-chemokine-1, a novel structural homologue of macrophage inflammatory protein-1 alpha with a Th2-associated
expres-sion pattern.J Immunol 1998, 160:1411-1418.
20. Teran LM, Mochizuki M, Bartels J, Valencia EL, Nakajima T, Hirai K, Schroder JM: Th1- and Th2-type cytokines regulate the expression and production of eotaxin and RANTES by
human lung fibroblasts.Am J Respir Cell Mol Biol 1999, 20:
777-786.
21. Spoelstra FM, Postma DS, Hovenga H, Noordhoek JA, Kauffman HF:
Interferon-gamma and interleukin-4 differentially regulate ICAM-1 and VCAM-1 expression on human lung fibroblasts.
Eur Respir J 1999, 14:759-766.
22. Benarafa C, Cunningham FM, Hamblin AS, Horohov DW, Collins
ME: Cloning of equine chemokines eotaxin, monocyte
chemoattractant protein (MCP)-1, MCP-2 and MCP-4, mRNA expression in tissues and induction by IL-4 in dermal
fibroblasts. Vet Immunol Immunopathol 2000, 76:283-298.
23. O’Connor CM, FitzGerald MX: Matrix metalloproteases and
lung disease. Thorax 1994, 49:602-609.
24. Cho SH, Tam SW, Demissie-Sanders S, Filler SA, Oh CK: Produc-tion of plasminogen activator inhibitor-1 by human mast
cells and its possible role in asthma. J Immunol 2000, 165:
3154-3161.
25. Bleau G, Massicotte F, Merlen Y, Boisvert C: Mammalian
chiti-nase-like proteins. Exs 1999, 87:211-221.
26. Volck B, Price PA, Johansen JS, Sorensen O, Benfield TL, Nielsen HJ, Calafat J, Borregaard N: YKL-40, a mammalian member of the chitinase family, is a matrix protein of specific granules in
human neutrophils.Proc Assoc Am Physicians 1998, 110:351-360.
27. Eitzman DT, McCoy RD, Zheng X, Fay WP, Shen T, Ginsburg D, Simon RH: Bleomycin-induced pulmonary fibrosis in trans-genic mice that either lack or overexpress the murine
plas-minogen activator inhibitor-1 gene. J Clin Invest 1996,
97:232-237.
28. Kalsheker NA: Alpha1-antichymotrypsin.Int J Biochem Cell Biol 1996, 28:961-964.
29. Malerba G, Patuzzo C, Trabetti E, Lauciello MC, Galavotti R, Pescollderungg L, Whalen MB, Zanoni G, Martinati LC, Boner AL, et
al.: Chromosome 14 linkage analysis and mutation study of 2
serpin genes in allergic asthmatic families.J Allergy Clin Immunol
2001, 107:654-658.
30. Barnes PJ: Reactive oxygen species in asthma. Eur Respir Rev. 2000, 10:240-243.
31. Wilson CL, Matrisian LM: Matrilysin: an epithelial matrix
met-alloproteinase with potentially novel functions.Int J Biochem
Cell Biol 1996, 28:123-136.
32. Barnes JL, Mitchell RJ, Kanalas JJ, Barnes VL: Differential expres-sion of thrombospondin and cellular fibronectin during
remodeling in proliferative glomerulonephritis. J Histochem
Cytochem 1999, 47:533-544.
33. Yang F, Ghio AJ, Herbert DC, Weaker FJ, Walter CA, Coalson JJ:
Pulmonary expression of the human haptoglobin gene.Am J
Respir Cell Mol Biol 2000, 23:277-282.
34. Gundel RH, Wegner CD, Letts LG: Antigen-induced acute and
late-phase responses in primates. Am Rev Respir Dis 1992,
146:369-373.
35. Hamalainen H, Meissner S, Lahesmaa R: Signaling lymphocytic activation molecule (SLAM) is differentially expressed in
human Th1 and Th2 cells.J Immunol Methods 2000, 242:9-19.
36. Isomaki P, Aversa G, Chang CC, Luukkainen R, Nikkari S, Toivanen P, de Vries JE, Punnonen J: Expression of soluble human
signal-ing lymphocytic activation molecule in vivo. J Allergy Clin
Immunol 1999, 103:114-118.
37. Christian-Ritter KK, Hill LD, Hoie EB, Zach TL: Effect of inter-leukin-4 on the synthesis of the third component of
comple-ment by pulmonary epithelial cells. Am J Pathol. 1994,
144:171-176.
38. Gautam SC, Noth CJ, Janakiraman N, Pindolia KR, Chapman RA:
Induction of chemokine mRNA in bone marrow stromal
cells: modulation by TGF-beta 1 and IL-4. Exp Hematol 1995,
23:482-491.
39. Albanesi C, Scarponi C, Sebastiani S, Cavani A, Federici M, De Pita O, Puddu P, Girolomoni G: IL-4 enhances keratinocyte
expres-sion of CXCR3 agonistic chemokines. J Immunol 2000,
165:1395-1402.
40. Sauty A, Dziejman M, Taha RA, Iarossi AS, Neote K, Garcia-Zepeda EA, Hamid Q, Luster AD: The T cell-specific CXC chemokines IP-10, Mig, and I-TAC are expressed by activated human
bronchial epithelial cells.J Immunol 1999, 162:3549-3558.
41. Zhang S, Lawless VA, Kaplan MH: Cytokine-stimulated T
lym-phocyte proliferation is regulated by p27Kip1.J Immunol 2000,
165:6270-6277.
42. Amdur MO, Mead J: Mechanics of respiration in
unanes-thetized guinea pigs.Am J Physiol 1958, 192:364-368.
43. Sambrook J, Fritsch EF, Maniatis T: Molecular Cloning: A Laboratory Manual. New York: Cold Spring Harbor Laboratory Press, 1989. 44. DeRisi JL, Iyer VR, Brown PO: Exploring the metabolic and
genetic control of gene expression on a genomic scale.
Science 1997, 278:680-686.
45. Perkin-Elmer Applied Biosystems:User Bulletin No. 2(11 December, 1997).
comment
reviews
reports
deposited research
interactions
information