Optimization of machining parameters in wire
electrical discharge machine process by
combination of genetic algorithm and artificial
neural network
Rajesh S1, Nandhakumar S2 1
Assistant Professor, 2PG Scholar
Department of Mechanical Engineering, Kumaraguru college of Technology Coimbatore
Abstract: Wire electrical discharge machining (WEDM) has become an important non-traditional machining process. Wire Electrical discharge machining (WEDM) process, at present is still an experience process, wherein selected parameters are often far from the optimum, and at the same time selecting optimization parameters is costly and time consuming. In this paper, artificial neural network (ANN) and genetic algorithm (GA) are used together to establish the parameter optimization model. An ANN model which adapts Levenberg-Marquardt algorithm has been set up to represent the relationship between material removal rate (MRR) and input parameters, and GA is used to optimize parameters, so that optimization results are obtained. The model is shown to be effective, the main objective is to select proper machining parameters to get high Material Removal Rate (MRR).
Keywords: Electrical discharge machining (EDM), Genetic algorithm (GA), Artificial neural network (ANN), Levenberg-Marquardt algorithm
I. INTRODUCTION
428
A. Artificial neural network
[image:3.612.165.475.189.643.2]Artificial neural network (ANN) is an effective method to solve non-linear problem. There are many ANN applications in EDM. Software computing techniques like artificial neural networks (ANN) are highly flexible modelling tools with the capabilities of learning the mapping between input and output for any complex nonlinear system. Predictions of surface finish for various work materials with the change of electrode polarity were compared based upon six different ANN models (Tsai and Wang, 2001). An ANN forecasting project was presented based on Web for EDM technology (Yang and Zhao, 2005). A tool wear prediction model was established based on ANN (Li et al., 2004). A method that can optimize the processing parameters was presented in the EDM sinking process with the application of ANN.
TABLE 1
SINGLE POINT CROSSOVER PROCESS
TABLE 2
DOUBLE POINT CROSSOVER PROCESS
TABLE 3
UNIFORM CROSSOVER PROCESS
TABLE 4 MUTATION PROCESS
B. Genetic Algorithm
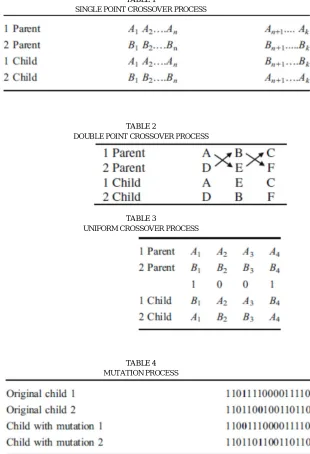
However, it does not guarantee that. Formation of first group in selection is random. However, fitness of solutions determines the chance of being selected in that random selection [19–21]. GA passes through three phases to form a new generation: Evaluating the value of fitness for each individual in the old generation, selecting individuals based on their value of fitness (using fitness function) and continuing generations with selected individuals using operators such as crossover and mutation. The aim of crossover process is to produce child chromosomes by changing the locations of main chromosome genes and hence to obtain chromosomes having even higher value of fitness from the ones with high values of fitness. There are three types of mostly used crossover for binary coding in the literature [20]. Single point, double point, and uniform crossover processes were explained in order and following tables are helpful [19–21] (Tables 1 and 2).In the uniform crossover, in order to determine displacinggenes, the numbers 0 and 1 are generated randomly. Inthis manner, the same numbers of genes are generated. In Table 3 the string ‘1001’ is a randomly generated number string. For number of ‘1’ genes will be displaced, but fornumber of ‘0’ will not be displaced (Table 3).The purpose of this process is to form a new chromosomeby changing the place of one or more genes of an\ existing chromosome. As a consequence of permanent regeneration, the chromosomes in coming generations might start to repeat each other after some period of timeand thus, production of different chromosomes might haltor decrease drastically. For this reason, some of the chromosomes are subject to mutation in order to increase the diversity of them. Mutation process is as indicated inTable 4.
In the present work, ANN and GA are used together to establish parameter optimization model. An ANN model has been established to represent the relationship between MRR and input variables (current,pulse on time and pulse off time), which adapts Levenberg-Marquardt algorithm. GA has been used to obtain an optimal combination of parameters.
II. OPTIMIZATION MODEL
In WEDM process, material is removed by erosive effects from a series of electrical sparks generated between tool and work-piece material with constant electric field emerging in a dielectric environment. WEDM is a complicated process, and it is very hard to use traditional method to describe or optimize its parameters. To improve production rate and to decrease dependence on experience, it is necessary to establish an optimization model. The problem in this paper can be described as How to select proper machining parameters to get higher MRR.
A. Mathematical model M Op( f (I,Ton ,Toff ,W)), (1) 4 ≤ I ≤18, (2) 23 ≤ Ton ≤ 506 , (3) 23 ≤ Toff ≤186, (4)
where I, Ton, Toff are current, pulse on time and pulse off time respectively, W is the weight matrix that is evaluated in the network training process, f represents the function relationship between MRR and three variables, Op is GA which is adapted to optimize machining parameters.
III. FLOW CHART, PARAMETERS OF GA
The flow chart is shown in Fig.1, and the procedure steps are as follows:
(1) Adapt binary code. There are three variables, with different span. For current, its span is between 8 and 18 A; bit length is taken as 3; 000, 001, 010, 011, 100, 101, 110, 111 represent current of 4, 6, 8, 10, 12, 14, 16, 18 A, respectively. For pulse on time, bit length is also taken as 3; 000, 001, 010, 011, 100, 101, 110, 111 represent pulse on time 23, 58, 166, 256, 316, 376,
416, 506 μs, respectively. For pulse off time, bit length is taken as 4; 0000, 0001, 0010, 0011, 0100, 0101, 0110, 0111, 1000,
1001, 1010, 1011, 1100, 1101 represent pulse off time 23, 29, 38, 48, 56, 59, 80, 96, 118, 128, 138, 148, 170, 186 μs
respectively. When 1110 or 1111 occurs, the random number generation is invoked till they are among the range of [0000 1101].So,the total bit length of a chromosome is 3+3+4=10.
(2) Objective function value is MRR, which comes from ANN model.
(3) The population size is taken as 300, and the original population is generated randomly. (4) Convert binary value to decimal values according to rules of Step (1).
(5) Simulate the network created, get objective function value (ANN will be introduced in detail in the next section); the value is MRR.
(6) Assign fitness values according to objective function values, and return a column vector containing the corresponding individual fitness.
430
0.9.
(8) Then perform single-point crossover between pairs of individuals and return the current
Fig.2 Optimization flow chart
generation after mating. Crossover probability Pc=0.8.
(9) Mutate each element with given probability and return the resulting population; mutated chromosomes will be returned to Step (4) when generation maximum is not met; mutation probability Pm= 0.07.
(10) Procedure will stop when generation maximum is met; otherwise, recycle from Step (4). Generation maximum is taken as 250.
(11) Convert binary chromosome to decimal value.
IV. ANN MODEL
Some researchers find three layer networks can be used to approximate almost any function, if having enough neurons in the hidden layers. So in this paper, we select a three-layer network. The hidden layer activation function is hyperbolic tangent sigmoid transfer function, shown as follows:
The output layer activation function is linear transfer function.
MRR, so that they always fall into the span [0.1, 0.9]. It is assumed that X is the vector to be scaled.
[image:6.612.171.360.229.373.2]
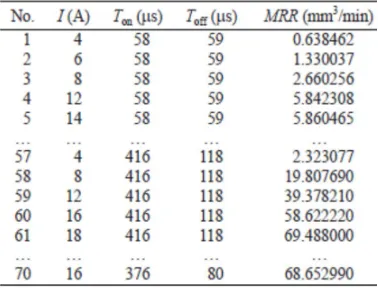
where xmax, xmin are maximum and minimum of vector X respectively, x is one element of vector X. After simulation, convert outputs back into the original values. Algorithm is the inverse function of Eq.(6). All data are divided into two parts, one is training data, as shown in Table 1, and another is checking data, which checks the generalization performance, as shown in Table 2. Experiment was performed with normal polarity. Experiment condition: Electrode is copper, work piece is C40 steel, dielectric fluid is rustlickTM EDM oil of grade EDM 30, flushing pressure is 0.25 kg/cm2, experiment was performed with normal polarity.
TABLE 5
[image:6.612.170.397.400.495.2]PART OF TRAINING DATA (EXPERIMENT RESULT WITH VARIOUS MACHINING PARAMETERS)
TABLE 6
CHECKING DATA (EXPERIMENT RESULTWITHVARIOUSMACHINING PARAMETERS)
Figs.3 and 4 give the linear regression between the network response (prediction values) and the target (experiment values). The correlation coefficient (R-value) is a measure of how well the variation in the output is explained by the target, if it is equal to 1, then there is perfect correlation between targets and outputs.The network outputs are plotted versus the targets as open circles. From them, it is clear that the two outputs seem to track the targets reasonably well, and R-value is 0.99995 and 0.99983 respectively. The best linear fit is indicated by the solid line, and the perfect fit by the dashed line. In these figures, it is difficult to distinguish the best linear fit line from the perfect fit line, which indicates a good fit.
432
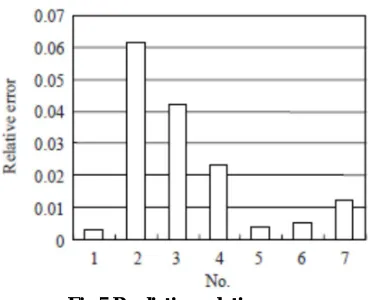
Fig.4 Regression analysis between check MRR and their prediction [image:7.612.212.398.263.413.2]Fig.5 gives prediction relative error of checking data. It is clear that the net has better generalization performance, the maximum of prediction relative error is 6.15% and the minimum is 0.29%, mean of relative error is 2.16%.
Fig.5 Prediction relative error
Optimization model will use ANN model to get MRR value.
V. RESULT AND DISCUSSION
Because original chromosomes are given randomly, this may induce getting different solution set, so the procedure was repeated many times. The result shows that although the set are slightly different, all of them can get the same maximum of MRR, and corresponding parameters are also the same. Table7 shows one group solution set evolved after 250 generations. Parameters listed in number 8 lead to the optimal solution; MRR values are 78.0370 mm3/min, where current, pulse on time and pulse off time are 18 A, 416 μs, 59 μs respectively. Compare them with maximal MRR in Table 5, namely number 61, MRR is 69.488
mm3/min, where current, pulse on time and pulse off time are 18 A, 416 μs, and 118 μs respectively, it is clear that MRR is
improved using optimized parameters.
TABLE 7
SOLUTION SET OF WEDM PROCESS
the former is 76.3736mm3/min, and that of the latter is 75.443590 mm3/min; they only have slight difference. It means that optimized value is close to experiment value.
VI. CONCLUSION
In this paper, one method to optimize EDM process parameters is introduced, which uses Levenberg-Marquardt algorithm and GA together. An ANN model was set up to represent the relationship between MRR and input parameters, which adapted Levenberg-Marquardt algorithm and its network architecture was 3-26-1. It shows that the net has better generalization performance, and convergence speed is faster. GA is used to optimize parameters. MRR is improved by using optimized parameters; it is close to experiment result. With the increase of current, MRR can be improved. MRR can also be improved when we set proper pulse on time and pulse off time with the same current.
REFERENCES
[1] Cao, F.G., Yang, D.Y., 2004. The study of high efficiency and intelligent optimization system in EDM sinking process.Journal of Materials Processing Technology, 149(1-3): 83-87. [doi:10.1016/j.jmatprotec.2003.10.059]
[2] Das, S., Klotz, M., Klocke, F., 2003. EDM simulation: finite element-based calculation of deformation, microstructure and residual stresses. Journal of Materials Processing Technology, 142(2):434-451. [doi:10.1016/S0924-0136
(03)00624-1]
[3] Ho, K.H., Newman, S.T., 2003. State of the art electrical discharge machining (EDM). International Journal of MachineTools and Manufacture, 43(13):1287-1300.[doi:10.1016/S0890-6955(03)00162-7]
[4] Kuriakose, S., Shunmugam, M.S.,2005. Multi-objective optimization of wire-electro discharge machining process by non-dominated sorting genetic algorithm. Journal of Materials Processing Technology, 170(1-2):133-141.
[5] Li, X.L., Yin, G.F., Lin, C.Y., 2004. Tool wear prediction in electrical discharge milling machining based on evolutionary neural network. Chinese Journal of Mechanical\ Engineering, 40(3):61-64 (in Chinese).
[6] Mandal, D., Pal, S.K., Saha, P., 2007. Modeling of electrical discharge machining process using back propagation neural network and multi-objective optimization using non-dominating sorting genetic algorithm-II. Journal of Materials Processing Technology, 186(1-3):154-162.
[7] Rao, S.S., 1991. Optimization Theory and Applications. Wiley Eastern Limited, New Delhi.Tsai, K.M., Wang, P.J., 2001. Predictions on surface finish in electrical discharge machining based upon neural network models. International Journal of Machine Tools and Manufacture, 41:1385-1403.
[8] Yang, X.D.,2002. Genetic algorithms based optimization model for EDM parameters. Journal of Harbin Institute of Technology, 34(4):450-454 (in Chinese).