0095-1137/07/$08.00⫹0 doi:10.1128/JCM.02528-06
Copyright © 2007, American Society for Microbiology. All Rights Reserved.
Rapid, Standardized Method for Determination of
Mycobacterium tuberculosis
Drug Susceptibility
by Use of Mycolic Acid Analysis
䌤
Nicole Parrish,
1* Gerard Osterhout,
1Kim Dionne,
1Amy Sweeney,
1Nicole Kwiatkowski,
1Karen Carroll,
1Kenneth C. Jost, Jr.,
2and James Dick
1Department of Pathology, Division of Medical Microbiology, Johns Hopkins University, Baltimore, Maryland,1and
Texas Department of State Health Services, Austin, Texas2
Received 18 December 2006/Returned for modification 28 March 2007/Accepted 21 September 2007
Multidrug-resistant (MDR)Mycobacterium tuberculosisand extrensively drug-resistant (XDR)M.
tuberculo-sisare emerging public health threats whose threats are compounded by the fact that current techniques for
testing the susceptibility ofM. tuberculosisrequire several days to weeks to complete. We investigated the use
of high-performance liquid chromatography (HPLC)-based quantitation of mycolic acids as a means of rapidly
determining drug resistance and susceptibility inM. tuberculosis. Standard susceptibility testing and
determi-nation of the MICs of drug-susceptible (nⴝ26) and drug-resistantM. tuberculosisstrains, including MDRM.
tuberculosisstrains (nⴝ34), were performed by using the Bactec radiometric growth system as the reference method. The HPLC-based susceptibilities of the current first-line drugs, isoniazid (INH), rifampin (RIF), ethambutol (EMB), and pyrazinamide (PZA), were determined. The vials were incubated for 72 h, and aliquots were removed for HPLC analysis by using the Sherlock mycobacterial identification system. HPLC quantita-tion of total mycolic acid peaks (TMAPs) was performed with treated and untreated cultures. At 72 h, the levels of agreement of the HPLC method with the reference method were 99.5% for INH, EMB, and PZA and 98.7% for RIF. The inter- and intra-assay reproducibilities varied by drug, with an average precision of 13.4%. In summary, quantitation of TMAPs is a rapid, sensitive, and accurate method for antibiotic susceptibility testing
of all first-line drugs currently used againstM. tuberculosisand offers the potential of providing susceptibility
testing results within hours, rather than days or weeks, for clinicalM. tuberculosisisolates.
Tuberculosis, one of the oldest diseases known to humans, remains a major public health threat worldwide. Two billion people, or one-third of the world’s population, are infected with the causative agent,Mycobacterium tuberculosis(5). More than 9 million new cases of tuberculosis (TB) are reported each year, resulting in 2 million deaths (5). Drug-resistantM. tuberculosisstrains are rapidly becoming the next global health emergency and are the harbingers of an impending pandemic (2, 6, 7, 8, 9, 11, 13, 16, 18, 23). Much of the drug resistance worldwide is the result of inadequate or inappropriate therapy and is linked to the impossibly long and costly treatment courses, which have toxic side effects (8, 17). Multidrug resis-tance (MDR), defined as resisresis-tance to at least isoniazid (INH) and rifampin (RIF), is now common throughout the world, with average rates of resistance of 15% in high-burden coun-tries (16, 23). Second-line drugs, which are generally more costly and more toxic than their first-line counterparts, have been the mainstay of therapy for MDR TB. However, this last line of defense is now failing. Recently, MDRM. tuberculosis
strains with extensive resistance to second-line drugs have been identified throughout the world. These strains, known as ext-rensively drug-resistant (XDR) M. tuberculosis, threaten to
move control efforts back to the preantibiotic era (6, 11, 13, 18).
Current susceptibility testing methods can require several weeks to complete, which results in the empirical treatment of patients with standard first-line drug regimens until the need for the use of alternative second-line drugs is indicated. This delay can result in the dissemination of drug-resistantM. tu-berculosisto others in the population. More rapid and reliable susceptibility testing would enable health care workers to iden-tify those with MDR and XDR TB earlier and provide for the more timely initiation of appropriate drug regimens. Such technology is essential for the future of TB control.
Previous investigators have demonstrated the feasibility of performingM. tuberculosissusceptibility testing by measuring mycolic acid levels by high-performance liquid chromatogra-phy (HPLC) (10, 21). Mycolic acids are high-molecular-weight
␣-alkyl,-hydroxy fatty acids containing an␣branch of 20 to 25 carbons and a primary or meromycolate chain of 50 to 60 carbons. These large fatty acids comprise up to 30% of the mycobacterial cellular dry weight and are actively synthesized during vegetative growth. HPLC has been used extensively for the qualitative analysis of mycolic acids, providing a valuable method for the identification of mycobacteria isolated from clinical specimens (3, 4). In addition to the qualitative data obtained with each analysis, the chromatogram provides a quantitative measure of the total mycolic acids derived from the total peak height/area response of the total mycolic acid peaks (TMAPs). A linear relationship exists between this total response and the numbers of CFU/ml, and this relationship
* Corresponding author. Mailing address: Johns Hopkins Univer-sity, Department of Pathology, 600 North Wolfe Street, Meyer B1-193, Baltimore, MD 21287. Phone: (410) 955-5077. Fax: (410) 558-9098. E-mail: [email protected].
䌤Published ahead of print on 3 October 2007.
3915
on May 16, 2020 by guest
http://jcm.asm.org/
has enabled previous investigators to demonstrate the feasibil-ity of performingM. tuberculosissusceptibility testing by mea-suring the total mycolic acid concentration (10).
In the current work, we describe an improved, standardized, and validated mycolic acid-based susceptibility testing method.
MATERIALS AND METHODS
Organisms and antibiotics.AllM. tuberculosisstrains (n⫽59 clinical strains and strain H37Rv) were maintained on Lowenstein-Jensen agar slants (Difco, Detroit, MI) at 37°C. All drugs (INH, RIF, ethambutol [EMB], pyrazinamide [PZA], and streptomycin [STR]) were purchased from Becton Dickinson (Sparks, MD). All assays were performed in duplicate.
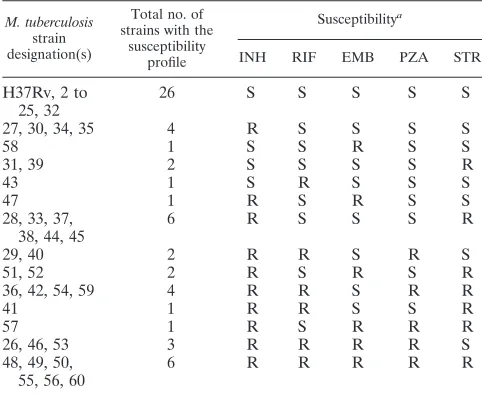
Standard susceptibility testing. Susceptibility testing and determination of MICs were done by using the Bactec 460 radiometric growth system (Becton Dickinson) and/or the agar proportion method by the use of standard protocols (15, 19). Table 1 shows the profiles of susceptibility to INH, RIF, EMB, PZA, and STR of each of the strains used in this study. Briefly, for the Bactec 460 system, a standardized inoculum (a 1.0 McFarland standard) was prepared for each isolate and 0.1 ml was injected into each of the following vials: a control vial with no antibiotic representing a 1:100 dilution of the inoculum; a control vial with no antibiotic representing the inoculum used in the drug-containing vials;
and vials each containing INH (0.1g/ml and 0.4g/ml), RIF (2.0g/ml), EMB
(2.5g/ml), and STR (2.0g/ml). The growth index (GI) was monitored at 24-h
intervals until the reading in the control diluted 1:100 reached a value of 30. The GI change was then calculated for a 1-day period for each drug tested. A GI
change of⬍30 indicated susceptibility to a given agent. Resistance (GI⬎30) to
any of the anti-M. tuberculosisdrugs (INH, RIF, EMB, or STR) was confirmed
by repeat testing with the Bactec radiometric system and/or by the Middlebrook
agar proportion method (15). The anti-M. tuberculosisdrugs and concentrations
tested by the agar proportion method were as follows: INH, 1.0g/ml; RIF, 1.0
g/ml; EMB, 5.0g/ml; and STR, 2.0g/ml.
PZA susceptibility testing.PZA is active only at lower pH values compared with the pHs at which the other first-line agents are active. Thus, PZA suscep-tibility testing was done by using a commercially available medium with a lower pH (6.0) and a variation of the standard Bactec 460 procedure (19). Briefly, 0.1
ml from a “seed vial” (GIs⫽ 300 to 499) was used to inoculate two new
pH-adjusted vials: an undiluted control vial and a vial containing PZA (100
g/ml). The vials were incubated until the GI in the control vial reached 200.
Susceptibility and resistance were defined as follows: if the GI in the
PZA-containing vial was⬍9% of the GI in the control vial, the strain was classified as
susceptible. If the GI in the PZA-containing vial was⬎11% of the GI in the
control vial, the strain was classified as resistant. Strains exhibiting GIs between 9% and 11% of the control GI were classified as borderline resistant.
HPLC susceptibility testing. (i) Time course determination and sample pro-cessing.The same standardized inoculum and procedure outlined above for the Bactec 460 system were used. An undiluted control vial was included for each strain tested and was used for comparison of the TMAPs with those of the antibiotic-containing vials. The vials were monitored at 24-h intervals for up to 72 h, and the GI obtained with the Bactec system was recorded. Aliquots (2 ml) were removed from the individual vials at 20 min and 24, 48, and 72 h following the introduction of each antibiotic and were mixed 1:1 with 50% potassium hydroxide, followed by autoclaving for 30 min. Once the mixtures were cooled to room temperature, 3.6 ml of 50% HCl was added and the contents of the tubes were mixed by inverting the tubes two to three times. Subsequently, 3 ml of
CHCl3was added to each tube, the tubes were vortexed for 1 min, and the phases
were allowed to separate. Equal volumes of each CHCl3layer from each strain
tested were transferred to a clean glass tube and dried under N2. Fluorescent
derivatives of the mycolic acids were prepared as described previously (22).
Briefly, the samples were dissolved in 200l of CHCl3containing 200g of
4-bromomethyl-6,7-dimethoxycoumarin and 200g of 18-crown-6 ether (both
from Sigma) and transferred to a 2-ml amber vial containing 100l of 2%
potassium bicarbonate solution which had previously been evaporated. The vials were heated at 60°C for 10 min and allowed to evaporate. Dried extracts were
resuspended in 150l of HPLC-grade isopropanol (Fisher Scientific) and
trans-ferred to a vial containing two fluorescently derivatized mycolic acid reference
standards (⬃40 and⬃97 carbons) whose retention times do not overlap with
those of the mycolic acids present inM. tuberculosis.
(ii) HPLC conditions.HPLC analysis was performed on an Agilent (Wilming-ton, DE) 1100 HPLC system consisting of an autosampler, quaternary pump, column heater (70°C), and fluorescence detector. The instrument was controlled by the use of Sherlock (MIDI, Inc., Newark, DE) software coupled with Agilent
ChemStation software. The sample injection volume was 5l. Separation of the
mycolic acids was achieved with an Agilent Zorbax SB-C18column (4.6 mm by 75
mm), a mobile phase of methanol-isopropanol (IPA), and a linear gradient of 23% IPA to 95% IPA over a 10-min period with a flow rate of 1.7 ml/min. Mycolates were detected with a fluorescence detector by using excitation and emission wavelengths of 345 nm and 425 nm, respectively. To maintain maximum sensitivity, the column effluent was cooled to 22°C before it was placed into the detector.
(iii) Chromatographic data analysis.Raw chromatographic data, expressed as the peak height response, were acquired with ChemStation software and pro-cessed by using Sherlock software for calculation of the TMAP. The TMAPs were determined for each isolate-drug combination and were compared to that for the corresponding control. The resulting ratio was used for all further data analysis.
Growth rate determination.For growth rate comparisons, a suspension of each strain to be tested was prepared from solid medium by using commercially prepared diluting fluid (Becton Dickinson) and glass beads. The suspensions were vortexed and allowed to settle for a minimum of 30 min, and a 0.1-ml aliquot of the supernatant was removed and used to inoculate a Bactec 12B “seed vial.” The seed vials were read at 24-h intervals until a GI of 999 was reached. Subsequently, 0.1 ml was removed from each seed vial and used to inoculate a new Bactec 12B vial. The GI was then recorded at 24-h intervals for up to 9 days, and the average daily change in the GI was calculated for each strain.
RESULTS
Time course determination.A time course analysis was done
to determine the optimal time point at which quantitative differences in the total mycolic acids could be correlated with drug susceptibility or resistance to a given agent. This was done for first-line antimycobacterial drugs that act in both a mycolic acid-specific and a non-mycolic acid-specific manner. The chromatograms were analyzed for the total mycolic acid profile for each strain-antibiotic combination and compared to the profile for the corresponding untreated control. Figure 1 shows a characteristic chromatogram for a drug-susceptible strain of
[image:2.585.42.283.90.287.2]M. tuberculosis, strain H37Rv, with and without INH, and the specific region which comprises TMAP. As shown, significant differences in TMAPs were found at 72 h of exposure to the
TABLE 1. M. tuberculosisstrains used in this study and their susceptibility profiles
M. tuberculosis
strain designation(s)
Total no. of strains with the
susceptibility profile
Susceptibilitya
INH RIF EMB PZA STR
H37Rv, 2 to 25, 32
26 S S S S S
27, 30, 34, 35 4 R S S S S
58 1 S S R S S
31, 39 2 S S S S R
43 1 S R S S S
47 1 R S R S S
28, 33, 37, 38, 44, 45
6 R S S S R
29, 40 2 R R S R S
51, 52 2 R S R S R
36, 42, 54, 59 4 R R S R R
41 1 R R S S R
57 1 R S R R R
26, 46, 53 3 R R R R S
48, 49, 50, 55, 56, 60
6 R R R R R
aSusceptibilities were determined with the Bactec 460 system. S, susceptible;
R, resistant.
on May 16, 2020 by guest
http://jcm.asm.org/
antibiotic. Differences were noted between antibiotics. For in-stance, the mycolic acid-inhibiting drug, INH, caused a nearly linear decrease in the percent change in TMAP relative to that for the corresponding control over a 72-h incubation period, ranging from a 34% reduction at 20 min to an 80% reduction at 72 h for strain H37Rv (Fig. 2). However, for a non-mycolic acid-specific inhibitor such as RIF for a susceptible strain, little change in the TMAP was observed at the earliest time points tested: 5.2% at 20 min and 18% at 24 h. At the later time
points of 48 and 72 h, the decreases in the TMAPs were 25% and 63%, respectively (Fig. 2). Other first-line drugs, such as EMB and PZA, showed similar patterns for drug-susceptible strains, with the greatest reductions in the TMAPs observed at 72 h of incubation (76% and 67%, respectively). This time point was selected for evaluation because it was the time at which the largest reproducible difference in TMAPs was ob-served for all drugs, regardless of their mechanisms of action.
TMAP susceptibility testing and breakpoint determination.
TMAP susceptibility assays were conducted at 72 h for allM. tuberculosisstrain-antibiotic combinations (n⫽60), the TMAP was calculated, and the ratio of the values for the treated strains to those for the untreated controls were determined. At 72 h, drug-susceptible strains demonstrated an average reduc-tion in TMAP of⬎78% (range, 52% to 90%) compared with the values for the corresponding controls. These differences varied by antibiotic, with the greatest inhibition in susceptible strains being observed with INH (average, ⫺89%; range,
⫺76% to⫺100%) and RIF (average,⫺88%; range,⫺43% to
⫺100%) compared with the values for EMB (average,⫺78%; range, ⫺52% to ⫺89%) and PZA (average, 59%; range,
⫺39% to ⫺94%). In contrast, drug-resistant strains demon-strated a change in TMAP which was either a reduction of
[image:3.585.52.272.573.695.2]⬍25% or a slight increase over the values for the controls (range,⫹28% to⫺24%).
FIG. 1. Characteristic chromatogram and TMAPs of drug-susceptibleM. tuberculosisstrain H37Rv following 72 h of incubation with and without INH. (Top panel) Control, no INH; (bottom panel) INH (0.1g/ml). FU, fluorescence units.
FIG. 2. Percent change in TMAP following exposure to INH (0.1
g/ml) versus RIF (2.0g/ml) over time in drug-susceptibleM. tuber-culosisstrain H37Rv.
on May 16, 2020 by guest
http://jcm.asm.org/
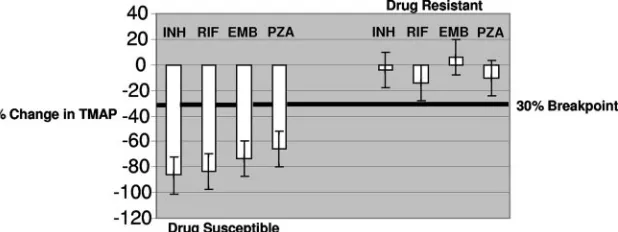
Several breakpoints ranging from 20% to 30% were exam-ined to determine which one provided the best agreement between the standard Bactec 460 susceptibility test method and HPLC. For each strain-antibiotic combination, the percent change in TMAP for each treated culture compared with that for the control culture was determined at 72 h and compared with the known susceptibility of that particular strain. Suscep-tibility was defined as a reduction in TMAP relative to that for the corresponding control of greater than or equal to break-points set at 20% or 30%. Strains exhibiting TMAP changes of less than or equal to the breakpoint (20% or 30) were defined as resistant. By using a 20% breakpoint, the concordances were 71%, 88%, 94%, and 82% for INH, RIF, EMB, and PZA, respectively. In contrast, the highest percent agreement for all drugs was obtained by using the 30% breakpoint, which re-sulted in 99.5% agreement for INH, EMB, and PZA and 98.7% agreement for RIF compared to the values obtained by the Bactec 460 susceptibility testing method. Figure 3 illus-trates the mean percent change in TMAP for all drug-suscep-tible and -resistant strains to each of the first-line agents ob-tained by use of the 30% breakpoint. With a total of 240 susceptibility tests, the overall concordance was 97.5%. Dis-cordant results indicating false susceptibility were observed for the following antibiotics: INH and EMB (one result each) and RIF (two results). False resistance was demonstrated for RIF and PZA (one result each). Intra- and interassay variabilities were assessed by testing the same strain (strain H37Rv) six times within the same day or individual replicates over 6 con-secutive days. For each culture the coefficient of variation was calculated on the basis of the ratio of the TMAP for the control cultures to the TMAP for the treated cultures. The overall precision was 13.4%. However, the precision did vary by drug (INH, 9.17%; RIF, 11.2%; EMB, 11.4%; PZA, 21.9%).
STR, a second-line antimycobacterial drug, was also evalu-ated by the TMAP-based method. The overall agreement was 93.3% between the standard Bactec 460 method and TMAP analysis, which was less than that observed for the first-line drugs at the corresponding time point of 72 h. Susceptibility to STR was correctly identified in all susceptible strains (n⫽38) by the TMAP method. However, STR resistance was not de-tected in 15 of 22 resistant strains. For each strain with dis-crepant results, a reduction in TMAP of ⬎30% (average,
⬃62.4%; range,⫺42% to⫺83%) was observed in each of two separate experiments. The reduction in the TMAP was similar
in STR-susceptible strain H37Rv (average,⬃88%). Resistance to STR (2.0 g/ml) was confirmed by both the Bactec 460 radiometric method and the agar proportion method. How-ever, differences in growth rates were observed between STR-susceptible strain H37Rv and the resistant strains producing discrepant results. Overall, these strains exhibited slower growth than drug-susceptible strain H37Rv, slowing an average of 54 GI units over 9 days (range,⫺38 to⫺386 GI units).
DISCUSSION
M. tuberculosisremains a major cause of morbidity and mor-tality globally, with an estimated 2 million deaths yearly due to active infection. This number continues to rise in light of a latently infected reservoir of approximately one-third of the world’s human population. Although there has been reported success in the treatment of TB through the use of directly observed therapy by utilizing a short course, noncompliance, among other factors, has led to the emergence of MDR and, recently, XDRM. tuberculosisstrains. In addition, diagnostic methods, in the cases of patients with sputum, smear-negative, or pulmonary or extrapulmonary disease, are slow, requiring days to weeks for diagnosis and susceptibility testing. This necessitates empirical therapy until susceptibility testing is completed, resulting in the potential dissemination of resistant MDR and XDRM. tuberculosisstrains to others in the popu-lation.
[image:4.585.139.448.70.186.2]A variety of susceptibility testing methods have been devel-oped forM. tuberculosis. The oldest and current standard is the proportion method. In this method, drug-free and drug-con-taining media are inoculated with known dilutions of the test organism and the subsequent ratio of the number of colonies on the free medium/number of colonies on the drug-containing medium yields an estimate of the proportion of drug-resistant organisms present in the sample. This method is not rapid, and its performance may require 3 to 6 weeks after recovery of the isolate in culture. Other broth-based suscepti-bility testing platforms, such as the semiautomated, radiomet-ric Bactec 460 system and the automated, nonradiometradiomet-ric Bactec MGIT (mycobacterial growth indicator tube) 960 sys-tem (Becton Dickinson), have mean turnaround times of 4.3 days (range, 3 to 10 days) and 7.3 days (range, 5 to 12 days), respectively (20). Molecular tests have also been used to de-termine resistance to many of the first-line drugs. These tests
FIG. 3. Mean percent change in TMAPs for all susceptible and resistantM. tuberculosisstrains to each first-line antibiotic by using a breakpoint of 30%. TMAP was determined for the treated versus the control cultures, and the percent change was calculated. INH, 0.1g/ml; RIF, 2.0g/ml; EMB, 2.5g/ml; PZA, 100g/ml.
on May 16, 2020 by guest
http://jcm.asm.org/
sequence the PCR-amplified products of target genes to detect the mutations responsible for resistance. Although they are potentially very effective, molecular tests are hindered by the presence of multiple drug resistance mechanisms for some antibiotics and resistant strains for which no molecular deter-minant of resistance has been identified. In addition, such tests are expensive, are technically demanding, and are likely be-yond the abilities if routine clinical laboratories at this time (1, 12).
In this study and others (10, 21), a clear, nearly linear cor-relation between TMAPs and the numbers of CFU/ml was demonstrated. As a result, it is possible to use TMAP values as a measure of CFU/ml without having to incubate cultures for up to 3 weeks by standard susceptibility testing methods. Ear-lier studies focused primarily on INH, RIF, or STR and re-quired 5 days of incubation before susceptibility could be as-sessed. In the current study, a standardized, time-dependent breakpoint was established for all drugs (INH, RIF, EMB, PZA, and STR) considered together. The extreme sensitivity of the analytical method enabled a definitive correlation to be obtained for all antibiotics at a uniform time point of 72 h and even earlier for isolated antibiotics, such as INH. Since the extraction procedure requires several steps and interpretation of the results relies on quantitative comparisons between con-trol and drug-treated cultures, care must be taken in sample processing. However, the use of the Sherlock software, which automates the operation of the instrument, in conjunction with improvements in the method, including less carryover com-pared with that described in previous reports (21), and the use of less noxious solvents (isopropanol versus methylene chlo-ride), enabled its routine use by technologists with little or no experience with HPLC.
Discernible differences in TMAP reductions were noted on the basis of the mechanisms of action of the individual drugs. For instance, our results demonstrated that a rapid decrease in TMAP occurred in as little as 20 min forM. tuberculosisstrains treated with INH. This is not surprising, since the INH-specific mechanism of action inM. tuberculosisis inhibition of mycolic acid synthesis. Thus, with a mycolic-acid specific inhibitor such as INH, the detection of significant differences in the numbers of CFU/ml is not necessary to detect susceptibility or resis-tance. However, for other drugs that do not directly target mycolic acid synthesis (RIF, STR, PZA) or that are bacterio-static (EMB), a significant difference in the numbers of CFU/ml is required to determine drug susceptibility by the TMAP method. This requires longer incubation times to max-imize differences in the numbers of CFU/ml. In this study, 72 h of incubation and a 30% breakpoint were the optimal TMAP testing parameters for all four first-line drugs (INH, RIF, EMB, and PZA) considered together. However, further im-provements in the method could target optimization of drug-specific incubation times and breakpoints. For instance, on the basis of the data generated in this study, the detection of INH susceptibility or resistance could be optimized at a 30-min incubation time, and that for RIF could be optimized at a 50-h incubation time. This would provide for the even more rapid detection of MDR M. tuberculosis by the TMAP method. MDRM. tuberculosisstrains are defined as those strains resis-tant to both INH and RIF. The ability to detect MDR M. tuberculosisin ⬍3 days would be a significant improvement
over currently available conventional methods, which require days to weeks to complete. During the delays inherent in con-ventional methods, inappropriate therapy is often adminis-tered, with no clinical improvement in the patient and with the possible dissemination ofM. tuberculosisto others in the pop-ulation.
The intra- and interassay precisions also varied by drug and ranged from 9.17% for INH to 21.9% for PZA. These drug-specific differences in precision may be related to the drug-specific mechanism of action of each drug and the rapidity with which a given agent killsM. tuberculosisin vitro. INH, which specif-ically targets mycolic acid synthesis and which is rapidly bac-tericidal, yielded reproducible differences in TMAP values, with a much narrower range in variation compared with those obtained with RIF, EMB, and PZA. PZA, for which the most variation in precision was observed, is a prodrug which re-quires conversion to pyrazinoic acid (POA) via the mycobac-terial nicotinamidase/pyrazinamidase (24). This conversion is necessary for PZA-mediated bactericidal activity against M. tuberculosis. Once it is converted to POA, it is excreted by the bacilli via a weak efflux pump. Due to the inefficiency of this efflux pump, the POA accumulates within the bacilli, resulting in cellular damage and death. The time required for the con-version of PZA to POA may vary between M. tuberculosis
strains. This variation may also be related to the inherently different growth rates observed betweenM. tuberculosisstrains in slightly acidic media (pH 6.0) (24). In this study, strain-to-strain variation in growth was not assessed. However, it is possible that such differences played a role in the increased amount of variation in the intra- and interday precision studies with PZA.
STR, once considered a first-line drug for the treatment of TB, has been transitioned to second-line status (15). We ex-amined the utility of the TMAP susceptibility testing method in correctly identifying STR susceptibility and resistance in mul-tiple strains of M. tuberculosis. Previous investigators have demonstrated that it was possible to detect differences in growth after 3 to 4 days of incubation in STR-exposed cultures ofM. tuberculosisusing mycolic acid analysis (14). It is impor-tant to note that the majority of the strains used in that study were susceptible to STR. In the present study, STR suscepti-bility was correctly identified in 42 of 42 (100%) susceptible strains. However, the TMAP method failed to detect STR resistance in 15 of 22 resistant strains. The molecular mecha-nism of STR resistance correlates closely with the in vitro activity of the drug (14). STR resistance is mediated by a number of factors, including mutations inrpsL, which encodes a ribosomal 30S gene (S12), andrrs, a 16S rRNA gene. Muta-tions inrpsLare associated with high-level resistance, whereas mutations inrrs are associated with intermediate resistance. Some STR-resistant strains have no mutations in either of these two genes and exhibit low-level resistance. These strains are thought to have altered membrane permeability to the drug, which contributes to resistance, since the use of mem-brane-active agents in combination with STR significantly in-creases susceptibility. Altered membrane permeability could also have a negative impact on the growth rate. In this study, all the STR-resistant strains producing discrepant results between the two methods exhibited slower growth relative to that of their STR-susceptible counterparts. The number of CFU/ml at
on May 16, 2020 by guest
http://jcm.asm.org/
a given time point would necessarily be lower for the more slowly growing strains, resulting in inaccurate TMAP results. Since the molecular mechanism(s) of STR resistance was not determined in this study, it is not possible to confirm whether these strains had a genotype consistent with that found in STR-resistant isolates for which altered membrane permeabil-ity is suspected.
Our data suggest that determination of the mycolic acid concentration by the TMAP method is a rapid and sensitive indicator of cell growth inhibition and death inM. tuberculosis
compared to the speeds and sensitivities of standardized sus-ceptibility protocols. Further studies are planned, including optimization of the testing parameters with first-line drugs, with extension to second-line agents, and feasibility studies with other testing platforms, such as the Bactec 960 MGIT system.
In summary, the TMAP method is a rapid, sensitive, and accurate method for testing the susceptibility ofM. tuberculosis
strains to all currently used first-line drugs. The results are obtained in 72 h, as opposed to the lengthy period required for conventional methods, leading to the more rapid identification of MDR and, possibly, XDRM. tuberculosis.
REFERENCES
1.Banaiee, N., M. Bobadilla-del-Valle, P. F. Riska, S. Bardarov, Jr., P. M. Small, A. Ponce-de-Leon, W. R. Jacobs, Jr., G. F. Hatfull, and J. Sifuentes-Osnorio.2003. Rapid identification and susceptibility testing of Mycobacte-rium tuberculosisfrom MGIT cultures with luciferase mycobacteriophages.
J. Med. Microbiol.52:557–561.
2.Blower, S. M., and T. Chou.2004. Modeling the emergence of the ‘hot zones’: tuberculosis and the amplification dynamics of drug resistance. Nat.
Med.10:1111–1113.
3.Butler, W. R., and L. S. Guthertz.2001. Mycolic acid analysis by
high-performance liquid chromatography for identification ofMycobacterium
spe-cies. Clin. Microbiol. Rev.14:704–726.
4.Butler, W. R., K. C., Jost, Jr., and J. O. Kilburn.1991. Identification of mycobacteria by high-performance liquid chromatography. J. Clin.
Micro-biol.29:2468–2472.
5.Centers for Disease Control and Prevention.2002. Global Tuberculosis. Proceedings of the Fourth National Conference on Laboratory Aspects of Tuberculosis. Centers for Disease Control and Prevention, Atlanta, GA. 6.Centers for Disease Control and Prevention.2006. Emergence of
Mycobac-terium tuberculosiswith extensive resistance to second-line
drugs—world-wide, 2000–2004. Morb. Mortal. Wkly. Rep.55:301–305.
7.Cohen, T., and M. Murray.2004. Modeling epidemics of multidrug-resistant
M. tuberculosisof heterogeneous fitness. Nat. Med.10:1117–1121. 8.Dooley, S., W. Jarvis, W. Martone, and D. E. Snider, Jr.1992. Multi-drug
resistant tuberculosis. Ann. Intern. Med.117:257–259.
9.Frieden, T., T. Sterling, A. Pablos-Mendez, J. O. Kilburn, G. M. Cauthen,
and S. W. Dooley.1993. The emergence of drug-resistant tuberculosis in New
York City. N. Engl. J. Med.328:521–526.
10.Garza-Gonzales, E., M. Guerrero-Olazaran, R. Tijerina-Menchaca, and J. Viader-Salvado.1997. Determination of drug susceptibility of Mycobacte-rium tuberculosisthrough mycolic acid analysis. J. Clin. Microbiol.35:1287– 1289.
11.Ghandi, N., A. Moll, A. Sturm, R. Pawinski, T. Govender, U. Lalloo, K. Zeller, J. Andrews, and G. Friedland.2006. Extensively drug-resistant tu-berculosis as a cause of death in patients co-infected with tutu-berculosis and
HIV in a rural area of South Africa. Lancet368:1575–1580.
12.Kapur, V., L. L. Li, M. R. Hamrick, B. B. Plikaytis, T. M. Shinnick, A. Telenti, W. R. Jacobs, Jr., A. Banerjee, S. Cole, S. Yuen, K. Y. Yuen, J. E. Clarridge, B. N. Kreiswirth, and J. M. Musser.1995. RapidMycobacterium
species assignment and unambiguous identification of mutations associated
with antimicrobial resistance inMycobacterium tuberculosisby automated
DNA sequencing. Arch. Pathol. Lab. Med.119:131–138.
13.Masjedi, M., P. Farnia, S. Sorooch, M. V. Pooramiri, S. D. Mansoori, A. Z. Zarifi, A. AkbarVelayati, and S. Hoffner.2006. Extensively drug-resistant
tuberculosis: 2 years of surveillance in Iran. Clin. Infect. Dis.43:841–847.
14.Meier, A., P. Sander, K.-J. Schaper, M. Scholz, and E. C. Bottger.1996. Correlation of molecular resistance mechanisms and phenotypic resistance
levels in streptomycin-resistant Mycobacterium tuberculosis. Antimicrob.
Agents Chemother.40:2452–2454.
15.National Committee for Clinical Laboratory Standards.2003. Susceptibility testing of mycobacteria, nocardia and other aerobic actinomycetes. Ap-proved standard M24-A. National Committee for Clinical Laboratory Stan-dards, Wayne, PA.
16.Pablos-Mendez, A., M. Raviglione, A. Laszlo, N. Binkin, H. L. Rieder, F. Bustreo, D. L. Cohn, C. S. Lambregts-vanWeezenbeek, S. J. Kim, P. Chaulet, P. Nunn, et al.1998. Global surveillance for anti-tuberculosis drug
resis-tance, 1994–1998. N. Engl. J. Med.338:1641–1649.
17.Park, M. M., A. L. Davis, N. W. Schluger, H. Cohen, and W. N. Rom.1996. Outcome of MDR-TB patients, 1983–1993. Prolonged survival with
appro-priate therapy. Am. J. Respir. Crit. Care Med.153:317–324.
18.Raviglione, M. 2006. XDR-TB: entering the post-antibiotic era? Int. J.
Tuberc. Lung Dis.10:1185–1187.
19.Siddiqi, S.1995. BACTEC 460TB system: product and procedure manual, sections IV and VI. Becton Dickinson, Sparks, MD.
20.Somoskovi, A., A. Clobridge, S. Larsen, O. Sinyavskiy, S. Surucuoglu, L. Parsons, and M. Salfinger.2006. Does the MGIT 960 system improve the turnaround times for growth detection and susceptibility testing of the
Myocbacterium tuberculosiscomplex? J. Clin. Microbiol.44:2314–2315. 21.Viader-Salvado, J. M., E. Garza-Gonzalez, R. Valdez-Leal, M.
Bosque-Moncaya, R. Tijerina-Menchaca, and M. Guerrero-Olazaran.2001. Mycolic
acid index susceptibility method for Mycobacterium tuberculosis. J. Clin.
Microbiol.39:2642–2645.
22.Wallace, R. J., Jr., B. A. Brown-Elliott, L. Hall, G. Roberts, R. W. Wilson, L. B. Mann, C. J. Crist, C. H. Sher, R. Dunlap, M. J. Garcia, T. Bagwell and K. C. Jost, Jr. 2002. Clinical and laboratory features ofMycobacterium mageritense. J. Clin. Microbiol.40:2930–2935.
23.World Health Organization/International Union Against Tuberculosis and Lung Disease.2000. Anti-tuberculosis drug resistance in the world. Report No. 2: the WHO/IUATLD global project on anti-tuberculosis drug resis-tance surveillance. Report WHO/CDS/TB/2000.278. World Health Organi-zation/International Union Against Tuberculosis and Lung Disease, Geneva, Switzerland.
24.Zhang, Y., and D. Mitchison.2003. The curious characteristics of
pyrazin-amide: a review. Int. J. Tuberc. Lung Dis.7:6–21.