2019 International Conference on Information Technology, Electrical and Electronic Engineering (ITEEE 2019) ISBN: 978-1-60595-606-0
Mobile Phone User Behavior Prediction Base on Multivariable Linear
Regression Model
Qing YANG, Pei-ling YUAN
*, Qing ZHANG and Shi-jue ZHENG
Department of Computer, Central China Normal University, Wuhan, China
*Corresponding author
Keywords: Multiple regression, Gradient descent, Application recommendation.
Abstract. With the development of the Internet industry and the smart phone industry, the amount of mobile application software is increasing and the variety is becoming more and more abundant. The ensuing question is how mobile users can choose the applications they are interested in among many mobile applications. Therefore, mobile application recommendation service for mobile phone users came into place. This paper takes mobile phone users as the starting point, uses multiple linear regression models, uses the commonly used least mean square to evaluate the error, and uses the batch gradient descent method to optimize the training analysis error. Through experiments on the usage data of a large number of mobile phone users, the relationship between gender, age, mobile phone model, mobile phone usage location and app category of the mobile phone user is analyzed, and the mobile phone user app category is predicted to personalized recommend apps for the mobile phone user.
Introduction
In recent years, with the rapid development of Internet and smart phones, mobile application market has been booming. According to App Annnie, in the second quarter of 2018, global app downloads and user spending reached new highs. The total number of apps downloaded by iOS and Google Play worldwide exceeded 28.4 billion, which is a 15% year-on-year increase. Surprisingly, this number only includes the first downloads and not include reinstallation or app updates. Facing a large number of a wide variety of apps, how mobile phone users choose their favorite applications in many mobile applications has become a problem, which worth a further discussion[1]. In response to the user's habits, daily preferences, actual needs, etc., the app is recommended for users in a variety of apps that are safe and reliable and in line with the user's interests. This is an important area of the current App recommendation system[2].
In 1870, British biologist statistician F. Galton introduced the concept of regression line and correlation coefficient when he studied the inheritance of human body length, and initiated regression analysis[3]. Wang Mingchen, Liu Hongming and others applied multiple regression to the analysis of the influencing factors of radiation pneumonitis around 2002 to guide the development of lung cancer treatment plans[4]. Olweny and Shiphod used multiple linear regression methods to analyze listed banks in order to analyze the business performance of commercial banks around 2011[5].
The multiple regression analysis prediction method is to establish a prediction model by correlation analysis of multiple independent variables and one dependent variable. When there is a linear relationship between the independent variable and the dependent variable, it is called multiple linear regression analysis [6]. Multiple regression analysis is widely used in many fields. In 2005, Flor A. Castillo and Carlos M studied the potential of symbolic regression generated by GP. In the case of industrial environment, a method for mitigating multiple collinearity in multiple regression was proposed[7]. VillaIgnacio Arnaldo, Krzysztof Krawiec, Una-May O'Reilly applied multiple regression to gene programming around 2014 and proposed a new method for performing genetic programs[8].
method to optimize the training that analyze the gender, age, mobile phone location, mobile phone model and app relationship to recommend the app for users.
Algorithm Design for Predicting Mobile Phone User Behavior
Establishment of Multivariable Linear Regression Model
There are many influencing factors in predicting mobile phones user behavior. The choice of independent variables is based on the principle of emphasis, comprehensiveness, quantifiability and controllability. It contains effective variables and does not contain invalid variables. In the mobile phone user behavior prediction, the user's gender, age, geographic location, mobile phone model and duration of use can be used as input to the regression analysis model.
This paper proposes the multivariate linear regression algorithm model to predict app category of mobile phone users according to main influencing factors. A linear model is fitted to the given training dataset, and then predict for the new users’ behavior.
Suppose the various input factors (gender, age and other factors affecting the behavior of mobile phone users)in the equation group is represented by X, output factors(mobile application software category) with Y, investigate the relationship between the 4 variable x1, x2, x3, x4 and variable y and
choose a total of N-sample test, each test data are (yi, x1i, x2i, x3i, x4m), i=1,2,..., N.
If y has the following linear relationship with x1, x2, x3, and x4:
y=β0+β1x1+β2x2+β3x3+β4x4+ε (1)
In the above formula, y is the dependent variable, xi(i=1,2,3,4) is the independent variable and x1,
x2, x3, x4 represent gender, age, mobile phone model, mobile phone usage location.
Batch Gradient Descent
In this paper, batch gradient descent is used to solve the regression coefficients of multiple linear regression equations. Batch gradient descent is the most commonly used form of gradient descent method, which is used to update all input samples when updating input parameters.
Algorithm-related parameter initialization: Initialize βi(i=1,2,3,4), algorithm termination distance
ε. In the absence of any prior knowledge, βi(i=1,2,3,4) is initialized to 0, and the learning rate α is 1,
which is optimized when it is tuned later. The main process of the algorithm:
1) Determine the gradient of the loss function of the current position. As for βi, the gradient
expression is as follows:
) , ,
( 0 1 n
J
i
(2) 2) Whether all the distance of gradient descent of βi (i=1,2,3,4) are less than ε. If they are less than
ε, then the algorithm terminates and all current βi is the final result, otherwise go to step 3.
3) Update βi (i=0,1,2,4), its update expression is as follows. Continue to step 1 after the update
completed.
) , ,
( 0 1 n
i
i J
i
(3)
Model Test
In practical problems, it is generally impossible to determine in advance whether there is a linear relationship between the dependent variable y and the independent variables x1, x2, ..., xm-1. Before
linear relationship between the dependent variable and the multiple independent variables must also be tested for significance. This paper uses the F test method.
Test whether there is a significant linear regression relationship between y and x1, x2, ..., xm-1, that
is, test the hypothesis:
(4) If H0 is true, then y=β0+ε, there is not linear regression relationship between y and x1, x2, ..., xm-1,
construct the following test statistic based on analysis of variance:
Ve V F R
(5)
In the above formula,
1
m S
V R
R ,
m n
S
V e
e , Y JY
n Y X
SR T T
1
,Se YTYXTY.
J represents an n-order matrix with an element of one. SR is the squares sum of regression ,
reflecting the median deviation of the linear fit values from their mean values, that is the fluctuation of yi( i=1,2,...,n) caused by the change of the variables x1, x2, ..., xm-1. The larger the SR, the greater
the proportion of the volatility of yi described by the linear regression relationship, that is, the more
linear the relationship between y and x1, x2, ..., xm-1. The degree of freedom of SR is m-1.
Se is the square sum of residuals, reflecting the data fluctuations caused by factors other than the linear relationship between y and x1, x2, ..., xm-1. The larger the Se, the larger the deviation between
the observed value and the linear fitting value. The degree of freedom of Se is n-m.
When H0 is true, F~F(m-1, n-m) can be proved. When H0 is false, the value of F has a tendency
to be large. Therefore, give the significant level α, check the F distribution to obtain critical value Fα
(m-1, n-m), calculate the observation value F0 of F. If F0<Fα(m-1, n-m), accepting H0 assumption,
that is, under the significance level α, the linear relationship is considered not significant; if F0≥Fα(m-1,n-m), rejecting H0, that is, there is a significant linear relationship between y and x1, x2,
..., xm-1.
Experimental Design
Data Introduction
The experimental data comes from the TalkingData SDK integrated in the mobile app, which serves the service period between TalkingData and mobile app developers. Full recognition and consent from individual user of those apps have been obtained, and appropriate anonymization have been performed to protect privacy. The user attribute data includes event records of the user using the mobile phone, such as download application, location information, application type, application event, etc., and the user's own attributes include gender and age. The data set records the usage time, usage location, app category, etc. of each application (with app_id as a unique identifier) for each user (with device_id as a unique identifier). The specific description is shown in Table 1.
Multiple Linear Regression Prediction for Mobile User Applications
The algorithm in this paper is programmed in python, and all experiments are run on the spyder3.0.2 (anaconda3) software under win7 system.
The data set has been standardized. In the experiment, 90% of the data samples of each category are used as the training data set, and 10% of the data samples are used as the test data set. Set y:app_id;x1:gender;x2:age;x3:device_id;x4:timestamp.Input the data samples into the multiple linear
regression model to derive the regression equation:
y=-0.447+0.603x1+0.762x2+0.059x3+0.210x4
independent variable x1 and the independent variable x2 have a greater effect on the dependent
variable y, and the independent variable x2 has the greatest influence on the predicted value y, and
the independent variable x4 has the least influence on y. That is, the user's age and gender are the
[image:4.595.71.517.149.288.2]key factors that determine the user's mobile app usage category.
Table 1. Description of test data of mobile phone users.
variable number variable name interpretation
1 device_id User's id (unique) of the mobile device
2 device_model Mobile phone specific model
3 app_id The ID of the app
4 category Types of apps: online shopping, games, etc.
5 gender User’s gender
6 age User’s age
7 longitude The longitude of the location where the user uses the phone
8 latitude The latitude of the location where the user uses the phone
9 timestamp Duration of time
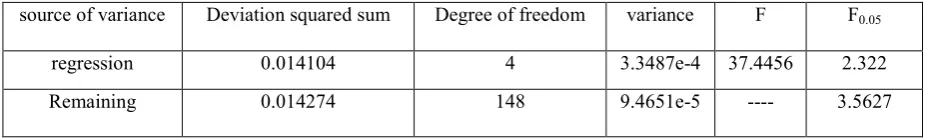
After the regression equation is fitted, the following problems need to be solved: (1) the metric of total effect of the equation given; (2) when the effect of the regression equation is significant, the significant regression test is performed on each regression coefficient, and the independent variables whose effects are not obvious are deleted to optimize the model; (3) the equation significance test is given to judge whether the regression equation is valid or not.
The regression square sum and SR and residual square sun and Se can be obtained by formula,
and the test statistic F can be obtained by formula, in which Fα is obtained by look-up table, and the
results are shown in table 2.
As can be seen from Table 2, since F = 37.4456 > F0.05 = 2.322, the linear regression is
significant.
Table 2. Results of regression variance analysis.
source of variance Deviation squared sum Degree of freedom variance F F0.05
regression 0.014104 4 3.3487e-4 37.4456 2.322
Remaining 0.014274 148 9.4651e-5 ---- 3.5627
Summary
In this paper, the multivariate linear regression model is used to predict the mobile app category. Because the multivariate linear test F=37.4456>=2.322, it is significant to use multivariate linear regression to analyze the prediction problem, which shows that it is effective and feasible to use multivariate regression designed in this paper to predict and analyze.
In actual situations, there are many factors that affect which type of mobile app users use. In this paper, the users’ attribute characteristics age, gender, usage time, and phone model are selected as dependent variables to predict application category. From the experimental calculation results of this paper, the age and gender of the user's own attributes have a relatively large impact on the use of mobile app. In this paper, the batch gradient descent method is used to solve the equation coefficients. When the sample are large, the training speed will be slower. In the future work, we plan to design more sophisticated method to solve the regression coefficients for multivariable Linear Regression Model.
Acknowledgement
[image:4.595.66.535.455.525.2]References
[1] Zen Guanyin. Research on Personalized APP Recommendation Algorithm Based on Permissions and Functions[D]. Wuhan University, 2017.
[2] Wang Qiudan. APP Recommendation Based on Distributed SVD and Databased Social Influence[D]. East China Normal University, 2017.
[3] Yu Zhongyi. Galton's Historical Review and Reflection on Relevant and Regression[J]. Statistics & Information Forum, 2009, 24(09):17-25.
[4] Wang Mingchen, Liu Hongming, etc. Multiple Regression Analysis of the Influencing Factors of Radiation Pneumonitis[J]. Chinese Journal of Radiation Oncology, 2003(S1):49-51.
[5] Olweny, T.; Shipho, T.M. (2011) Effects of Banking Sectoral Factors on the Profitability of Commercial Banks in Kenya [J], Economics and Finance Review 1(5):1–30.
[6] Qu Junhua. Multiple Regression Model Analysis and Design Implementation. China Electric Power Education, 2007(S1):140-142.
[7] Flor A. Castillo, Carlos M. Villa. Symbolic regression in multicollinearity problems[C]. New York : ACM, 2005: 2207-2208.