ISSN: 2147-611X
www.ijemst.com
Evaluating the (Mis)Alignment of the
Intended to the Assessed Curriculum for
the U.S.: Implications for the Common
Core State Standards for Mathematics
Pooja Shivraj
Southern Methodist University
To cite this article:
Shivraj, P. (2017). Evaluating the (mis)alignment of the intended to the assessed curriculum
for the U.S.: Implications for the common core state standards for mathematics.
International Journal of Education in Mathematics, Science and Technology
,
5
(4), 333-347.
DOI:10.18404/ijemst.18375
This article may be used for research, teaching, and private study purposes.
Any substantial or systematic reproduction, redistribution, reselling, loan, sub-licensing,
systematic supply, or distribution in any form to anyone is expressly forbidden.
Authors alone are responsible for the contents of their articles. The journal owns the
copyright of the articles.
Volume 5, Number 4, 2017
DOI:10.18404/ijemst.18375
Evaluating the (Mis)Alignment of the Intended to the Assessed Curriculum
for the U.S.: Implications for the Common Core State Standards for
Mathematics
Pooja Shivraj
Article Info
Abstract
Article History
Received: 29 January 2016
The Programme of International Student Assessment (PISA) has been administered to 15-year olds every three years since 2000. Since then, the U.S. has performed below average in mathematics, with no significant changes in performance. The objective of this study was to examine the alignment of the content students in the U.S. are assessed on in the PISA to the intended content standards for U.S. students (Common Core State Standards in Mathematics; CCSS-M). Alignment was analyzed using the Surveys of Enacted Curriculum (SEC) Alignment Model. Implications for implementing the CCSS-M were evaluated, and content topics that the CCSS-M needed to address in order for students in the U.S. to be prepared for the real-world were determined. It was found that while all content domains are addressed by both the intended and assessed curriculum (CCSS-M and the PISA, respectively), the assessed curriculum is not addressed with as much emphasis by the intended curriculum. The key concepts assessed on the PISA are also not addressed by the intended curriculum in the years proximal to taking the PISA. Implications for the CCSS-M and students in the U.S. are described based on results from this study.
Accepted: 11 October 2016
Keywords
Alignment Mathematics PISA CCSS-M Validity
Introduction
Most national and international educational organizations have revised or adapted their mathematical content standards to include applicability and generalizability of mathematics. The hope is that their students would develop critical mathematical skills and apply them beyond the school setting. For example, the Common Core State Standards for Mathematics (CCSS-M) describe practices that need to be developed in students that will help them for the future. These include processes such as problem solving, reasoning and proof, communication, representation, and connections, and proficiencies such as procedural fluency, conceptual understanding, strategic competence, and adaptive reasoning (National Governors Association Center for Best Practices [NGA] & Council of Chief State School Officers [CCSSO], 2010a). The large-scale international assessment, Programme for International Student Assessment (PISA), made mathematical literacy their basic theme for mathematics assessments as well (Organisation of Economic Cooperation and Development [OECD], 2003). They also included logical reasoning, problem solving, and the ability to think abstractly in everyday life as key components for students to be proficient in. Once skills such as these were part of most national and international standards, the implicit assumption was that failure to perform in these types of tasks specifically designed to assess success in everyday life would be considered a major setback in not only students’ futures, but also the nation’s future as a whole (Feuer, 2012).
the intended set of content standards for students in the U.S. (CCSS-M), in order to establish what the CCSS-M needs to address, if anything, in order for students in the U.S. to be prepared for the real world.
Programme of International Student Assessment (PISA)
The Programme of International Student Assessment (PISA) is a large-scale international assessment that was developed jointly by the OECD member countries as well as over 30 non-member countries/economies (OECD, 2013b). The purpose of the PISA is to measure the yield of different education systems, or how well students that are approaching the end of mandated education are prepared to meet challenges in the real world. For this reason, the PISA assesses 15-year olds not on the knowledge they possess, but on what they can do with the knowledge they possess. Between 4,500 and 10,000 students from approximately 150 schools from each country are tested every cycle to provide a range of student data. Students were first assessed using the PISA in 2000, and once every three years since then. During each of these cycles, there was a focus on one of three domains, called a major domain. Of the three domains assessed by the PISA – reading literacy, science literacy, and mathematics literacy – the major domain assessed by the 2012 PISA was mathematics literacy.
The mathematics content framework for the 2012 PISA was designed primarily using three components to form a matrix: content, process, and context. Four main content areas comprised the 2012 mathematics PISA framework, that included quantity, space and shape, change and relationships, and uncertainty and data. OECD (2013b) related these domains to curricular strands such as numbers, geometry, algebra, and probability and data analysis, respectively. Students are expected to use three cognitive processes within each of these content domains – formulate situations mathematically, employ mathematical concepts, facts, procedures, and reasoning, and interpret, apply, and evaluate mathematical outcomes. Each of the components within the content-by-process matrix is further tied into one specific context, creating a content-by-process-by-context matrix. There are four main contextual aspects in which students are assessed based on the world in which the student interacts with on a regular basis. The framework identifies these as personal, occupational, societal, and scientific.
Test items are sampled from this content-by-process-by-context matrix, and are about an equal combination of selected-response, closed constructed-response, and open constructed-response items (OECD, 2013b). From the assessment, OECD does not provide outcomes of individual student responses from the PISA; instead it provides two main types of outcomes from the PISA: (a) indicators that provide estimates of overall mathematical proficiency of students by country, where proficiency ranges from carrying out routine procedures (Level 1) to formulating arguments, interpreting, and generalizing data (Level 6), and (b) indicators that show performance for each country by process and by content domain (OECD, 2013b). The scores for the countries are scaled such that the scaled score has a mean of 500 and a standard deviation of 100 to allow for comparisons between countries beyond just the indicators mentioned above.
It is important to note that The 2012 mathematics PISA framework was brand new, and was developed with the idea that the assessment should reflect what students would have had the opportunity to learn while enabling them to extend their knowledge beyond their curriculum. Keeping this goal in mind, the standards of two sets of countries were analyzed: (a) nine OECD countries (Australia [New South Wales], [Flemish] Belgium, Canada [Alberta], Finland, Ireland, Japan, Korea, New Zealand, and the United Kingdom), and (b) six high performing countries ([Flemish] Belgium, Canada [Alberta], Chinese Taipei, Finland, Korea, and Singapore). The one criteria used was that the standards had to be in English. They used only the eleven unique countries to determine both what countries thought was important for students to be prepared and what common curriculum students had the opportunity to learn. Based on this, along with the judgment of mathematical experts, the content for the 2012 PISA mathematical framework was developed. It is key to note, however, that the framework “…intends to be illustrative of the content topics included in the PISA 2012, rather than an exhaustive listing…” (OECD, 2013b, p.36). Given the lack of the use of the U.S. standards to develop this framework, it was interesting to determine the alignmentof the standards used in the U.S. and the content used on the PISA.
Alignment
closely tied to the concept of gathering content-related validity evidence for an assessment, content validity being defined as how accurately the items on the assessment represent the specific construct in question, or how closely the assessment alignswith the standards (American Education Research Association [AERA], American Psychological Association [APA], & National Council for Measurement in Education [NCME], 2014). Content alignmentfollows a similar definition, referring to the degree to which two curricular documents have the same content coverage, or how closely two curricular documents align. Since introduced, this concept has been extended beyond standards and assessment to encompass the degree of agreement between any two instructional areas – standards, assessment, instruction (Vockley & Wang, 2009). Alignment can be determined using one of many alignment models. It is to be noted that these models do not answer the question of whether or not the frameworks or assessments align; instead, they answer the question of how much they align, or their degree of alignment (Bhola et al., 2003; Vockley & Wang, 2009).
Alignment is also useful when measuring opportunity to learn (OTL) on a large-scale (Vockley & Wang, 2009). While the term “opportunity to learn” has been defined using a multitude of definitions (Abedi, Courtney, Leon,
Kao, & Azzam, 2006; Herman, Klein, & Wakai, 1996; Herman & Klein, 1997; Kurz, Elliott, Wheby, & Smithson, 2010; Walberg & Paik, 2000), this study focuses on an extension of McDonnell’s (1995) definition of OTL. OTL, as defined by McDonnell (1995), is the alignment between the intended content (what is intended by the state/nation in their standards) and the assessed content (what is assessed on their tests) (Schmidt & Maier, 2009). Alignment is hence a powerful tool that can be used to provide evidence to support the underlying assumption of opportunity to learn because if two documents (e.g., standards) align well, a student that has had the opportunity to learn the content on one set of standards should theoretically have the opportunity to have learned the content on the other set of standards, if the intended content is implemented with fidelity. Also, not having the opportunity to learn the content assessed on the test relates to a negative aspect of fairness in testing since the end result of the assessment does not truly represent the test-taker’s ability (AERA, APA, NCME, 2014).
Purpose of the Study and Research Questions
The validity of the inferences made from the PISA scores are important because they influence the assessments’ intended uses, which are to “…measure the cumulative yield of different education systems…” (OECD, 2013b, p.14), and to “…make the well-known comparisons between mean performance levels between countries so that countries can serve as benchmarks for one another” (OECD, 2010, p.49). These inferences are based on the basic assumptions that the PISA represents content that students are exposed to. However, the 2012 mathematics PISA framework has been developed using the curricula of eleven countries, none of which include the U.S. (OECD, 2010). Although a tremendous amount of validity evidence has been collected to demonstrate the solidity of the PISA, a psychometrically sound test could still have misalignment of content pose as a threat to the fairness of the 2012 mathematics PISA for the U.S.
The purpose of this study is to investigate the alignment of the intended curriculum of the U.S. (CCSS-M) to the
assessed curriculum of U.S. students (2012 mathematics PISA) in order to evaluate implications for
implementing the CCSS-M in the future and to determine what the CCSS-M needs to address, if anything, in order for students in the U.S. to be prepared for the real world, which is one of the intended goals of the PISA. This purpose is explored using three research questions:
1. Proportion of Content and Proximity to Testing: Do the intended and assessed curriculum describe/assess content at similar/proportions? What is the proximity or timing of the major content domains being addressed within the intended content compared to when those major content domains are being assessed on the PISA?
2. Emphasis of Cognitive Process within Content Domain: What cognitive process is each content domain emphasized at in the assessed content? To what degree does the intended and assessed content align in their emphasis of cognitive process by content domain?
3. Breadth and Depth of Curriculum and Proximity to Testing: What percent of the overall assessed
curriculum is not addressed (lack of breadth) and under-addressed (lack of emphasis) by the intended
curriculum? What is the proximity or timing of addressing the intended curriculum compared to when the curriculum is being assessed on the PISA?
The 2012 mathematics PISA framework and the 2012 mathematics PISA items are used as part of the assessed
PISA framework is only “…illustrative of the content topics included in the PISA 2012, rather than an exhaustive listing” (OECD, 2013b, p.36) in order to focus on developing rich and challenging problems that model the real world as opposed to items that fall very specifically within a particular content domain. Together, analyzing the PISA framework and its items contributes an in-depth analysis towards the purpose of the study.
Methods
Alignment Tool
To investigate the alignment of the intended curriculum of the U.S. to the assessed curriculum of students in the U.S. on the PISA, the Surveys of Enacted Curriculum (SEC) Alignment Model was used. The SEC model was developed by Andrew Porter, Director of the Wisconsin Center for Education Research, and John Smithson from the University of Wisconsin-Madison, with assistance from the Council of Chief State School Officers and the help of several partner districts and states for the purpose of curriculum alignment studies at any grade level in English Language Arts (ELA), mathematics, and science (CCSSO, 2002; CCSSO, 2005; Porter, 2002). This model has been used to analyze the content and alignment of the standards, curriculum, and assessments in the three subject areas for more than 30 states.
The SEC content analysis methodology aligns enacted curriculum (what is taught) to assessed curriculum (what is assessed) (Porter, Polikoff, & Smithson, 2009). The model is a quantitative approach to alignment that involves the analyses of multiple documents by many raters coded specifically according to a two-dimensional matrix that uses a content-by-cognitive process to compare content standards at any grade level in mathematics, science, or ELA. The SEC model for mathematics consists of a 183 x 5 content-by-cognitive process matrix. The 183 content categories are generated from 16 coarse grain mathematics topics, which are sub-divided into between 4 and 19 fine-grain topics. Together, the 183 content categories form the rows of the matrix while the cognitive process categories form the columns of the matrix. The complete SEC mathematics tool with each of the 183x5 content by cognitive process categories can be found on the website listed in Porter (2002).
Intended Curriculum and Assessed Curriculum
Common Core State Standards for Mathematics (CCSS-M)
2012 Mathematics PISA Framework and 2012 Mathematics PISA Items
The 2012 PISA framework is described in depth by OECD’s technical documentation (OECD, 2013b). The specific content topics provided are said to be illustrative of the content provided in the PISA rather than an exhaustive list of everything they could possibly assess. Access to the PISA 2012 mathematics items were obtained by submitting a proposal to the PISA Governing Board (PGB). Of the 109 items listed electronically on the 2012 PISA dataset, only 97 were available for viewing. Since all 97 items were administered to students in the U.S., these items, along with the 2012 PISA framework, were considered to be the assessed curriculum
for the U.S.
Alignment Procedures
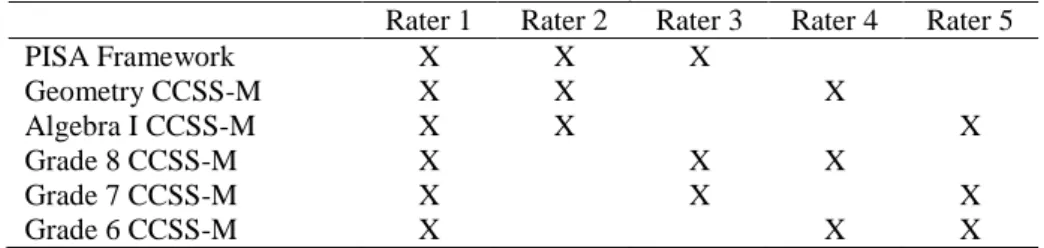
A total of six frameworks – 5 CCSS-M and one PISA framework – were coded independently by 3 content analysts each, based on the 183 x 5 SEC tool (CCSSO, 2005). The distribution of content analysts to frameworks can be seen in Table 1. The content analysts had both teaching and research experience with middle and high school mathematics. The Algebra I and Geometry frameworks for the CCSS-M were retrieved from http://www.corestandards.org/assets/CCSSI_Mathematics_Appendix_A.pdf (CCSSO, 2010c). Prior to coding, all analysts were trained on the tool to ensure consistency in coding. Each standard within each framework was coded based on the content and cognitive process it described. Each standard was assigned 1 point.
Table 1. Distribution of content analysts to frameworks
Rater 1 Rater 2 Rater 3 Rater 4 Rater 5
PISA Framework X X X
Geometry CCSS-M X X X
Algebra I CCSS-M X X X
Grade 8 CCSS-M X X X
Grade 7 CCSS-M X X X
Grade 6 CCSS-M X X X
A numerical proportion was generated for the content domain based on what was encompassed by the standard. The proportion was also split (if needed) based on the cognitive process(es) encompassed within the standard. For example, in the 6th grade CCSS-M standard, “Reason about and solve one-variable equations and
inequalities”, the standard describes the content area of Basic Algebra at both a Performing Procedures and an
Analyze cognitive process. It was hence coded as receiving 1 point for the Basic Algebra content domain, which
was split into .5 point for each of the cognitive processes within the content domain. This example is shown in Table 2. Table 2 may be an oversimplification, since the procedures included coding the 183 fine-grain topics as opposed to the 16 coarse-grain topics, which are depicted in the rows of the Table. However, the Table is used for guidance and procedures for coding the fine-grain topics remain the same.
Table 2. Example coding of one standard, grade 6 CCSS-M Memorize
Facts
Perform Procedures
Demonstrate Understanding
Analyze Make
Connections Measurement
Basic Algebra .5 .5
Geometry …
After each of the frameworks were completely coded independently by the three raters, consistency amongst the three content analysts was accounted for by averaging each of the cell within the 183 x 5 matrix to create one coded framework for each document. Using the example in Table 2, if all raters had the same numbers in each cell for the Grade 6 CCSS-M framework, the final coded framework for the Grade 6 CCSS-M averaged across the three raters would be the same. However, if one rater coded the same standard used in the example above as completely Performing Procedures (1 point), and the other two raters agreed that it was only half Performing
Procedures, the Basic Algebra-Perform Procedures cell will have an average of (.5+.5+1)/3 as opposed to .5 (if
all raters agreed). Similarly, the Basic Algebra-Analyze cell will have an average of (.5+.5+0)/3 as opposed to .5 (if all raters agreed).
depiction of the balance of representation, as described in the SEC methodology. This avoids skewing interpretation when some frameworks or documents have many more standards than other frameworks. For example, since the Algebra I framework consisted of 69 standards, each proportion within the matrix was divided by 69 to obtain a balance of representation of content.
The following alignments were performed:
1. CCSS-M Geometry with the 2012 mathematics PISA framework
2. CCSS-M Algebra I and Geometry with the 2012 mathematics PISA framework
3. CCSS-M Grade 8, Algebra I, and Geometry with the 2012 mathematics PISA framework
4. CCSS-M Grade 7, Grade 8, Algebra I, and Geometry with the 2012 mathematics PISA framework 5. CCSS-M Grade 6, Grade 7, Grade 8, Algebra I, and Geometry with the 2012 mathematics PISA
framework
As stated earlier, the CCSS-M were cumulatively analyzed for degree of alignment since the research question posed the issue of what the CCSS-M needs to address at any point in time before students in the U.S. take the PISA in order for them to be better prepared for the real world. The five alignments listed above were repeated for the 2012 PISA items to make a total of ten alignments. Since alignments 2-5 represent cumulative intended content within the standards documents, the matrices were first averaged across raters within a grade level. Next, these matrices were averaged across grade levels. Finally, this matrix was divided by total number of objectives between the grade levels to obtain the proportion for each cell in the matrix, representing the cumulative content the objectives described between the grade levels. For example, after the analysts coded CCSS-M for Algebra I and Geometry individually, the proportion of codes was averaged between the raters for each grade level to create one average matrix per grade level. Each cell across the average matrices of Algebra I and Geometry was obtained to determine the number of objectives in each content domain, and then divided by the total number of objectives contained in Algebra I and Geometry to obtain the proportion each document assessed. This matrix was then aligned to the PISA framework. Alignments 3-5 were done similarly, and then repeated for the PISA items.
Alignment and Misalignment Calculations
The proportion of content categories described on the 2012 PISA items, the 2012 PISA framework, and the CCSS-M frameworks was calculated for all coarse-grain categories. The five content categories with the largest focus on the 2012 PISA were compared with the CCSS-M, and differences in cognitive process associated within each content category were also calculated and graphed. Both of these provided information on the first two research questions about the proportion of content and its proximity to testing, as well as the emphasis of cognitive process within each content domain. These also addressed questions of alignment of content and cognitive domains.
A more in-depth analysis of where misalignments occurred, and the proximity of concepts being addressed within the intendedcontent compared to when the content was being assessed on the PISA was also performed to address the third research question of breadth and emphasis of content and its proximity to testing. Lack of breadth on the CCSS-M, or unaddressed content on the CCSS-M, was defined as content addressed by the 2012 PISA framework/items is not addressed by the CCSS-M that it is being aligned with. Lack of emphasis on the CCSS-M, or under-addressed content, was defined as content is addressed by both the 2012 PISA framework/items and by the CCSS-M that it is being aligned with, but is addressed at a lower proportion by the CCSS-M. To determine whether the content on the 2012 PISA framework and items was being unaddressed or under-addressed by the CCSS-M, two (mis)alignment calculations were performed and graphed: (a) percent of the PISA that is unaddressed by the CCSS-M, (b) percent of the PISA that is under-addressed by the CCSS-M. The formula below was used for both the misalignment calculations:
Misalignment % = sum from {n=1} to i {|(xi– yi)|/2} * 100%
Here, xiindicates each individual cell in the 183 x 5 matrix of the PISA framework/items and yiindicates each
individual cell of the CCSS-M matrix. The PISA content was considered unaddressed by the CCSS-M when xi
> 0 and yi= 0. The percent of the PISA content unaddressed by the CCSS-M was calculated using the formula
above by finding cells where xi> 0 and yi= 0 (standards that are assigned to a content/cognitive process cell
where xi> 0 and yi< xi, including cells where yi= 0 (standards that are assigned to a content/cognitive process
cell within the PISA, but are not described in the CCSS-M or are not described with as much emphasis within the CCSS-M). For example, if for one content domain, the CCSS-M has a relative emphasis of .15 and PISA has a relative emphasis of .25, the difference of the two would be considered under-addressed as opposed to the full .25.
Results and Discussion
Proportion of Content and Proximity to Testing
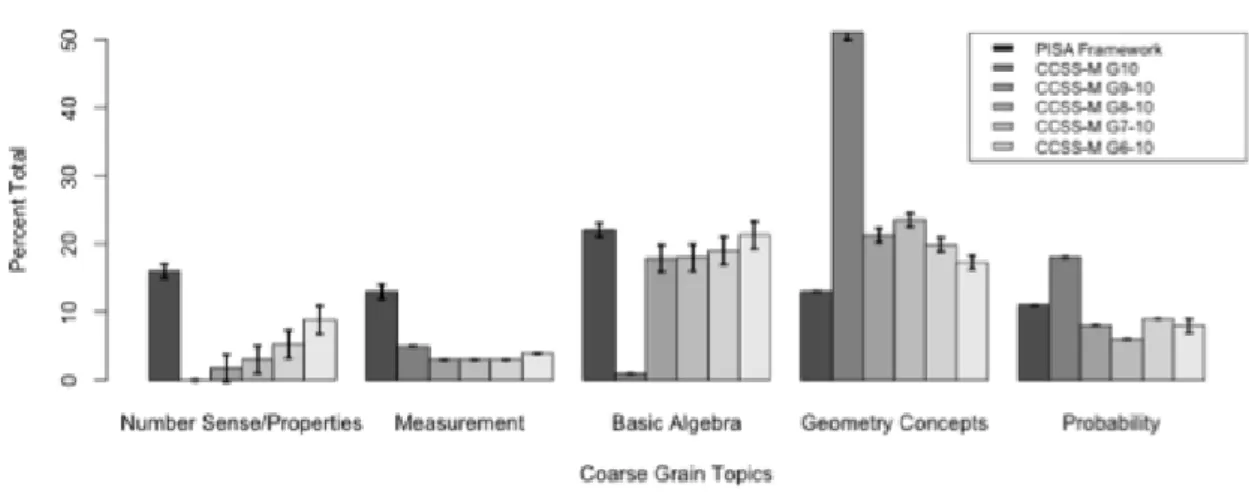
The proportion of content categories described on the 2012 PISA items, the 2012 PISA framework, and the CCSS-M frameworks was calculated for all coarse-grain categories. Fine-grain categories are not reported due to the sparse matrix within the coarse-grain categories for each framework. The five coarse-grain categories with the largest focus on the 2012 PISA framework are graphed in Figure 1, and the proportion of the CCSS-M that describes those content categories are compared for the five alignments. The error bars in the Figure show differences in content analysts’ ratings on proportions of content. The five content categories with the largest focus on the 2012 mathematics PISA framework were Number Sense and Properties, Measurement, Geometry, Basic Algebra, and Probability.
Figure 1. Top content assessed: 2012 math PISA framework
Properties and Measurement domains proportionally, even if these content areas are addressed implicitly within their standards.
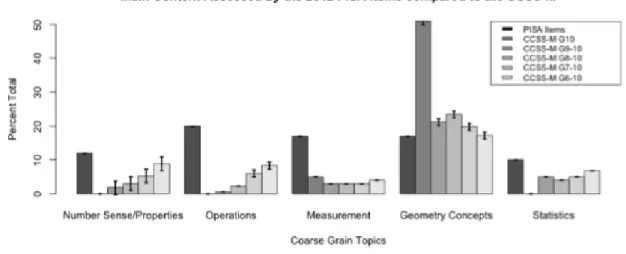
The five coarse-grain categories with the largest focus on the PISA 2012 items were also graphed in Figure 2, and the proportion of the CCSS-M that describes those content categories are compared for the five alignments. The five content domains with the largest focus on the 2012 PISA items were Number Sense and Properties, Measurement, Operations, Statistics, and Geometry. From Figure 2, it can be seen that the Number Sense and Properties, Operations, and Statistics domains are not addressed by the CCSS-M the year the students in the U.S. are supposed to take the PISA. These content topics cover over 40% of the assessment. Measurement is addressed the year students take the PISA, but with about a third of the emphasis. The proportions indicate that the CCSS-M do not cover any of these four content domains with as much emphasis as what the 2012 PISA items assess. These four domains make up over half of the items on the 2012 PISA. The trends in the Number Sense and Properties and Measurement content domains run parallel to what is observed in the alignment with the 2012 PISA framework. Also, similar to the trend seen on the 2012 PISA framework, the proportion of CCSS-M that focus on Geometry concepts the year students take the PISA is almost three times higher than what is assessed by the 2012 PISA items. The focus the CCSS-M gives Geometry concepts is also always higher than the focus the 2012 PISA items places on it all the way from middle school (Grade 6) on, parallel to the trend seen with the 2012 PISA framework.
Figure 2. Top content assessed: 2012 math PISA items
Emphasis of Cognitive Process within Content Domain
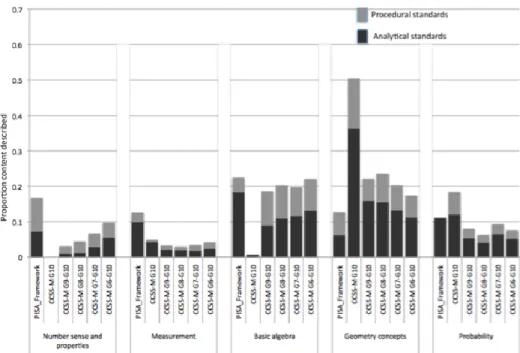
Each of the content domains in Figure 1 were sub-divided into the proportion of cognitive process they describe based on the SEC tool. Since both the PISA and the CCSS-M categorize the memorization and procedural skills of the SEC tool as one cognitive process, the first two cognitive process categories of the SEC tool were combined into a single category after coding called “procedural” standards. Since the three latter cognitive processes of the SEC tool demonstrated significant overlap with the cognitive process categories of the PISA and the CCSS-M, these were all categorized into a single category after coding called “analytical” standards. This is graphed in Figure 3.
Figure 3. Top content assessed by cognitive process: 2012 PISA framework
The 2012 PISA items were also similarly sub-divided into the proportion of cognitive process they assess based on the SEC tool, and the items within each domain were combined into two broad categories: (a) items that assessed purely memorization and procedural tasks, and (b) items that assessed understanding, analyzing, and making connections between concepts. This is graphed in Figure 4.
Figure 4. Top content assessed by cognitive process: 2012 PISA items
other three content domains, which have fewer items that align with performing memorization and procedural tasks.
Breadth and Emphasis of Curriculum and Proximity to Testing
The percent of content unaddressed (where the content addressed by the 2012 PISA framework/items is not addressed by the CCSS-M that it is being aligned with) and under-addressed (where the content is addressed by both the 2012 PISA framework/items and by the CCSS-M that it is being aligned with, but is addressed at a lower proportion by the CCSS-M) by each of the CCSS-M compared to the 2012 PISA were computed and are shown in Table 3. The percent of content unaddressed by the intended curriculum in comparison to the assessed curriculum represents its lack of breadth, whereas the percent of content under-addressed by the intended curriculum in comparison to the assessed curriculum represents its lack of emphasis. It is to be noted that the percent of content unaddressed and under-addressed are not mutually exclusive, since the lack of emphasis within a content domain arises after the lack of existence of content within the framework.
Table 3. (Mis)alignment between 2012 Math PISA and CCSS-M % of Framework
Unaddressed (Lack of Breadth)
% of Framework Under-Addressed (Lack of Emphasis)
% of Items Unaddressed (Lack of Breadth)
% of Items Under-Addressed (Lack
of Emphasis)
Geometry 48% 70% 58% 74%
Algebra-Geometry 8% 50% 27% 62%
Grade 8-Geometry 2% 46% 21% 60%
Grade 7-Geometry 0% 43% 1% 53%
Grade 6-Geometry 0% 41% 0% 49%
Although more than half the content (~52%) described on the 2012 PISA framework is not described by the CCSS-M the year the students are supposed to take the PISA (since the focus in on Geometry in 10th grade), cumulatively, the two years before students in the U.S. are supposed to take the PISA, about 92% of the content described on the PISA framework is addressed by the CCSS-M. Overall, the four years before students take the PISA, the CCSS-M cumulatively addresses all the content described by the 2012 PISA framework, hence covering the breadth of the content described on the PISA framework. The breadth of content cannot be visualized in Figure 3 shown since only the top 5 categories interacting with their cognitive domains that are described on the PISA framework are depicted.
Emphasis within curriculum was also investigated. Although the CCSS-M addresses over 90% of the content on the 2012 PISA framework the two years before students are supposed to take the mathematics PISA, about half of the total content described on CCSS-M is not covered with as much emphasis as it is on PISA framework. Similarly, about 43% of the total content remains under-addressed cumulatively the four years before students in the U.S. take the PISA although the breadth of the content described on the PISA framework is addressed by the CCSS-M during those years.
Also, with respect to the items, Table 3 shows that although about 60% of the content assessed by the 2012 PISA items is not covered by the CCSS-M the year the students are supposed to take the PISA (since the focus in on Geometry in 10th grade), cumulatively, the two years before students in the U.S. take the PISA, about 75% of the content assessed is addressed by the CCSS-M. Overall, the five years before students are supposed to take the PISA, the CCSS-M cumulatively represents all the content assessed by the 2012 PISA items, hence covering the breadth of the content assessed on the 2012 PISA items. With regards to emphasis, the two years before students take the PISA, although the breadth of the CCSS-M addresses about 75% of the content assessed by the PISA items, more than half of the total content described on CCSS-M is not covered with as much emphasis as it is on PISA items. Similarly, about half the total content remains under-addressed cumulatively the five years before students in the U.S. are supposed to take the PISA although the breadth of the content assessed by the PISA items is addressed by the CCSS-M during those years.
Conclusions
The purpose of this study is to investigate the alignment of the intended curriculum of the U.S., the CCSS-M, to
the assessed curriculum of the U.S. students, the 2012 mathematics PISA, in order to evaluate the implications
students in the U.S. to be prepared for the real world. This purpose was explored using three research questions relating to the alignment of the proportion of content on the assessment, the emphasis of the cognitive process within each content domain, and the breadth and emphasis of the curriculum. This section summarizes and interprets the findings of the study with possible explanations to those interpretations provided. Next, implications of the study are described with respect to the validity of the interpretations of the PISA and towards policies stemming from the study. Finally, limitations of the study are detailed and future directions for researchers are provided.
Summary of Findings and Implications
In terms of the top five content domains assessed by the 2012 PISA framework (Figure 1) and PISA items (Figure 2), evidence suggests that the CCSS-M has proportionally less content in the Measurement domain (less than 5%), the Number Sense and Properties domain (less than 4%), and the Operations domain (less than 3%) in the three years prior to taking the PISA, even if these content domains are addressed implicitly within their standards. Since about half the PISA items focus on these three content domains, and 30% of the PISA framework focus on the first two content domains, it is likely that students in the U.S. could struggle with these concepts on the PISA assessment if the intended curriculum is enacted the way it currently exists with fidelity in the future.
Figure 4 shows that while most domains on the CCSS-M have a similar focus on cognitive process compared to the PISA items, the Number Sense and Properties and Operations domains have a larger focus on procedural skills in the CCSS-M at all grade levels that they are described than what is assessed on the 2012 mathematics PISA items. Since teaching for and assessing higher-order thinking were found to be two of the top five variables positively associated with improved student achievement (National Center for Education Statistics [NCES], 1996) and the CCSS-M has a small focus on higher-order cognitive process skills on what seems to be a large focus on the PISA, this finding could have implications for the enactment of the intended curriculum. Key concepts, such as Number Sense and Properties and Operations are addressed in earlier years and not in close proximity to the timing of the PISA. The evidence in Table 3 demonstrates that the four to five years before students take the PISA, the CCSS-M cumulatively addresses all the content described by the 2012 PISA framework and items. However, the proportion of content covered by the CCSS-M compared to the PISA provides a different story since 41% of the 2012 mathematics PISA framework and 49% of the 2012 mathematics PISA items remains under-addressed by the CCSS-M. This could be because the CCSS-M still does not do a thorough job of addressing the “mile-wide and an inch-deep” curricula of the U.S., although they were designed specifically to address this problem (NGA & CCSSO, 2010b). Also, since the items are more reflective of the assessment in the case of the 2012 mathematics PISA, evidence shows that the year the students in the U.S. are supposed to take the PISA (Grade 10), the content that makes up over 50% of the PISA items is not addressed by the CCSS-M. While this seems unrealistic anyway, retention of content over a period of four to five years for students in the U.S. in order for them to be better prepared for the real world seems equally unrealistic. This brings us to the question of whether we should be modifying the CCSS-M to match what the PISA assesses, and whether we, as a country, should be “teaching to the test”.
On the one hand, the PISA does not just assess whether students can reiterate what they have learned but also examines how well they can generalize their knowledge to unfamiliar settings. This approach to assessment mirrors the fact that post-graduation, individuals are sought after not simply for the knowledge they possess, but for what they can do with the knowledge they possess. While this would serve as one of the hopes of how students utilize their skills, holding the PISA framework as the gold standard and/or modifying the CCSS-M is not the end goal; instead, bringing the CCSS-M into closer alignment with the PISA framework and the items based on the results of this study could be more helpful for the U.S., both in terms of rising in ranking on the PISA and for using mathematics in everyday life. The results show that the CCSS-M are describing all the content assessed on the PISA items, but are proportionally focusing less on domains, such as Number Sense and Properties and Measurement, and also focusing more on the procedural parts to the mathematics than the extensions of those standards to the real world.
and Measurement concepts, and concepts that students are bound to use beyond school and extend these to real-world situations, given the strong positive association between higher-order thinking skills and student achievement demonstrated by NCES (1996). It would be every teacher’s responsibility to ensure that these concepts were extended to real-world contexts, and analytic, reasoning, and justification skills of students were challenged, given that they are built into the expectations for application and the Standards for Mathematical Practice (NGA & CCSSO, 2010b). In essence, the depth and emphasis of varying content areas of the CCSS-M needs to be further addressed for students in the U.S. to have better shaped real-world skills.
Limitations and Possibilities
As with any study, there were several limitations with regard to the assumptions made and the tool used that could compromise the validity of the interpretations made from it. One of the limitations is the assumption that the CCSS-M is the intended curriculum of students all across the U.S. since the CCSS-M has only been implemented in 90% of the states, and assessments aligned with the CCSS-M have not yet been implemented. Also, generalizations of the CCSS-M as the enacted curriculum is unreasonable from this type of study since the fidelity and regularity of implementation may always be questionable in terms of changing professional development programs in different states to familiarize teachers with the CCSS-M, changing curricular materials that align with the CCSS-M, etc. (Center on Education Policy [CEP], 2011). In terms of implications, the interpretations of the study may not change drastically if the alignment between the state standards and the CCSS-M shown in prior studies (Achieve, 2010a; Achieve, 2010b) were representative of what students are learning in all states. On the other hand, if the CCSS-M did not represent what students were learning in all states, which is probably more likely the case given different states’ issues with adopting the CCSS-M, the poor performance observed on the mathematics PISA could possibly be attributed to students’ opportunity to learn the content on each of their states’ individual content standards, which was not investigated in this study. In this case, investigating the CCSS-M when implemented as the enacted curriculum would provide better direction to the study. Also, there does not seem to be documented evidence on whether the content on the CCSS-M was actually taught within the classrooms prior to 2012. This was not investigated in this study and was outside the scope of the interpretations.
Another limitation of the study was that since only explicit content was coded within both the standards and items, implicit content such as Measurement and Number Sense and Properties that may have been covered at all grade levels within the CCSS-M were not coded for. However, since these procedures were consistently used across all frameworks (all CCSS-M and the 2012 PISA framework) and the 2012 PISA items, the results obtained within the study would not have been skewed or biased, and the implications that are generated from the study would not have been significantly affected.
An assumption made during alignment is that the count of the standards on the CCSS-M corresponds to the importance the authors place on each topic. While this is partially addressed in the context of the PISA since both the PISA framework and its items are analyzed (and the count of items on the assessment presumably represent the importance of each topic), the limitation of the methodology may need to be investigated further. A last limitation involving coding of the CCSS-M was that the Standards for Mathematical Practice, or the processes and proficiencies within the CCSS-M, were not coded so it would be impossible to draw precise conclusions about how the content standards would be implemented with respect to how the CCSS-M content was coded. On the flip side, unless teachers are observed to specifically determine fidelity of implementation of the CCSS-M, Standards for Mathematical Practice would not be possible to code. As stated earlier, this was not investigated and was outside the scope of the study.
Based on these findings and limitations, a number of future analyses would prove useful within the theoretical framework used in this study. First, it would be important to study whether alignment is higher in countries with higher performance on the PISA, or whether it varies at all, in order to make generalizations with this study. It would also be interesting to note the scores of countries that have alignments (or misalignments) similar to those of the U.S.
made when making high-stakes decisions since alignment studies can only help describe the relationship between components within the study (standards/items), and not the quality of them (Newton & Kasten, 2013). Third, the framework of this study can be used to investigate not only other literacy components assessed by the PISA, but also other national and international assessments as well. For example, the U.S. Department of Education has funded two major consortia to develop assessments that are aligned to the CCSS-M, whose items may provide a deeper insight into this type of study. It would also be insightful to delve deeper into the study once the CCSS-M are fully implemented to determine changes in alignment, especially to evaluate if (mis)alignment could be a potential factor in poor performance on the PISA.
Lastly, the alignment tool and this type of framework could not simply be used to determine alignment, but to guide the process of item writing in these assessments and then determine whether the assessments are assessing higher-level concepts being taught and/or described in the CCSS-M. Similarly, assessments like the NAEP and TIMSS that show that the U.S. is making progress can be analyzed by determining whether ranking differences can be attributed to the content or cognitive process at which they are being assessed.
Concluding Remarks
This alignment study was intended to provide information to policymakers in the U.S. on the strengths of the 2012 mathematics PISA framework and items. It was also intended to highlight potential areas in which the CCSS-M areas could be improved upon to prepare students in the U.S. for the real world. The results suggest that the breadth of the CCSS-M addresses the content on both the 2012 mathematics PISA framework and the 2012 mathematics PISA items. The emphasis of content of the CCSS-M compared to the PISA is lacking. Also, the proportion of content addressed on the intended U.S. curriculum compared to a large portion of the assessment (Number Sense and Properties, Operations, and Measurement) is smaller. The cognitive process to which majority of the standards in those particular content domains are described on the CCSS-M are also relatively more procedural compared to the items on the PISA which are mostly analytic. All these findings, particularly emphasis and depth of curriculum and proximity of intended content to when it is assessed on the PISA, are areas for the CCSS-M to address in order for students in the U.S. to be better prepared for the real world.
The U.S. ranked 26 of the 34 OECD countries on the 2012 mathematics PISA, of which over a fourth of the students were not able to reach the baseline level of mathematics proficiency, and less than 2% reached the highest level of mathematics proficiency (OECD, 2013b). It is surprising that the U.S. is not performing as desired on the 2012 mathematics PISA, given that 12% of the variance in mean mathematics scores is explained by per capita GDP, and the U.S. ranks third (after Luxembourg and Switzerland) in the amount they have available to spend on education compared to the other OECD countries. One of the main factors that has been proposed for why this may be the case on the 2012 mathematics PISA is that 15% of the variation in the U.S. students' performances are explained by their socioeconomic status, contrasting with less than 10% in countries such as Finland, Korea, and Japan. This study does not use the lack of alignment of the assessed and the intended curriculum as the reason why the U.S. ranks low on the 2012 mathematics PISA but instead provides another possible explanatory variable that could help the U.S. better interpret their rankings on the PISA in the future.
Finally, it is to be noted that results from these studies cannot offer researchers and policy makers information about the quality of their education system or standards, or the solution about what to do when a country performs poorly on an international assessment, so follow-up studies on the implementation of the CCSS-M should be performed in order to better understand the extent to which the content in the standards are being extended to real-world applications.
Acknowledgements
References
Abedi, J., Courtney, M., Leon, S., Kao, J., & Azzam, T. (2006). English language learners and math achievement: A study of opportunity to learn and language accommodation (CSE Report 702, 2006). Los Angeles, CA: Center for the Study of Evaluation/National Center for Research on Evaluation, Standards, and Student Testing.
Achieve. (2010a). A comparison of the Arkansas mathematics standards to the Common Core State Standards in Mathematics. Report generated by Achieve Common Core Comparison Tool website at http://www.ccctool.achieve.org
Achieve. (2010b). A comparison of the Georgia mathematics standards to the Common Core State Standards in Mathematics. Report generated by Achieve Common Core Comparison Tool website at http://www.ccctool.achieve.org
American Educational Research Association, American Psychological Association, & National Council for Measurement in Education. (2014). Standards for educational and psychological testing (2nd ed.). Washington, DC: American Educational Research Association.
Bhola, D. S., Impara, J. C., & Buckendahl, C. W. (2003). Aligning tests with states’ content standards: Methods and issues. Educational Measurement: Issues and Practice, 22(3), 21-29.
Center on Education Policy. (2011). States’ progress and challenges in implementing Common Core State Standards. Washington, DC: Author.
Council of Chief State School Officers. (2002). Models for alignment analysis and assistance to states. Paper prepared by the Council of Chief State School Officers. Washington, DC: Author.
Council of Chief State School Officers. (2005). Surveys of Enacted Curriculum: A guide for SEC collaborative state and local coordinators. Paper prepared by the Council of Chief State School Officers. Washington, DC: Author.
Feuer, M. J. (2012, March). Validity issues for international large-scale assessments: Truth and consequences. Paper presented at Educational Assessment, Accountability, and Equity: Conversations of Validity Around the World in New York, NY.
Herman, J., & Klein, D. (1997). Assessing OTL: A California example. Los Angeles, CA: National Center for Research on Evaluation, Standards, and Student Testing.
Herman, J. L., Klein, D, and Wakai, S. T. (1996). Assessing equity in alternative assessment: An illustration of
opportunity-to-learn issues (Rep. no. 440). Los Angeles, CA: University of California.
Juneau, D. (2011). Common Core State Standards and Montana standards analysis report. Helena, MT: Montana Office of Public Instruction.
Kurz, A., Elliott. S. N., Wheby, J. H., & Smithson, J. L. (2010). Alignment of the intended, planned, and enacted curriculum in general and special education and its relation to student achievement. Journal of
Special Education, 44(3), 1-20.
McDonnell, L. M. (1995). Opportunity to learn as a research concept and policy instrument. Educational
Evaluation and Policy Analysis, 17, 305-322.
National Center for Education Statistics. (1996). High school seniors' instructional experiences in science and mathematics. Washington, DC: U.S Government Printing Office.
National Governors Association Center for Best Practices & Council of Chief State School Officers. (2010a). Common Core State Standards. Washington, DC: Author.
National Governors Association Center for Best Practices & Council of Chief State School Officers. (2010b). Common Core State Standards (Mathematics). Washington, DC: Author.
National Governors Association Center for Best Practices & Council of Chief State School Officers. (2010c). Common Core State Standards for Mathematics Appendix A: Designing high school mathematics courses based on the Common Core State Standards. Washington, DC: Author. Retrieved from http://www.corestandards.org/assets/CCSSI_Mathematics_Appendix_A.pdf
Newton, J. A. & Kasten, S. E. (2013). Two models for evaluating alignment of state standards and assessments: Competing or complementary perspectives? Journal for Research in Mathematics Education, 44(3), 550-581.
Organisation for Economic Cooperation and Development. (2003). The PISA 2003 assessment framework. Paris: OECD Publications.
Organisation for Economic Cooperation and Development. (2004). First results from PISA 2003. Paris: OECD Publications.
Organisation for Economic Cooperation and Development. (2010). PISA 2009 results: What students know and can do. Paris: OECD Publications.
Organisation for Economic Cooperation and Development. (2013b). PISA 2012 assessment and analytical framework: Mathematics, reading, science, problem solving, and financial literacy. Paris: OECD Publications.
Porter, A. (2002). Measuring the content of instruction. Educational Researcher, 31(7), 3-14.
Porter, A. C., Polikoff, M. S., & Smithson, J. (2009). Is there a defacto national intended curriculum? Evidence from state content standards. Education Evaluation and Policy Analysis, 31(3), 238-268.
Schmidt, W. H., & Maier, A. (2009). Opportunity to learn. In G. Sykes, B. Schneider, & D. N. Plank (Eds.), Handbook of Education Policy Research (pp. 541-559). New York, NY: Routledge.
Smith, M. S., & O’Day, J. (1991). Systemic school reform. In S. H. Fuhrman & B. Malen (Eds.), The politics of curriculum and testing: The 1990 yearbook of the politics of education association (pp. 233-267). Bristol, PA: Taylor & Francis.
Vockley, M., & Lang, V. (2009). Alignment and the states: Three approaches to aligning the National Assessment of Educational Progress with state assessments, other assessments, and standards. Reston, VA: Council of Chief State School Officers.
Walberg, H. J., & Paik, S. J. (2000). Effective educational practices. Brussels, Belgium: International Academy of Education.
Webb, N. L. (1997). Criteria for alignment of expectations and assessments in mathematics and science education. (Research Monograph No. 6.) Washington, DC: Council of Chief State School Officers.
Author Information
Pooja Shivraj
Southern Methodist University
6116 North Central Expressway #1150D, Dallas, TX, U.S.A.