IOS Press
Remixing Entity Linking Evaluation Datasets
for Focused Benchmarking
Jörg Waitelonis
a, Henrik Jürges
band Harald Sack
cayovisto GmbH, August-Bebel-Str. 26-53, 14482 Potsdam, Germany
E-mail: [email protected]
bUniversity of Potsdam, Am Neuen Palais 10, 14469 Potsdam, Germany
E-mail: [email protected]
cFIZ Karlsruhe, Leibniz Institute for Information Infrastructure, Hermann-von-Helmholtz-Platz 1, 76344
Eggenstein-Leopoldshafen, Germany E-mail: [email protected]
Editor(s):Axel-Cyrille Ngonga Ngomo, Institute for Applied Informatics, Leipzig, Germany; Irini Fundulaki, ICS-FORTH, Heraklion, Greece; Anastasia Krithara, National Center for Scientific Research “Demokritos”, Athens, Greece
Solicited review(s):Michelle Cheatham, Wright State University, Dayton, Ohio, USA; Ziqi Zhang, University of Sheffield, UK; Heiko Paulheim, University of Mannheim, Germany; One Anonymous Reviewer
Abstract.In recent years, named entity linking (NEL) tools were primarily developed in terms of a general approach, whereas today numerous tools are focusing on specific domains such as e. g. the mapping of persons and organizations only, or the annotation of locations or events in microposts. However, the available benchmark datasets necessary for the evaluation of NEL tools do not reflect this focalizing trend. We have analyzed the evaluation process applied in the NEL benchmarking framework GERBIL [37,30] and all its benchmark datasets. Based on these insights we have extended the GERBIL framework to enable a more fine grained evaluation and in depth analysis of the available benchmark datasets with respect to different emphases. This paper presents the implementation of an adaptive filter for arbitrary entities and customized benchmark creation as well as the automated determination of typical NEL benchmark dataset properties, such as the extent of content-related ambiguity and diversity. These properties are integrated on different levels, which also enables to tailor customized new datasets out of the existing ones by remixing documents based on desired emphases. Besides a new system library to enrich provided NIF [11] datasets with statistical information, best practices for dataset remixing are presented, and an in depth analysis of the performance of entity linking systems on special focus datasets is presented.
Keywords: Entity Linking, GERBIL, Evaluation, Benchmark
1. Introduction
Named entity linking (NEL) is the task of intercon-necting natural language text fragments with entities in formal knowledge-bases with the purpose to e. g. help subsequent processing tools to cope with ambi-guities of natural language. NEL has evolved to a fun-damental requirement for a range of applications, such as (web-)search engines, e. g. by mapping the con-tent of search queries to a knowledge-graph [32] or
to improve search rankings [39]. By linking textual content to formal knowledge-bases, exploratory search systems as well as content-based recommender sys-tems greatly benefit from the underlying graph struc-tures by leveraging semantic similarity and relatedness measures [35]. Likewise, social media and web mon-itoring systems benefit from NEL, e. g. by the identifi-cation of persons or companies in social media content as subject of observation or tracking. A general survey on current NEL systems has been provided in [31,16].
While the number of application scenarios for NEL is on the increase, likewise the number of differ-ent NEL approaches is evolving ranging from sim-ple string matching techniques to comsim-plex optimiza-tion based on machine learning [26]. Most NEL ap-proaches make use of a general solution strategy, how-ever there is an uprising trend for specialized solutions. In [43] the authors demonstrate an approach focused on medical literature while [8] examine heritage texts with NEL. Other approaches are focused on specific entity types, such as e.g. [7], which is applied to the do-main of art. Another interesting solution is [1], which can be utilized to build domain specific NEL tools. The approach of [41] extracts semantic information from mixed media types like scientific videos. This ongoing fragmentation of types of tasks aggravates the appli-cation of generic benchmarking frameworks for NEL optimization and comparison such as GERBIL [37,30] or NERD [28,27].
With GERBIL, a NEL tool optimized for the de-tection of person names only might be rather diffi-cult to compare to other NEL tools of a more general focus or specialized for another topic. However, the benchmark datasets provided with GERBIL are anno-tated with all types of entities including organizations, events, etc. Therefore, by using these general typed benchmarks the overall achieved results with GER-BIL might only be hard to compare since the assumed person-only NEL system would wrongly be punished with false negatives caused by non-person annotations contained in the benchmarks. The only valid way to achieve an objective evaluation would be to manually filter a dataset to only contain persons and upload it to GERBIL for the desired experiment. However, these experiments are not reproducible, because it is neither clear or standardized, how the applied filtering was carried out, nor is the newly created filtered dataset al-ways publicly available for further experiments. More-over, it is not desirable to manage a plethora of dif-ferent versions of filtered datasets. As of now, GER-BIL deploys 19 annotation systems and more than 20 datasets, whereas these numbers are subject to con-stant change. For a detailed overview on the systems and datasets provided by GERBIL we refer to the of-ficial version1. Besides the already described problem, there are also more challenges faced by the GERBIL framework considering the recent development of new NEL approaches. For instance, it is highly desirable to
1http://aksw.org/Projects/GERBIL.html
be able to quantify the ‘difficulty’ of NEL problems presented in the different evaluation datasets, as e.g. the average degree of ambiguity, the completeness of annotations, etc.
A first attempt to cope with this problem was made in [12] by manually compiling the Kore502 corpus with the goal to capture hard to disambiguate men-tions of entities. Another problem arises with the qual-ity of annotations as described in [15] and [38] in-cluding e. g. annotation redundancy, inter-annotation agreement, topicality according to the evolving knowl-edge bases, mention boundaries, as well as nested an-notations. Especially, completeness and coverage of annotations are essential measures to assess those an-notation tasks (A2KB cf. [37]) where also the entity mention detection contributes to the overall results.
Since no ‘all-in-one’ perfect dataset has emerged in the past, which covers all the aspects sufficiently well, it would be beneficial to measure and provide dataset characteristics on the document level to sub-sequently allow a recompilation of documents across different datasets according to predefined criteria into a customized corpus. For example, for the already mentioned person-only annotation system these mea-sures would help to specifically select only those doc-uments, which exhibit a significant number of person annotations providing a predefined level of ‘difficulty’. Remixing evaluation datasets on the document level leads to a better and more application specific focus of NEL tool evaluation while simultaneously ensuring reproducibility.
We have already introduced an extension of the GERBIL framework enabling a more fine grained eval-uation and in depth analysis of the deployed bench-mark datasets according to different emphases [40]. To achieve this, an adaptive filter for arbitrary entities has been introduced together with a system to automati-cally measure benchmark dataset properties. The im-plementation including a result visualization are inte-grated in the publicly available GERBIL framework.
In this paper, we present the following contribu-tions: the work presented in [40] is brought up-to-date, consolidated, and furthermore extended with
– new additional dataset measures,
– a stand-alone library to enable customized remix-ing of datasets,
2https://datahub.io/de/dataset/
– a vocabulary to enrich NIF-based datasets with additional statistical information,
– a subset of available datasets has been reorga-nized to enable benchmarking according to the different dataset properties, and
– an in depth analysis of the performance of dif-ferent systems on the reorganized datasets is pre-sented.
The paper is structured as follows: after this in-troductory section, measures to characterize NEL datasets are introduced in Sect. 2. Sect. 3 explains the GERBIL integration as well as the stand-alone library in detail, while Sect. 4 elaborates on the most inter-esting properties on datasets we have determined so far and presents more insights on the systems perfor-mances on the reorganized and focused datasets. Fi-nally, Sect. 5 concludes the paper with a summary of the presented work and an outlook on ongoing and fu-ture research.
2. Measuring NEL Dataset Characteristics
NEL datasets have already been analyzed to great extent. We consider these analyses to identify their po-tential shortcomings to be able to introduce charac-teristics and measures to establish more differentiated analyses. In [15] the basic characteristics of 9 NEL datasets were introduced including the number of doc-uments, number of mentions, entity types, and num-ber of NIL annotations. In [34] a more detailed view on the distribution of entity types was given including mapping coverage, entity candidate count, maximum recall, as well as entity popularity. The overlap among datasets was investigated in [38], they also introduced the new measures confusability, prominence and dom-inance as indicators for ambiguity, popularity, and dif-ficulty.
In this paper, amongst others also a subset of the proposed characteristics has been integrated into the GERBIL benchmarking system. Compared to previ-ous work, where either a theoretical only or an exper-imental only treatment of the problem was presented, this paper contributes a ready to use implementation by means of extending the GERBIL source code3and also provides a publicly available on-line service4. Besides the implementation of filtering the benchmark datasets
3https://github.com/santifa/gerbil/ 4http://gerbil.s16a.org/
according to the desired characteristics, the tool in-stantly updates and visualizes the per annotation sys-tem results including statistical summaries. The inte-gration into GERBIL enables a standardized, consis-tent, extensible as well as reproducible way to analyze and measure dataset characteristics for NEL.
Building on that we also provide a stand-alone li-brary5 that computes the proposed metrics directly on NIF datasets. Without limiting the generality of the forgoing, the following explanations refer to the annotation (A2KB) as well as disambiguation tasks (D2KB) of the GERBIL framework. D2KB is the task of disambiguation of a given entity mention against the knowledge base. With A2KB, first entity mentions have to be localized in the given input text before the subsequent disambiguation task is performed. Hence, for most implementations D2KB can be seen as a sub task of A2KB.
Before introducing the dataset characteristics one by one the terminology is presented.
A datasetDis a set of documentsd∈D. We define a document as the tupled = (dt,da)wheredt is the
document text and|dt|is the number of words within the text of the documentd.da is a set of annotations
belonging to the documentdand|da|is the number of annotations for the documentd.
An annotationa ∈ da is defined as the tuplea =
(s,e,i,l).sis the surface form ofawhich can be lo-cated in the document textdt with its character index i, indicating the begin of the annotation, and the text lengthl, indicating the number of characters the anno-tation encloses to the right of indexi. The correspond-ing linked entity is denoted withe.
Furthermore, we defineE as the infinite set of en-tities and S as the infinite set of surface forms such that they are supersets of all other sets of the formEx
andSx. Moreover, we defineEDas the set of entities
within the datasetDandSDas the set of surface forms
withinD.
In the appendix of this paper a complete listing of the mathematical notation is given for overview pur-poses.
The hereafter defined measures might refer to dif-ferent levels: dataset level, document level, and anno-tation (or entity) level. Table 1 contains an overview on which measure is considered at a specific level.
Some of the introduced measures are distinguished between micro and macro measurements [4]. Macro
Table 1
Overview of the introduced measures and the according levels of reference, where (dsstands for dataset level,docfor document level anfor annotation level).
Measure Level
Not annotated ds
Density ds, doc
Prominence ds, doc, an
Maximum recall ds
Likelihood of confusion ds, doc, an
Dominance ds
Types ds, doc, an
measurement aggregates the average results of each single document. Regarding document length, all doc-uments have the same influence on the aggregated sult. In contrast, the micro measurement takes the re-sults of each document into account as if they would belong to one single document, which consequently increases the influence of larger documents.
The formal definition is provided for both measure-ments for density, likelihood of confusion, dominance, and maximum recall. All other definitions are provided as macro measurement if not stated otherwise.
2.1 Number of Annotations
In general, the number of annotations is a measure to estimate the size of the disambiguation context. The average number of annotations for a datasetna:D→
Ris defined as:
na(D) =Σd∈D|da|
|D| (1)
2.2 Not Annotated Documents
Some of the available benchmark datasets even con-tain documents without any annotations at all. Docu-ments without annotations might lead to an increase of false positives in the evaluation results and thereby might cause a loss of precision. The fraction of not an-notated documents for a datasetnad : D → [0,1]is defined as:
nad(D) = |{d:|da|= 0}|
|D| (2)
Empty documents might be a problem for the an-notation task (A2KB), but not for the disambiguation only task (D2KB), where empty document annotations are simply omitted in the processing.
2.3 Missing Annotations (Density)
Similar to not annotated documents, missing anno-tations in an otherwise annotated document might lead to a problem with the A2KB task. Annotation systems potentially identify these missing annotations, which are not confirmed in the available ground truth and thus are counted as false positives. It is not possible to deter-mine the specific number of missing annotations with-out conducting an objective manual assessment of the entire ground truth data, which requires major effort. However, we propose to estimate this number by mea-suring an annotation density value which is the frac-tion of the number of annotafrac-tions and the document text length. Thedensity:D→[0,1]is defined as:
densitymicro(D) =
Σd∈D |da|
|dt|
|D|
densitymacro(D) =
Σd∈D|da| Σd∈D|dt|
(3)
If an annotation is spanning more than one word, it is only counted as one annotation.
2.4 Prominence (Popularity)
The assumption of [38] is, that an evaluation against a corpus with a tendency to focus strongly on promi-nent or popular entities may cause bias. Hence, NEL systems preferring popular entities potentially exhibit an increase in performance. To verify this, we have implemented two different measures on the annota-tion level. Similarly to [38], the prominence is esti-mated as PageRank [22] of entities, based on their un-derlying link graph in the knowledge base. Addition-ally, we also take into account Hub and Authorities (HITS) values as a complementary popularity related score. PageRank as well as HITS values were obtained from [25].
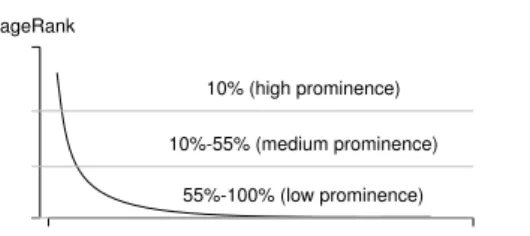
To classify annotations, documents, and datasets ac-cording to different levels of prominence of entities, the set of entities was partitioned as follows. PageRank (respectively HITS) underlies a power-law distribution (cf. Sect. 4.2.1), meaning that only a few entities ex-hibit a high PageRank and the majority of entities a lower PageRank (long-tail), cf. Fig 1. Highly promi-nent entities are then defined as the upper 10% of the top PageRank values. The subsequent 45% (i.e. 10% – 55%) define medium prominence and the lower 45% (i.e. 55% – 100%) low prominence.
dataset entities PageRank
10% (high prominence)
10%-55% (medium prominence)
55%-100% (low prominence)
Fig. 1. Example partitioning for the PageRank.
middle or lower segment would then be in the higher segment for a dataset with a more even distribution. Thus, when working with multiple datasets, a global partitioning including all values of all entities is pre-ferred.
For an arbitrary scoring algorithmPwe can define the set of entities within a specific intervala,b∈[0,1]
withED
a,b: (P)→Eas:
EDa,b(P) ={e∈ED:a≤P(e)≤b} (4)
The resulting set contains all entities of a dataset that satisfies the given interval limits. A disadvantage of this approach is that entities, which do not have a score assigned, are not part of one of the resulting sets. Similarly the prominence can be determined using the HITS values or any other ranking score.
2.5 Likelihood of Confusion (Level of Ambiguity)
Since a surface form might denote multiple mean-ings as well as entities might be represented by differ-ent textual represdiffer-entatives the likelihood of confusion is a measure for the level of ambiguity for one surface form or entity. It was first proposed in [38] for surface forms. The authors pointed out that the true likelihood of confusion is always unknown due to a missing ex-haustive collection of all named entities.
The likelihood of confusion needs some considera-tions beforehand. It can be determined for both sides of an annotationa= (s,e,i,l). For a surface formsand the possible links to some entitiesE and for an entity
eand the possible corresponding surface formsS. We define a dictionary of an annotating system by
WE which is a mappingWE :S →E.
As shown in Fig. 2 the text... Bruce ...(lower box) has an annotation with ‘Bruce’ as surface forms. This surface form can be linked against different entities, i.e. they are homonyms, thus exhibiting the same writ-ing but different meanwrit-ings. As shown in the figure, an entity can belong to the dataset or is unknown to the
dbr:Bruce_Springsteen dbr:Bruce_Willis
dbr:Bruce_Lee
… Bruce … Text Entities
Bruce
Surface form
E
DE
WE
Fig. 2. The likelihood of confusion for a surface form is determined by the total number of possible entities known to some annotating system and a dataseteD∪WE.
dataset but known to the annotating system. Also, the entity can be unknown to both sets.
For the other side we define a dictionary of the an-notating systemsWS which is a mappingWS :E→S.
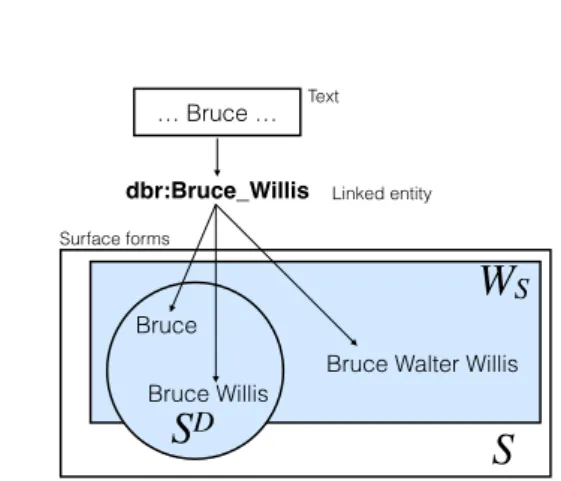
Fig. 3 shows the other side where the text annotation has dbr:Bruce_Willis as an entity. This entity can be linked against multiple possible surface forms which are synonyms. Again the surface form can be known to the dataset and the annotating system or un-known to one of them or both.
As already mentioned, a surface formsor an entity
ecan be placed within four possible locations:
1. Unknown to dictionary and dataset:
e∈/ ED∪W
Eors∈/SD∪WS
2. Only known to the dataset:
e∈ED\W
Eors∈SD\WS
3. Only known to the dictionary:
e∈WE\EDors∈WS \SD
4. Known to dictionary and dataset:
e∈ED∩WEors∈SD∩WS
The example annotation system dictionariesWEand WS used for the experiments has been compiled from
DBpedia entities’ labels, redirect labels, disambigua-tion labels, andfoaf:names, if available.
For a dataset and a dictionary, the average like-lihood of confusion is determined for surface forms
lcs f : (D,W)→
R+with:
lcs fmicro(D,W) = Σd∈D
Σa∈da|WE(s)∪ED(s)|
|da|
|D|
lcs fmacro(D,W) = Σs∈SD|WE(s)∪E
D(s)| |SD|
Bruce Walter Willis
dbr:Bruce_Willis
Bruce
… Bruce … Text
Surface forms
Linked entity
Bruce Willis
S
S
DW
SFig. 3. The likelihood of confusion for an entity mention is the num-ber of possible related surface forms shown in light blue.
The intuition is, the more entities exist per surface form, the larger is the likelihood of confusionlcs f.
The average likelihood of confusion for entitieslce: (D,W)→R+is:
lcemicro(D,W) = Σd∈D
Σa∈da|WS(e)∪SD(e)|
|da|
|D|
lcemacro(D,W) =Σe∈ED|WS(e)∪S
D(e)|
|ED|
(6)
Here the intuition is, the more surface forms exist per entity, the larger is the likelihood of confusionlce.
Again, an annotation within a dataset contains a sur-face form and an entity. For each side (sursur-face form or entity) the likelihood of confusion is determined by counting the elements belonging to this particular side. The measures should roughly indicate the difficulty distribution of a dataset.
2.6 Dominance (Level of diversity)
In [38] the dominance was introduced as a mea-sure of how commonly a specific surface form is re-ally meant for an entity with respect to other possible surface forms. A low dominance in a dataset leads to a low variance for an automated disambiguation system and to possible over-fitting. Similar to the likelihood of confusion, the true dominance remains unknown. Again, in addition to the work presented in [38] we estimate dominance for both sides of an annotation
a= (s,e,i,l): for the entities as well as surface forms. For an entire dataset and a dictionary, the average dom-inance is also determined in both directions.
For example the entitydbr:Angelina_Jolie, let there exist 4 different surface forms in the dataset,
while the dictionary provides overall 10 surface forms, which results in a 40% dominance of the entity
dbr:Angelina_Jolie in the considered dataset. The dominance of an entity determines how many different surface forms of this entity are used in the dataset (synonyms).
As example for the other side, for the given surface form ‘Anna’ the dictionary provides 10 different enti-ties, while the dataset only uses 2 entities for differ-ent mdiffer-entions of the surface form ‘Anna’, which results in a 20% dominance of ‘Anna’ for the dataset under consideration. The dominance of a surface form deter-mines how many different entities are used with this surface form in the dataset (homonyms). It indicates the variance or flexibility of the used vocabulary and expresses the dependency on context. Dominance in-dicates the expressiveness of the used dataset. An ex-tensive one exhibits more diversity. The dominance of a dataset is closely related to the likelihood of confu-sion since it describes the coverage among the dataset and dictionary.
The average dominance for a dataset D is deter-mined for all entities ED withdome: (W,D) →
R+
and for surface formsSDwithdoms f: (W,D)→
R+.
doms fmicro(D,W) = Σd∈D
Σa∈daWEEd(s)(s)
|da|
|D|
doms fmacro(D,W) =
Σs∈SD|E D(s)|
|WE(s)|
|SD|
(7)
domemicro(D,W) = Σd∈D
Σa∈daWSS d(e)(e)
|da|
|D|
domemacro(D,W) =
Σe∈ED|S D(e)|
|WS(e)|
|ED|
(8)
2.7 Maximum Recall
Most of the NEL approaches apply dictionaries to look up possible entity candidates matching a given surface form. If the dictionary doesn’t contain an ap-propriate mapping for the surface form the annotation system is unable to identify a possible entity candidate at all.
As Fig. 3 shows and as already mentioned before some parts of the dataset might not be contained within the dictionary. Surface forms not in the intersection are unlikely to be found by entity linking since the anno-tation systems are using dictionaries to look up poten-tial relations. Therefore, an incomplete dictionary lim-its the performance of an NEL system since an un-known surface form will lead to a loss in precision. So the maximum recall can be seen as an artificial limit of a dataset.
To estimate the coverage of a mapping dictionary, the maximum recall measurement was introduced by [34].
For a dictionaryWS and a dataset the maximum
re-call is the defined asmr: (D,W)→[0,1]:
mrmicro(D,W) =
Σd∈D(1−| Sd\W
S|
|Sd| )
|D|
mrmacro(D,W) = 1−
|SD\W S| |SD|
(9)
2.8 Types
Since some NEL approaches might be focused on a specific domain or handle some entity categories in a different way, a filter has been implemented to distin-guish dataset entities by their type. Besides the focus of NEL approaches in [38] it is also stated that types of entities may be differently difficult to disambiguate such as person names (esp. first names) might be more ambiguous and country names more or less unique. A type filter for some typeT andET denoting the set of
all entities forT is defined asED: (T)→E:
ED(T) ={e∈ED:e∈ET}. (10)
Following these theoretical considerations, the ex-tensions of the GERBIL framework and how the deter-mined characteristics are exploited will be described in the subsequent sections.
3. Implementation
This section describes the implementation of the GERBIL extension and the standalone library. Further-more, the vocabulary to integrate the calculated statis-tics in the NIF annotation model are explained in de-tail.
3.1. Extending GERBIL
Two new components have been implemented to ex-tend the GERBIL framework: one component to fil-ter and isolate subsets of the available datasets, and a second component to calculate aggregated statistics about the data (sub-)sets according to the newly intro-duced measures. It is important to mention that these filters and calculations can also be applied to newly up-loaded datasets. Thus, the system can also be used to gain insights about any arbitrary ‘non-official’ datasets not yet part of the GERBIL framework. The imple-mented filter-cascade is of a generic type and can be adjusted via customized SPARQL queries. For exam-ple, to filter a dataset to only contain entities of type
foaf:Personthe following filter configuration has to be applied:
name=Filter Persons
service=http://dbpedia.org/sparql query=select distinct ?v where {
values ?v {##} .
?v rdf:type foaf:Person . }
chunk=50
Thenamedesignates the filter in the GUI,service
denotes an arbitrary SPARQL-endpoint, but also a lo-cal file encoded in RDF/Turtle can be specified to serve as the base RDF query dataset. Thequeryis a SPARQL query that returns a list of entities to be kept in the filtered dataset. The## placeholder will be replaced with the specific entities of the dataset. To avoid the size limits for SPARQL queries, thechunk
parameter can be specified to split the query automati-cally in several parts for the execution. Any number of filters can be specified to be included in the analysis. With the flexibility of configuring SPARQL-queries, filters of any complexity or depth can be specified.
GERBIL List of Annotations
IriCleaner
Cache
if
cached
ret
ur
n
re
sul
t
Chunk
Filter
if
not
cached
cache
re
sul
t
ret
ur
n
re
sul
t
Fig. 4. Overview of the filter-cascade
entities. This segmentation is applied to PageRank as well as HITS values separately.
Fig. 4 shows a general overview of the filter cas-cade. The annotations produced by GERBIL are sub-sequently cleaned from invalid IRI’s. If they are al-ready cached the result is returned. Otherwise the set is chunked and passed to the defined filter.
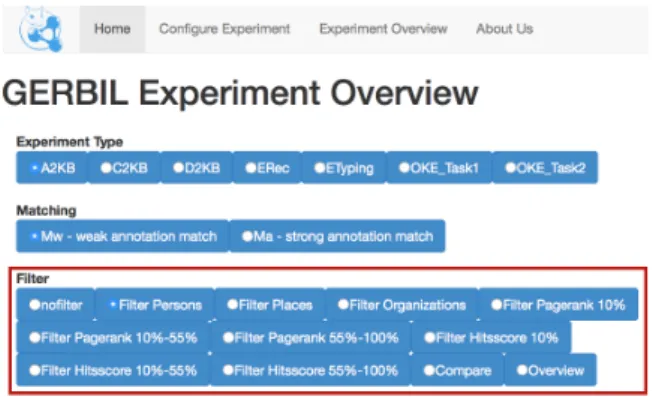
Buttons have been added as new control elements to the A2KB, C2KB, and D2KB overview pages in GER-BIL (cf. Fig. 5). The user now is able to choose be-tween the classic view ‘no-filter’, the persons, places, organisations filter views, the PageRank/HITS top 10%, 10-55%, and 55-100% filter views, a comparison view, or a statistical overview. All implemented mea-sures are visualized in GERBIL using HighCharts6. The existing charts are also replaced by the new chart API, since GERBIL was limited to only one single chart type. The comparison view enables the user to view two filters at the same time as well as the av-erage for all annotation systems on a specific filter. The overview shows several statistics for all datasets, such as e. g., total number of types per filter, density, likelihood of confusion in average and total. A subset of these statistics is shown and discussed in section 4. The extended source code is publicly available at Github7. In addition, an online version of the system is available8.
Before discussing the dataset statistics as a result of the new GERBIL extension, the following section
in-6http://www.highcharts.com/
7https://github.com/santifa/gerbil/ 8http://gerbil.s16a.org/
Fig. 5. New dataset filters for A2KB experiments in the GERBIL user interface.
troduces the stand-alone-library for statistics calcula-tion as well as the new vocabulary.
3.2. Library and Vocabulary for Dataset Statistics
Following the considerations mentioned in the pre-vious sections, the proposed measurements can also be calculated independently of GERBIL with a separate stand-alone library. The library consumes a NIF en-coded input file, calculates the proposed statistics, and extends the NIF file with the newly determined infor-mation. A comprehensive documentation as well as the library source code is provided at Github9.
To serialize the calculated statistics generated by the GERBIL extension as well as by the library, a vocabu-lary has been defined with three layers to be integrated into the NIF model.
The first layer refers to an entity mention, respec-tively annotation, (e. g. NIF phrase) with its corre-sponding text fragment. The second layer addresses to the document (e. g. NIF context) that provides the text where the entity mentions are embedded. A third layer groups documents together to form a dataset. We intro-duce thehfts:Datasetclass, which holds the doc-uments with the hfts:referenceDocuments
property. on the dataset level 13 properties have been introduced, which hold the measurements missing-annotation, density, maximum recall, dominance and likelihood of confusion on the dataset level. Some of them come with a micro as well as macro flavour while others are only computed once.
On the document level 6 new properties have been introduced to cover density, likelihood of confusion, and maximum recall. The likelihood of confusion,
Table 2
Overview of the introduced properties and the corresponding mea-surements (dsstands for dataset level,docfor document levelanfor annotation level).
Measure Property Level
Not annotated notAnnotated ds
Density microDensity ds
macroDensity ds
density doc
Prominence hits an
pagerank an
Maximum re-call
microMaxRecall ds
macroMaxRecall ds
maxRecall doc
Likelihood of confusion
microAmbiguityEntities ds
macroAmbiguityEntities ds
ambiguityEntities doc
ambiguityEntity an
microAmbiguitySurfaceForms ds
macroAmbiguitySurfaceForms ds
ambiguitySurfaceForms doc
ambiguitySurfaceForm an
Dominance diversityEntities ds
diversitySurfaceForms ds
prominence, and the types are also assigned on the en-tity mention level.
In Tab. 2 an overview over the introduced proper-ties and their corresponding level is presented. Fig. 6 shows an excerpt of the extended Kore50 dataset for the new dataset class. One can see the new dataset statistics introduced by the RDF properties introduced by thehfts:prefix. In Fig. 7 an example for the doc-ument level is presented (nif:Context). Addition-ally to the existing NIF data the statistics have been serialized with the newly introducedhfts:properties. The entire definition and further documentation of the vocabulary is available at Github10.
Next, the possibility of remixing customized bench-mark datasets will be explained including several ex-amples.
3.3. Remixing Customized Datasets
The basic idea of remixing NEL benchmark datasets is to tailor new customized datasets from the
exist-10hfts:<https://raw.githubusercontent.com/
santifa/hfts/master/ont/hfts.ttl##>
<https://.../hfts/master/ont/nif-ext.ttl/kore50-nif> a hfts:Dataset ;
hfts:diversityEntities
"0.0661871713645466"^^xsd:double ; hfts:diversitySurfaceForms
"0.08300283717687966"^^xsd:double ; hfts:notAnnotatedProperty "0.0"^^xsd:double ; hfts:referenceDocuments
<http://.../KORE50.tar.gz/AIDA.tsv/CEL06#char=0,59> .
Fig. 6. An example of the new statistics properties ondataset level
extending the KORE50 dataset.
<http://.../KORE50.tar.gz/AIDA.tsv/MUS03#char=0,97> a nif:RFC5147String , nif:String , nif:Context ; nif:beginIndex "0"^^xsd:nonNegativeInteger ; nif:endIndex "97"^^xsd:nonNegativeInteger ;
nif:isString "Three of the greatest ..."^^xsd:string ; hfts:ambiguityEntities "17.0"^^xsd:double ;
hfts:ambiguitySurfaceForms "250.0"^^xsd:double ; hfts:density "0.17647058823529413"^^xsd:double ; hfts:maxRecall "1.0"^^xsd:double .
Fig. 7. An example of the new statistics properties ondocument level
extending the KORE50 dataset.
ing ones by selecting documents based on desired em-phases. This enables the compilation of focused bench-mark datasets for NEL. For remixing it is proposed to store all analysed datasets in a single RDF triple store. This enables to quickly access the dataset doc-uments via the SPARQL query language. In particu-lar, SPARQL CONSTRUCT queries can be applied to select exactly those triples from the document anno-tations that meet a particular criteria, as e. g., popular persons, high possible maximum recall, places difficult to disambiguate, or any other arbitrary criteria, which can be expressed via SPARQL filter rules.
For this purpose, we introduce the basic query shown in Fig. 8. A CONSTRUCT statement creates RDF triples from document annotations meeting the filter requirement maximumRecall >= 1.0. This ba-sic query utilizes the entire RDF induced graph and it might be useful to limit the number of documents that should be returned by the query. For this task, a sub-query can be applied as shown in the second example in Fig. 9.
Another example is presented in Fig. 10. The SPARQL subselect chooses only documents that con-tain persons and aggregates their number. Subse-quently, the CONSTRUCT statement selects docu-ments that contain more than 4 persons with a maxi-mum recall of at least 0.8.
# select document triples and annotation triples CONSTRUCT {?doc ?dPredicate ?dObject .
?ann ?aPredicate ?aObject .} WHERE {
# select all document triples ?ds hfts:referenceDocuments ?doc. ?doc ?dPredicate ?dObject .
# select all referenced annotations ?ann ?aPredicate ?aObject ;
nif:referenceContext ?doc.
# use some filter condition ?doc hfts:maxRecall ?recall . FILTER (xsd:double(?recall) >= 1.0). }
Fig. 8. Basic query that selects only documents with a maximum recall >= 1.0
# select document triples and annotation triples CONSTRUCT {?doc ?dPredicate ?dObject .
?ann ?aPrediacte ?aObject .} WHERE {
# get all document triples ?doc ?dPredicate ?dObject .
# limit the number of selected documents {SELECT DISTINCT (?d AS ?doc)
WHERE {
?ds hfts:referenceDocuments ?d. # use this instead of a global limit # to ensure only documents are limited } LIMIT 1
}
# select all referenced annotations ?ann ?aPredicate ?aObject ;
nif:referenceContext ?doc.
# use some filter condition }
Fig. 9. This query in addition limits the number of selected docu-ments
the official DBpedia SPARQL endpoint is queried for additional information that is not present within the given benchmark datasets. More SPARQL examples can be found at Github11.
For authoring arbitrary queries two aspects should be considered. First, many values of the proposed mea-surements are given as absolute values and are not always equally distributed across the datasets, docu-ments, and annotations. Hence, it is necessary to in-vestigate on the boundary values and value distribution before specifying a specific threshold. It is a subject of future work to normalize and harmonize the statistics adequately. Second, the proposed query examples are based on the document level. Therefore, if an annota-tion meets a requirement, the entire document together with all its annotations (which might not meet the re-quirement) is added to the result. Of course, queries can also be structured to only return the filtered
anno-11https://github.com/santifa/hfts/blob/
master/Remix.md
# document selection omitted ?doc hfts:maxRecall ?recall .
# use count for a later filter expression
{SELECT DISTINCT (?d AS ?doc) (COUNT(?a) AS ?aCount) WHERE {
?ds hfts:referenceDocuments ?d . # select matching entities ?a nif:referenceContext ?d ;
itsrdf:taClassRef dbo:Person . } GROUP BY ?d LIMIT 100
}
# select referenced annotations omitted
# select only documents with more than three persons # and a maximum recall of 0.8
FILTER(?aCount > 3) .
FILTER(xsd:double(?recall) >= 0.8) .
Fig. 10. Extract documents with a maximum recall of 0.8 and at least 4 person.
# construct block omitted {SELECT DISTINCT (?d AS ?doc)
WHERE {
?ds hfts:referenceDocuments ?d . # select matching entities ?a nif:referenceContext ?d ;
itsrdf:taIdentRef ?ref ; itsrdf:taClassRef dbo:Person .
# fetch data from another endpoint SERVICE <http://dbpedia.org/sparql> {
?ref dbo:birthDate ?date . }
FILTER (?date <= xsd:date(’1970-01-01’)). }
}
Fig. 11. A SPARQL query that selects documents containing per-sons born before 1970 via additional data queried from the DBpedia SPARQL endpoint
tations, but this might lead to a missing annotation sce-nario that again might result in a drop of recall for the A2KB task.
Finally, the thereby newly created dataset can be up-loaded to the GERBIL platform for a precisely tailored evaluation experiment.
4. Statistics and Results
This section presents the results of the execution of the proposed measures on the GERBIL datasets. Fur-thermore, an in depth overview on how to use the new library to partition the benchmarking datasets accord-ing to different criteria and to analyze the systems per-formances in much greater detail is presented.
4.1. GERBIL Datasets
%
10 20 30 40
0
WES2015 0
OKE 2015
evaluation 1.7
DBpedia Spotlight
41.14
Microposts2014-T est
0
KORE50 0
MSNBC 1
OKE 2015
gold 0 IITB
32.2
Microposts2014-T rain
0
N3-RSS-500 0
N3-Reuters-128 36.8
ACE2004 0
News-100 0
AQ UAINT
Fig. 12. Percentage of documents without annotations in the GER-BIL datasets
%
10 20 30
13.8
WES2015 8.9
OKE 2015
eval. 19.8
DBpedia Spotl.
6.2
Microp.2014-T est
22.5
KORE50 6.9
MSNBC 17.3
OKE 2015
gold 27.8
IITB 9.3
Microp.2014-T rain
6.4
N3-RSS-500 5.5
N3-Reuters-128 1.4
ACE2004 7.8
News-100 6.6
AQ UAINT
11.4
alldatasets
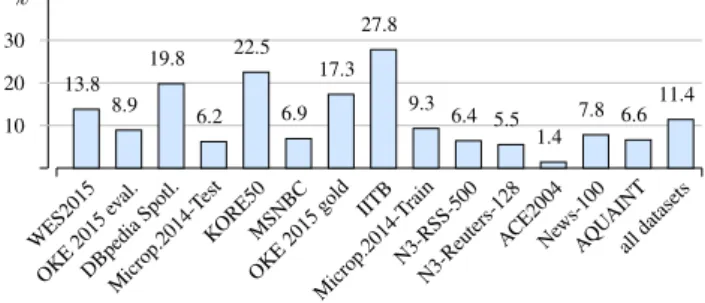
Fig. 13. Annotation density as relative number of annotations re-spective document length in words
KORE50 [12], MSNBC [5], IITB [14], RSS500 [29], Micropost2014 [2], Reuters128 [29], ACE2004 [19], AQUAINT [18], and NEWS-100 [29]. In this section, only the most significant results are presented. A com-plete listing of the achieved results is available on-line12.
Fig. 12 shows the percentage of documents in the GERBIL datasets which were not annotated. Over-all, there are 5 datasets that contain empty documents while 3 of them show a significant (i.e. >30%) number of empty documents. For A2KB tasks, these datasets might lead to an increased false positive rate and thus might lower the potentially achievable precision of an annotation system. Therefore, empty documents might be excluded from evaluation datasets to enable a sound evaluation. However, it should be noted that it is possi-ble that these un-annotated documents are not actually mistakes but rather don’t contain any entities.
Fig. 13 shows theannotation densityof the GER-BIL datasets as relative number of annotations with re-spect to document lengths in words. This serves as an estimation for potentially missing annotations, e. g. in
12http://gerbil.s16a.org/
the IITB dataset 27.8% of all terms are annotated. If a dataset is annotated rather sparsely (low values), it is likely that the A2KB task will result in loss of pre-cision, because the sparser the annotations the higher is the likelihood of potentially missing annotations (as it is shown in Sect. 4.2.7). Especially for NEL tools based on machine learning it should be considered, whether a sparsely annotated dataset is appropriate for the training task. Of course, this strongly depends on the according application. Nevertheless, it is arguable, if sparseness is problematic for A2KB, because all an-notation systems are facing the same problem and the achieved results nevertheless might still be compara-ble.
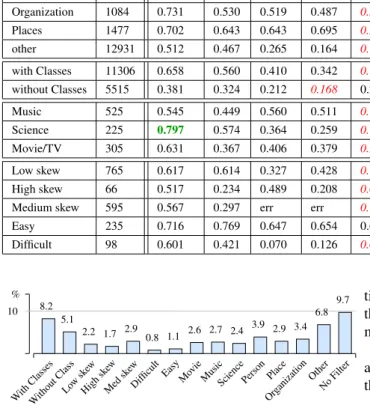
Table 3 shows thedistribution of entity types and
entity prominence per dataset. A green (bold) label
indicates the highest value and a red (italic) the low-est value in each category. Since not all entities can be linked with a type or affiliated with the ranking, the values for each partition do not necessarily sum up to 100%. For each dataset the percentage of entities per category is denoted, as e. g., of all the entities in the KORE50 dataset 47.1% are persons and 6.9% are places. In [34] it was demonstrated, there is a signifi-cant number of untyped entities in the DBpedia Spot-light and the KORE50 datasets. Therefore, an extra row for unspecified entities has been added to the ta-ble. The News-100 dataset exhibits the most unspeci-fied entities because it is a German dataset and mostly contains annotations referring to the German DBpedia, but the analysis was based on the English DBpedia. The first partition (row 1–4) can be considered as an indicator of how specialized a dataset is. Thus, e. g., for the evaluation of an annotation system with focus on persons, the KORE50 dataset with 45.1% of person an-notations might be better suited than the IITB dataset with only 2.4% of person annotations. The second and third partition (PageRank and HITS) show the entities categorized according to their popularity. It can be ob-served that many datasets are slightly unbalanced to-wards popular entities. A well balanced dataset should exhibit a relation of 10%, 45%, 45% among the three subset categories.
Table 3
Percentage of entities by entity type and entity popularity per dataset
WES
2015
OKE
2015
ev
al
DBpedia
Spotl.
Microp.
2014
T
est
K
ORE50
MSNBC OKE
2015
gold
IITB Microp.
2014
T
rain
N3-RSS-500 N3-Reuters-128 ACE2004 Ne
ws-100
A
Q
U
AINT
all
datasets
Persons 18.4 30.3 3.0 16.6 45.1 27.2 29.3 2.4 16.2 15.9 6.5 6.5 1.0 7.8 16.16
Org. 3.4 11.1 3.0 9.0 16.0 9.0 18.3 2.0 13.8 10.5 20.7 20.3 0.6 0.5 9.9
Places 9.4 14.0 8.2 8.9 6.9 17.5 14.5 3.5 14.2 7.2 17.2 35.0 0.3 24.5 13.0
unspecified 68.8 44.6 85.1 65.5 32 46.3 37.9 92.1 55.8 66.4 55.6 38.2 98.1 55.5 60.14 PageRank
10% 27.9 24.4 30.0 21.3 28.5 28.5 24.9 14.8 26.0 14.3 18.8 22.2 0.4 25.3 22.0
PageRank
10%-55% 48.9 39.5 47.6 49.8 48.6 32.2 0.3 29.8 45.8 23.0 31.4 37.6 1.1 43.7 34.2
PageRank
55%-100% 22.5 16.6 19.7 28.0 19.4 24.8 7.7 15.0 25.6 11.1 19.0 15.1 0.7 23.9 17.8 HITS
10% 28.4 21.1 32.4 31.4 27.8 29.8 26.9 12.3 32.9 18.3 19.0 28.4 0.4 29.0 24.2
HITS
10%-55% 12.9 12.4 18.2 14.4 20.8 22.8 0.3 12.2 13.6 7.3 9.1 11.4 1.4 45.3 14.4
HITS
55%-100% 58.0 47.0 48.2 51.8 47.2 32.1 50.2 35.2 50.6 23.2 40.6 15.3 0.4 18.9 37.1
SF Ent.
10 50
20 100
30 150
40 200
50 250
60 300
70 350
80 400
15 30
WES2015 21
57
OKE 2015
eval. 22
51
DBpedia Spotl.
24 81
Microp. 2014-T
est 29
446
KORE50 28
65
MSNBC 20
46
OKE 2015
gold 19
47
IITB 23
61
Microp. 2014-T
rain
19 100
N3-RSS-500 23
72
N3-Reuters-128 35
72
ACE2004
18 81
News-100 24
21
AQ UAINT
23 88
alldatasets
Fig. 14. Average number of surface forms (SF) per entity (blue, left) and average number of entities per surface form (red/hatched, right) indicating the likelihood of confusion for each dataset
be assigned to a surface form, i. e. it refers to entities per surface form, respectively homonyms. The figure shows clearly that KORE50 uses surface forms with a high number of potential entity candidates, i. e. it con-tains a large number of homonyms. Since this dataset is focused on persons it is not surprising that surface forms representing first names, such as e. g. ‘Chris’ or ‘Steve’, can be associated with a large number of cor-responding entity candidates. KORE50 was compiled
with the aim to capture hard to disambiguate mentions
of entities, which is confirmed by these observations.
ACE2004 exposes the highest average number of
sur-face forms for possible entities (35), i. e. it contains
many synonyms.
In Section 4.2.2 a correlation analysis between the
likelihoods of confusion for entities and surface forms
Fig. 15 shows theaverage dominance of entities
and surface formsin percent. The red/hatched bars
show the average dominance of entities. The domi-nance of an entity expresses the relation between an entity’s surface forms used in the dataset with respect to all its existing surface forms in the dictionary. Re-ferring to Fig. 15, the KORE50 dataset uses only 9% of the surface forms that are provided in the dictio-nary. This indicates also how well the dataset’s surface forms are covered by the dictionary’s surface forms.
On the other hand, the blue bars show theaverage dominance of surface forms. The dominance of a sur-face form expresses the relation of how many entities are using this surface form in the considered dataset and the overall number of entities in the dictionary us-ing this surface form.
Referring to Fig. 15, the KORE50 dataset in which many persons are annotated uses only 7% of the possi-ble entities for the contained surface forms. In average, entities are represented in the WES2015 dataset with 21% of their surface forms.
Since the datasets with a high likelihood of confu-sion have a low dominance, it is arguable that these two measures express somehow the contrary. For ex-ample, the KORE50 dataset has a high likelihood of confusion for surface forms with 446 entities for one surface form on the average. This means that for a high dominance each surface form is represented by more than 400 entities within this dataset. Such a high domi-nance means also that a high coverage of surface forms (dominance of entities) or entities (dominance of sur-face forms) is present. For example, in the WES2015 dataset, which is focused on blog posts on rather spe-cific topics, many rare entities (i.e. entities with a low popularity) with many different notations are used re-sulting in a likelihood of confusion of 15 surface forms for an entity on the average. The average dominance of entities is quite high with 21%, since the likelihood of confusion is low and topic specific blog posts often vary the surface forms for an entity to enrich the spirit-edness of the text. This is commonly known from ar-ticles or essays, where the author usually tries to min-imize frequent repetitions of surface form by varying the surface form for the entity under consideration to avoid monotony and to make the article more interest-ing to read. It might be concluded that a high dom-inance covers the diversity of natural language more precisely and therefore could be considered a means to prevent overfitting.
The News-100 dataset shows an anomaly in the dominance of entities, which is larger than 100 %. The
reason for that is that the dataset contains a large num-ber of entities from the German DBpedia. For these entities a surface form cannot be found in the dictio-nary (which was generated from the English DBpe-dia). That means, there are more surface forms present in the dataset than in the dictionary, which results in a dominance value larger than 100 %.
This section has introduced and discussed the re-sults of the statistical dataset analysis. Based on the information embedded in the NIF dataset files, a cus-tomized reorganisation of datasets can be accom-plished as explained in the following section.
4.2. Insights from Remixing Datasets
To gain more insights on the interplay of annotation systems performance and the introduced dataset char-acteristics, this section describes how the datasets are reorganized to determine each system’s performance with focus on a given measure.
The approach is to first combine the datasets into one large dataset and then divide it into partitions. Each partition contains only those annotations or doc-uments that lie in a specified interval of values of one of the proposed measures. For this purpose and to in-sert the statistical data into the NIF document the pro-posed library has been applied. Subsequently, the en-tire dataset was stored in an RDF triple store. With the SPARQL queries proposed in the previous sections, each partition was constructed and stored in a sepa-rate NIF document, which was submitted to the official GERBIL service to acquire the results.
For the conducted experiments the following pub-lic and GERBIL ‘shipped’ datasets have been used: DBpedia Spotlight, KORE50, Reuters128, RSS500, ACE2004, IITB, MSNBC, News100, AQUAINT. Other available datasets were either not publicly available or not in the NIF format.
Since the official GERBIL service was used to con-duct the experiments, the therewith provided systems are included in the experiments. Unfortunately, not all systems returned consistent results due to too many er-rors or insufficient availability. However, if sufficient results could be provided, the system was included in the analysis.
% % 10 20 30 40 50 60 70 80 90 100 110 120 10 20 30 40 50 60 70 80 90 100 110 120 21 58 WES2015 14 49 OKE 2015 eval. 9 33 DBpedia Spotl. 11 36 Microp. 2014-T est 7 9 KORE50 9 50 MSNBC 14 81 OKE 2015 gold 17 32 IITB 13 41 Microp. 2014-T rain 17 46 N3-Reuters-128 15 42 N3-RSS-500 8 35 ACE2004 11 132 News-100 10 25 AQ UAINT 13 48 all datasets
Fig. 15. Average dominance for surface forms (blue) and entities (red/hatched) per dataset
The measures used in the subsequent experiments are the measures currently supported by the library (i.e. likelihood of confusion, HITS, PageRank, density, and numbers of annotations). In general, both the A2KB as well as D2KB types of experiments, might be applied. For likelihood of confusion, HITS and PageRank only D2KB is provided because these are characteristics of the annotations. Number of annotations as estimation for the size of the disambiguation context is used with A2KB and D2KB types of tasks, density as character-istic of documents is used with A2KB only. All data as well as the achieved results can be found online13
4.2.1. Value distribution and partitioning
Fig. 16 presents the distribution of the data val-ues over all datasets. In total, the dataset contains 16,821 annotation in 1043 documents. The figure shows a distribution chart for each measure. On the charts, the x-axis shows the number of annotations (for confusions, HITS, PageRank) or documents (for den-sity and number of annotations). The y-axis shows the absolute values of the measures. Each of the charts approximate a power-law distribution, i.e. only a few items exhibit large values and many items smaller values. For HITS and PageRank only 14,372 items are available, because for 2,449 entities no HITS or PageRank value could be determined.
We have decided to apply a decile partitioning. It seems a reasonably well choice to indicate low, medium, large as well as the boundary values. When partitioning on the item values an uneven distribution of values over the partitions occurs because of the
13https://github.com/santifa/hfts/blob/ master/Results.md ������������������������������������� �� ��� ���� ���� ���� ���� ���� ���� ���� � � � ���� ����� ����� ����� � ����� ������ ������ ������ ������ ���������������� �� ���� ����� ����� ����� ����� ����� ����� ����� ����� � � � ���� ����� ����� ����� � ����� ������ ������ ������ ������ ����������������������� �� ������������� ������������� ������������� ������������� ������������� � � � ���� ����� ����� ����� � ����� ������ ������ ������ ���� �� ������� ������ ������� ������ ������� � � � ���� ����� ����� ����� � ����� ������ ������ ������ �������� �� ��������� ��������� ��������� ��������� ��������� � � � ��� ���� ���� ���� � ���� ����� ������� �� ��� ���� ���� ���� ���� ���� � � � ��� ���� ���� ���� � ���� ����� ���������������������
Fig. 16. Distribution of values (linear scale).
with-Table 4
Partitioning thresholds (log-based) and annotation/document quantities (this table is best viewed in color).
Conf. Surf. Conf. Ent. PageRank HITS Num. Anno. Density
Part. thr qty thr qty thr qty thr qty thr qty thr qty
0 <2 8143 <2 3946 unspec. 2449 unspec. 2449 <2 20 <0.009 4
1 5 1368 3 599 <1.39E-07 3211 <5.77E-09 2456 3 595 0.015 10
2 12 1893 6 812 4.03E-07 1341 2.63E-08 19 5 63 0.023 26
3 28 2026 11 2256 1.17E-06 1504 1.20E-07 200 9 86 0.035 58
4 64 1581 19 2802 3.39E-06 2072 5.48E-07 446 16 93 0.055 194
5 147 963 34 3245 9.85E-06 2753 2.50E-06 819 29 61 0.086 333
6 338 382 62 2204 2.86E-05 1869 1.14E-05 1474 50 33 0.133 197
7 777 297 111 744 8.29E-05 1010 5.21E-05 2314 87 33 0.207 129
8 1786 128 200 203 2.40E-04 331 2.38E-04 2960 153 35 0.322 65
9 4105 40 361 10 6.98E-04 135 0.001 2744 267 24 0.500 27
10 0.002 146 0.005 940
���������������������������������� �� ��� ���� ����� � � � ���� ����� ����� ����� � ����� ������ ������ ������ ������ ���������������� �� ��� ���� ����� ������ � � � ���� ����� ����� ����� � ����� ������ ������ ������ ������ ����������������������� ������������ ������������ ������������ ������������ ������������ ������������ ������������ ������������ � � � ���� ����� ����� ����� � ����� ������ ������ ������ ���� ���������� ���������� ���������� ���������� ���������� ���������� ���������� � � � ���� ����� ����� ����� � ����� ������ ������ ������ �������� ������ ����� ���� �� � � � ��� ���� ���� ���� � ���� ����� ������� �� ��� ���� ����� � � � ��� ���� ���� ���� � ���� ����� ���������������������
Fig. 17. Distribution of values (log scale).
out a value (unspec.). Each threshold is meant as the upper boundary of the partition, thus the lower bound-ary is the threshold of the previous partition. The color coding in the background of the cells will be explained later.
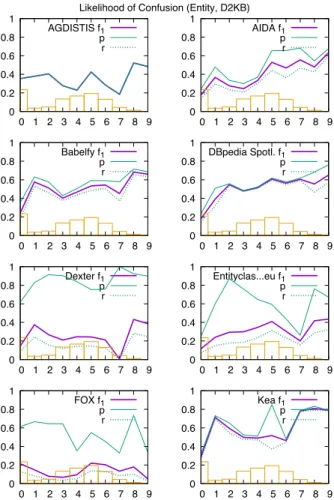
4.2.2. Likelihood of confusion of surface forms
Fig. 18 shows the experimental results of each sys-tem for the likelihood of confusion of surface forms. Each graph shows the partitions (x-axis), as well as
������������������������������������������� �� ���� ���� ���� ���� �� �������� �� �������� �� ����������� � � �� ���� ���� ���� ���� �� �������� �� �������� �� ������� � � �� ���� ���� ���� ���� �� �������� �� �������� �� ���������� � � �� ���� ���� ���� ���� �� �������� �� �������� �� ����������������� � � �� ���� ���� ���� ���� �� �������� �� �������� �� ��������� � � �� ���� ���� ���� ���� �� �������� �� �������� �� ������������������ � � �� ���� ���� ���� ���� �� �������� �� �������� �� ������ � � �� ���� ���� ���� ���� �� �������� �� �������� �� ������ � �
Fig. 18. Likelihood of confusion for surface forms (D2KB)
the determinedF1-measure (f1), precision (p), and
The likelihood of confusion for surface forms de-scribes the number of entities mapping to one partic-ular surface form. For an annotation in the dataset, a confusion of 30 signifies that 30 possible entities for that surface form exist (homonymy).
The leftmost partition (0) contains lower values, thus annotations contain surface forms with fewer numbers of entities mapping to them and therefore a lower likelihood of confusion. Typical are for ex-ample surface forms mentioning full names, as e. g., ‘Britney Spears’, ‘Northwest Airlines’, or ‘JavaScript’. The rightmost partition (9) shows larger values. It is expected that the annotations in the right partitions are more difficult to disambiguate since they exhibit a larger likelihood of confusion. The first partition con-tains almost half of all values, indicating that for al-most half of the annotations only one entity maps to the surface form. For the second to sixth partition a rea-sonable even distribution is given. Considering Tab. 4, only 40 items are in the rightmost partition. These include the names Allen, Bill, Bob, Carlos, David, Davis, Eric, Jan, John, Johnson, Jones, Karl, Kim, Lee, Martin, Mary, Miller, Paul, Robert, Ryan, Steve, Tay-lor, and Thomas.
This experiment was applied as a disambiguation task (D2KB)14. However, the Entityclassifier.eu sys-tem did not provide results for partitions 7,8, and 9 (set to zero). WAT and PBOH created too many errors and have been excluded in this experiment.
To interprete the figures in general, the presented graphs show a trend from the upper left to the lower right, meaning that the systems performance decreases with growing likelihood of confusion. Many systems, except AIDA and Babelfy, fail with surface forms hav-ing more than ca. 1,700 entities mapphav-ing to (8th parti-tion and above). Entityclassifier.eu , Dexter, and FOX show a very strong focus on precision, at the expense of recall, as we can also see in the further experiments. It can be concluded that the fewer entities are map-ping to a particular surface form, the easier seems the disambiguation task. For surface forms with more than 1,700 potential entity candidates the reliability of the disambiguation might drop dramatically.
4.2.3. Likelihood of confusion of entities
Fig. 19 shows the experimental results of each sys-tem for the likelihood of confusion of entities. The graphs are presented in the same way as for the
previ-14http://gerbil.aksw.org/gerbil/experiment?
id=201712060006
��������������������������������������
�� ���� ���� ���� ���� ��
�������� �� �������� �� �����������
� �
�� ���� ���� ���� ���� ��
�������� �� �������� �� �������
� �
�� ���� ���� ���� ���� ��
�������� �� �������� �� ����������
� �
�� ���� ���� ���� ���� ��
�������� �� �������� �� �����������������
� �
�� ���� ���� ���� ���� ��
�������� �� �������� �� ���������
� �
�� ���� ���� ���� ���� ��
�������� �� �������� �� ������������������
� �
�� ���� ���� ���� ���� ��
�������� �� �������� �� ������
� �
�� ���� ���� ���� ���� ��
�������� �� �������� �� ������
� �
Fig. 19. Likelihood of confusion for entities (D2KB)
ous measure. The likelihood of confusion for entities describes to how many surface forms the entity of an annotation is mapping to. For an annotation, a confu-sion of 30 means that 29 surface forms besides the one within the annotation share the same entity.
The leftmost partition (0) contains lower values, thus annotations with entities mapping to only one sur-face form. The rightmost partition (9) contain annota-tions with entities mapping to more than 361 surface forms e.g.dbp:United_States. The number of items across the partitions is more evenly distributed than for the previous measure.
This experiment was applied as disambiguation task (D2KB)15. All participating systems except WAT and PBOH returned valid results, Entityclassifier.eu re-turned several faulty results.
15http://gerbil.aksw.org/gerbil/experiment?
In general, there is an upward trend, i.e., the more surface forms are available for an entity, the bet-ter it is. However, almost all systems have in com-mon, that the performance drops rather abruptly on the first partition (0) compared to the second par-tition (1). A closer look on the parpar-tition data re-vealed that a large share of the entities in parti-tion 0 are resources originating from Wikipedia redi-rect and disambiguation pages (e. g.dbp:Diesel,
dbp:Thermoelectricity). Typically, these re-sources only map to a single surface form, which is why they occur in partition 0. Assumably, the sys-tems are not annotating redirect and disambiguation resources, since they prefer to use the main resource and not resources directing to it. Some datasets show a drop at partition 7, but the partition data does not show obvious anomalies. Since we only can access the performance values provided by the GERBIL experi-ments, and therefore cannot access the actual annota-tions systems results, it is impossible to further inves-tigate on that now.
Overall, it can be concluded that the more surface forms an entity is mapping to, the better the systems performances are. Furthermore, the datasets contain-ing a larger number of redirect and disambiguation resources can bias the systems performances. Future work will repeat this analysis without bias to gain in-sights about, how well the systems really perform on the first partition.
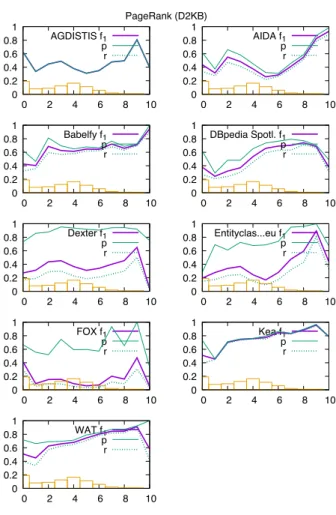
4.2.4. PageRank
Fig. 20 shows the systems performances on the pop-ularity estimation via PageRank values. Now, an ad-ditional partition is included in the graphs, which is located left (partition 0) showing the results on the 2,449 annotations, where no PageRank was given. For all other partitions, the PageRank values increase from left to right. Thus, popular entities can be found on the right hand. The distribution of values across the parti-tions is reasonable even.
The experiments were conducted as D2KB task16. With the exception of Entityclassifier.eu and FOX, all systems returned error free results. For the time of the execution of these experiments, also the WAT system was available. PBOH was not available.
In the graph a general uprising trend can be ob-served, i.e. popular entities are better disambiguated than unpopular entities, but with the exception of
16http://gerbil.aksw.org/gerbil/experiment?
id=201712060001
���������������
��
����
����
����
����
��
�� �� �� �� �� ��� �����������
� �
��
����
����
����
����
��
�� �� �� �� �� ��� �������
� �
��
����
����
����
����
��
�� �� �� �� �� ��� ����������
� �
��
����
����
����
����
��
�� �� �� �� �� ��� �����������������
� �
��
����
����
����
����
��
�� �� �� �� �� ��� ���������
� �
��
����
����
����
����
��
�� �� �� �� �� ��� ������������������
� �
��
����
����
����
����
��
�� �� �� �� �� ��� ������
� �
��
����
����
����
����
��
�� �� �� �� �� ��� ������
� �
��
����
����
����
����
��
�� �� �� �� �� ��� ������
� �
Fig. 20. Results for PageRank (D2KB)
AIDA and Babelfy, all systems struggle with ex-tremely popular entities (partition 10). A view in the data revealed that the 146 annotations only refer to the 4 entitiesdbp:Germany,dbp:United_States,
dbp:Americas and dbp:Animal. It might be that some of the effect comes from the confusion of dbp:United_States and dbp:Americas. Therefore, partition 10 might not be sufficiently repre-sentative. The entities with the largest PageRanks (e.g. from partition 8) mostly refer to countries and popular locations as well as to the entitydbp:Insect.
In conclusion, a positive correlation (>0.7) between the PageRank values and the systems performances can be observed. It seems likely that popular entities are used much more frequently, while being described via many varying surface forms.
4.2.5. HITS