1
CDGA, Université Bordeaux 1, 33405 Talence cedex, France; 2BRGM, B.P. 6009, 45060 Orléans cedex 2, France;3CERM UQAC Boulevard de l’université Chicoutimi Canada.
(Accepted January 20, 2000)
ABSTRACT
Through laboratory research performed over the past ten years, many of the critical links between fracture characteristics and hydromechanical and mechanical behaviour have been made for individual fractures. One of the remaining challenges at the laboratory scale is to directly link fracture morphology of shear behaviour with changes in stress and shear direction. A series of laboratory experiments were performed on cement mortar replicas of a granite sample with a natural fracture perpendicular to the axis of the core. Results show that there is a strong relationship between the fracture’s geometry and its mechanical behaviour under shear stress and the resulting damage. Image analysis, geostatistical, stereological and directional data techniques are applied in combination to experimental data. The results highlight the role of geometric characteristics of the fracture surfaces (surface roughness, size, shape, locations and orientations of asperities to be damaged) in shear behaviour. A notable improvement in shear understanding is that shear behaviour is controlled by the apparent dip in the shear direction of elementary facets forming the fracture.
Keywords: geostatistics, image analysis, mechanical behaviour, rock joint, roughness.
INTRODUCTION
Changes in stress and deformation in fractured rock masses are of fundamental importance for a number of applications on rock mechanics including assessment of stability in underground openings and optimization of petroleum and geothermal production. Fractures in rock masses constitute planes of weakness. Under external loads, sliding is likely to occur; then, due to the presence of asperities at the fracture surfaces, dilation related to the anisotropy of the fracture surface, usually accompanies the shearing process, leading to an increase in the joint aperture and mechanical degradation of the asperities which occurs during shearing (Cook, 1992). The wide effects of dilation and anisotropic properties of rock masses are strong arguments for making improvements in some basic areas such as stress transformation in dilatent materials, and in constitutive modelling of rock masses (Barton, 1999). Laboratory research during the past ten years has explained many of the critical links between the characteristics of fractures and their mechanical behaviours. One of the remaining research challenges is to directly link fracture geometry with shear behaviour including changes in stress and direction.
This paper describes results from a series of shear tests performed on identical copies (replicas) of a natural rock fracture (two rocky rough non planar surfaces –
diameter 88 mm –surrounding a more or less thick void space –from 0 to 1.2 mm). During a shear test, one of the surfaces (the upper one) moves horizontally (∆U) at
a given rate in a given direction (φ) while the other remains fixed, the whole fracture suffering a constant normal load σN. The moving surface accommodates the
constant normal load by a vertical displacement (∆V)
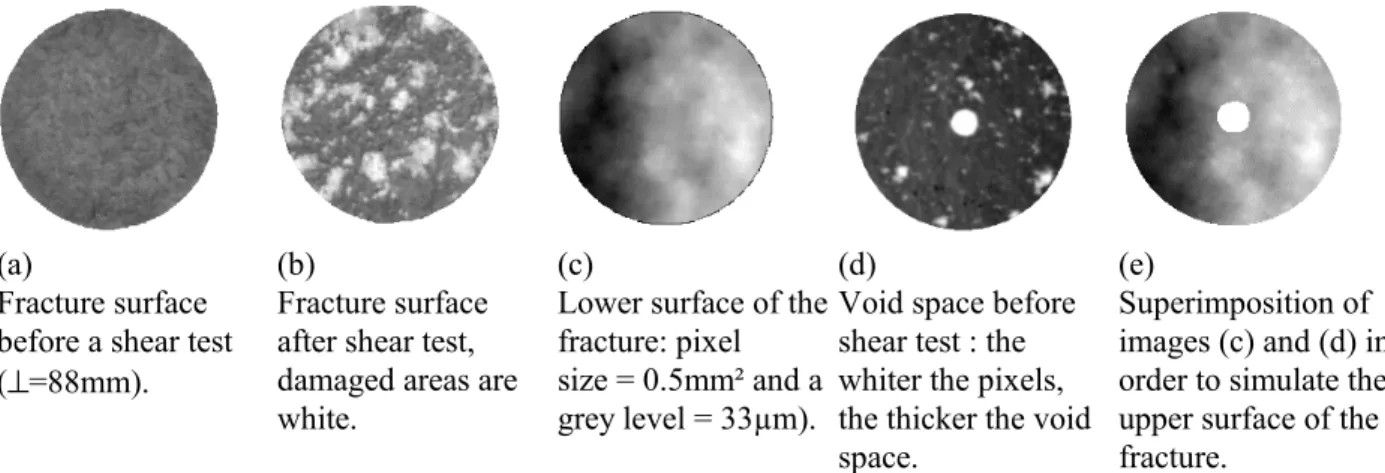
(a)
Fracture surface before a shear test (⊥=88mm).
(b)
Fracture surface after shear test, damaged areas are white.
(c)
Lower surface of the fracture: pixel size = 0.5mm² and a grey level = 33µm).
(d)
Void space before shear test : the whiter the pixels, the thicker the void space.
(e)
Superimposition of images (c) and (d) in order to simulate the upper surface of the fracture.
Fig. 1. A set of typical images available for analysing damage on sheared fracture surfaces.
used to simulate the displacement of the upper surface relative to the lower surface with respect to the experimental ∆V = f(∆U) relationship. As a result, it is
possible to reveal what areas of the fracture are mechanically concerned - elastic deformation or failure - because of the geometrical incompatibilities. Afterwards, we compare those areas to the damage areas in order to validate the algorithm we have previously proposed for predicting areas that are most likely to be damaged during shearing in a given direction (Riss et al., 1998).
IMAGES OF THE FRACTURE
SURFACES AND SHEAR PROCESS
Fig. 1 shows typical images used to analyse the shear behaviour of rock joints. Figs. 1 (a) and (b) show on one hand the uniformity of the grey levels of the image of the surface before shearing and on the other hand, the white pixels due to damage during the shear test.
Fig. 1(c) shows the grey level image of the topography of the lower wall of the fracture (grey levels are proportional to elevations that have been inferred by a geostatistical simulation, Gentier et al., 1997). The image of the upper wall (Fig. 1e) is created by adding grey levels of the lower wall to those of the void space (the central white area of the void space is a hole used for the injection of fluid during hydromechanical shear tests). Since images of both upper and lower surfaces are available, an imaging process for the simulation of a shear test is proposed.
Table 1 summarizes in a schematic way the experimental procedure of a shear test and the imaging analogue process (results are dependent on σN, ϖ and φ
1. Data to be converted to grey levels are elevations z of a set of points located at the nodes of a regular square grid. We manage in order to have a one to one correspondence between points on the grid and pixels in the actual image. Since the distance between points on the grid is 0.5 mm, the pixel size is 0.5x0.5 mm². Therefore, because the diameter of the sample is 88 mm, it is sufficient to take a 256x256 pixel image and to centre the fracture surface so that it remains at least 40 pixels in any direction all around the fracture surface allowing a maximal horizontal displacement of 20 mm. 2. Various directions (φ = 0°, 90°, -30°, 60°) are used
for the horizontal displacements. Two of these directions (0°, 90°) are natural principal directions of the square grid. Another one (-30°) is a principal direction of a hexagonal grid so, in that case, we change the square grid into an hexagonal grid by moving one row of pixels over two by half of a pixel. After that the shear simulation is performed working with the hexagonal grid. The fourth direction is never a principal direction, so we have to choose either to rotate the image in such a way that the fourth direction becomes a principal direction of one of the grids, or to combine elementary displacements along principal directions to perform the displacement we need. Neither the former nor the latter solutions are good solutions because rotation and displacements (that are not necessarily entire numbers of elementary displacements) on digital grids do not work well. The choice between the two solutions should be arbitrary.
depth of the image is chosen to be 2 bits (one byte). Since the maximal vertical displacement may be equal to 0.7 mm (21 grey levels), some problems can occur when grey levels of the uplift image are greater than 255. Fortunately it does not matter because the only data we need when simulating the shear process are the locations of the pixels of the translated upper surface with a grey level lower than the grey levels of the remaining fixed pixels of the lower surface. These pixels give us the locations of the parts of the material forming fracture that will probably be damaged during shear.
ANALYSIS OF THE RESULTS
AND DISCUSSION
While simulating the shear process, we focus our attention on a particular direction (φ = 90°); the upper surface moves rightwards, the lower leftwards) without lack of generality. A normal load σN is applied to the
shear box, but it must be noticed that, due to the
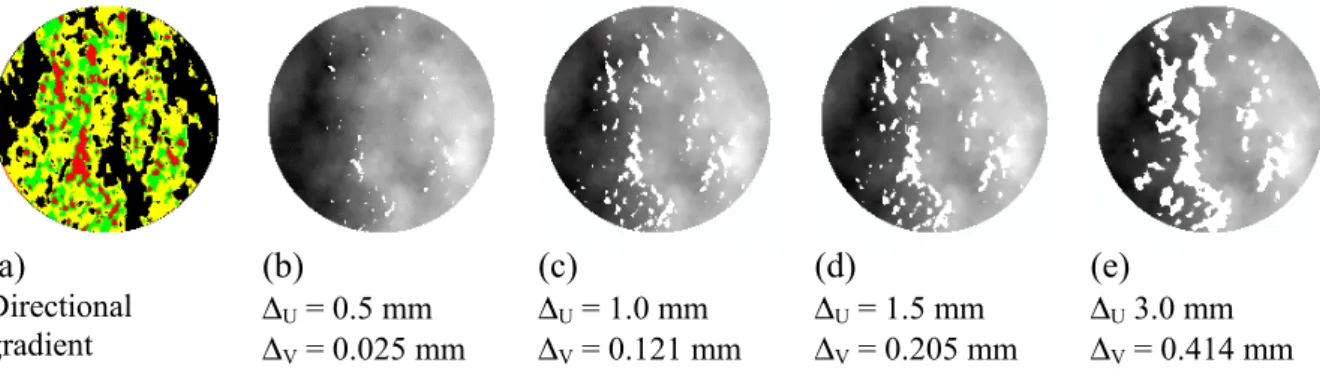
gradient consists of changing the grey level of the current pixel i according to of the grey level of its adjacent pixels i-1 and i+1 in the φ direction; the grey level at pixel i becomes black or proportional to the difference between the grey levels of the adjacent pixels depending on wether their grey level difference is negative or not. From the image analysis point of view the directional gradient gφ(f) of a function f in the
direction φ can be defined by the difference between the thickening and the thinning of the function f (thickening and thinning are classical morphological transformations operating on grey level images; Serra, 1982):
( )
(
φ) (
φ)
φ
f
f
T
f
T
g
=
⊕
−
!
where T1 and T2 form the two-phase structuring element Tφ = (T1,T2)φ ;the procedure is given in Micromorph 1.3,
1997. Black pixels (Fig. 2) correspond not only to areas remaining unloaded (37.5% of the surface area of the fracture), but to areas of the upper and lower surfaces that move away from each other during shearing (Table 1c). Other pixels correspond to areas with positive slope that may be loaded or unloaded during shearing, depending of the dilatancy ∆V = f(∆U).
Table 1. Experimental procedure and imaging analogue process for analysing damage on sheared fracture surfaces.
1. Normal loading of the shear box (σN is kept constant
during the shear test). Upper surface moves towards the lower by closing of the void space ∆z; mechanical deformation happens.
2. Horizontal displacement at a constant rate ϖ of the upper surface of the fracture until a given level (∆V, ∆U,
τ ) are recorded: (a). The vertical line on (a) indicates the maximum shear (τ = 26MPa) and dilatancy (tg
-1[∆
V/∆U] = 10°) values.
3. Opening the shear box and observing the damages (b).
1. Lowering of the grey levels of the image of the upper surface proportional to ∆z.
2. Shifting of the image of the upper surface in the shear direction of a number of pixels proportional to ∆U and,
3. changing the grey level of the shifted image with respect to the vertical displacement ∆V,
4. subtraction of the grey levels of the two images and threshold to show parts of the fracture where
geometrical incompatibilities occur (c and d).
-0,1 0,1 0,3 0,5 0,7
0 1 2 3 4 5
0 5 10 15 20 25 30
∆U mm
τ MPa ∆V mm
a) b)
Profiles showing the
geometrical
incompatibilities
c) d)
Peak
(a)
(b)
(c)
(d)
(e)
Directional
gradient ∆∆UV = 0.5 mm = 0.025 mm ∆∆VU = 0.121 mm = 1.0 mm ∆∆UV = 1.5 mm = 0.205 mm ∆∆UV 3.0 mm = 0.414 mm
Fig. 2. The directional gradient of the lower surface of fracture (a) and the pattern of geometrical incompatibilities as explained (b,c,d,e) The normal stress is 21MPa.
∆U = 0.5 to 1.0 mm
∆V = 0.025
to 0.121 mm
∆U = 1.0 to 1.5 mm
∆V = 0.121
to 0.205 mm
∆U = 1.5 to 2.0 mm
∆V = 0.205
to 0.279 mm
∆U = 4.0 to 4.5 mm
∆V = 0.548
to 0.614 mm
∆U = 4.5 to 5.0 mm
∆V = 0.614
to 0.678 mm
Fig. 3. Details of the pattern evolution of incompatibilities. Yellow pixels show areas remaining loaded from one displacement to the other; red pixels are areas becoming unloaded and black pixels are new loaded areas.
0% 10% 20% 30%
0,5 1,5 2,5 3,5 4,5 AA
0 20 40 60 80 R 7 MPa
21 MPa
(a)
(b)
(c)
(d)
Superimposition of images of Figs. 2a,c.
Left scale: areal proportion (AA)
Right scale: ratio (R).
Boundaries of areas undergoing geometrical incompatibilities at ∆U = 1.0 (c) and
∆U = 5.0mm (d) superimposed on the image
of the sheared surface.
Fig. 4. Some results from the imaging shear simulation.
Fig. 2 (b, c, d, e) show the areas of the fracture surface undergoing sliding, elastic deformation, failure and/or crushing of the rock. Progressively fine white gouge mylonite develop (Fig. 2b); this is a consequence of the
possible to estimate a lower bound of the areal proportion (AA) of the surface upon which the shear
machine exerts the force, and consequently an upper bound of the ratio (R) of the effective stress to the applied stress σN (Fig. 4b). Finally Figs. 4 c and d show
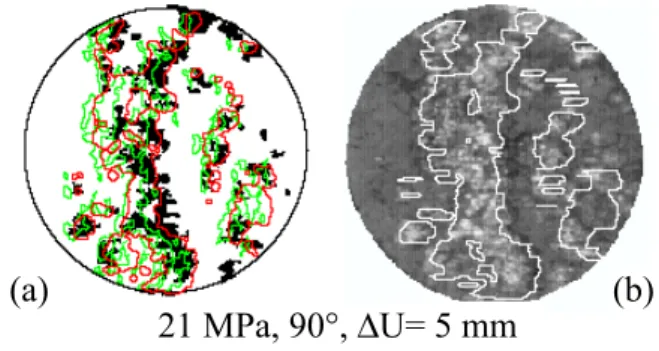
that white damaged areas are right shifted with respect to the areas undergoing geometrical incompatibilities. This may be explained on one hand because some areas become unloaded and therefore the corresponding material remains uncrushed and on the other hand because crushed material is pushed away towards the void space. Fig. 5a shows the relative position of the boundaries of the areas with highest gradient (apparent dip greater than 10°, i.e. the value of the dilatancy angle at the mechanical peak, Table 1c), the areas undergoing geometrical incompatibilities during shearing and the areas showing white gouge material at the end of the shear test. The directional dilation of areas undergoing geometrical incompatibilities (structuring element with a size correlated to the horizontal displacement) allows the prediction of the white damaged areas, Fig. 5b.
Fig. 5. (a) Boundaries of areas with highest gradient (green), geometrical incompatibilities (red) and damaged areas (black); (b) see in the text.
CONCLUSION
Very simple tools of image analysis are efficient and helpful for visualizing what happens between the fracture surfaces during a shear test.
The damaged areas are strikingly correlated to the directional gradient: areas with apparent dip values higher than the peak dilatancy angle have the highest
effectively predict damage in fractures during shearing.
A preliminary report of some of the data (Lopez et al., 1999) has been presented at the Xth International
Congress for Stereology, Melbourne, Australia, 1-4 November 1999.
ACKNOWLEDGEMENT
The present research was supported by the University Bordeaux I (France).
REFERENCES
Barton N (1999). General Report Concerning Some 20th Lessons and 21th Century Challenges in Applied Rock
Mechanics, Safety and Control of the Environment. 9th
International congress on Rock Mechanics. Paris, 25-8. Cook NGW (1992). Jaeger Memorial Dedication Lecture :
Natural Joints in Rock; Mechanical, Hydraulic and Seismic Behaviour and Properties under Normal Stress. Int J Rock Mech & Min Sci 29:198-223.
Gentier S, Billaux D, Van Vliet L (1989). Laboratory Testing of the Voids of a Fracture. Rock Mechanics and Rock Engineering: Springer-Verlag, 22:149-57.
Gentier S, Chilès JP, Riss J (1991). Analyse et simulation d’une surface de fracture rocheuse Cahier de géostatistique, fascicule 1 Fontainebleau, 77-87.
Gentier S, Verreault N, Riss J (1997). Roughness and flow paths in a fracture. Acta Stereol 16: 307-14.
Gentier S, Riss J, Flamand R, Archambault G, Hopkins D. Influence of the fracture geometry on its shear behavior. Proceedings of the Neville Cook Conference, San Francisco California, 16-17 October 1998 to appear. Micromorph. Mathematical and image processing, release 1.3
CMM/ARMINES /ENSMP/ TRANSVALOR, 1997. Riss J, Gentier S, Laffréchine K, Flamand R, Archambault G
(1996). Binary images of rock joints: Characterisation of damaged zones. Microscopy, Microanalysis, Microstructures 7:521-6.
Riss J, Gentier S, Hopkins D (1998). Shear behaviour of rock joints: prediction of the damaged areas using mathematical morphology. Acta Stereol 17:303-8.
Serra J (1982). Image analysis and mathematical morphology. Academic Press, 610.