Sun Management Center
Agent
Device Management
Supports Management Module SM-SUN1000
Copyright Notice
Document 9035044-02. Copyright © April 2002 Aprisma Management Technologies, Inc. All rights reserved worldwide. Use, duplication, or disclosure by the United States government is subject to the restrictions set forth in DFARS 252.227-7013(c)(1)(ii) and FAR 52.227-19.
Liability Disclaimer
Aprisma Management Technologies, Inc. (“Aprisma”) reserves the right to make changes in specifications and other information contained in this document without prior notice. In all cases, the reader should contact Aprisma to inquire if any changes have been made.
The hardware, firmware, or software described in this manual is subject to change without notice.
IN NO EVENT SHALL APRISMA, ITS EMPLOYEES, OFFICERS, DIRECTORS, AGENTS, OR AFFILIATES BE LIABLE FOR ANY INCIDENTAL, INDIRECT, SPECIAL, OR CONSEQUENTIAL DAMAGES WHATSOEVER (INCLUDING BUT NOT LIMITED TO LOST PROFITS) ARISING OUT OF OR RELATED TO THIS MANUAL OR THE
INFORMATION CONTAINED IN IT, EVEN IF APRISMA HAS BEEN ADVISED OF, HAS KNOWN, OR SHOULD HAVE KNOWN, THE POSSIBILITY OF SUCH DAMAGES.
Trademark, Service Mark, and Logo Information
SPECTRUM, IMT, and the SPECTRUM IMT/VNM logo are registered trademarks of Aprisma Management Technologies, Inc., or its affiliates. APRISMA, APRISMA MANAGEMENT TECHNOLOGIES, the APRISMA MANAGEMENT TECHNOLOGIES logo, MANAGE WHAT MATTERS, DCM, VNM, SpectroGRAPH, SpectroSERVER, Inductive Modeling Technology, Device Communications Manager, SPECTRUM Security Manager, and Virtual Network Machine are unregistered trademarks of Aprisma Management Technologies, Inc., or its affiliates. For a complete list of Aprisma trademarks, service marks, and trade names, go to
http://www.aprisma.com/manuals/trademark-list.htm.
All referenced trademarks, service marks, and trade names identified in this document, whether registered or unregistered, are the intellectual property of their respective owners. No rights are granted by Aprisma Management Technologies, Inc., to use such marks, whether by implication, estoppel, or otherwise. If you have comments or concerns
about trademark or copyright references, please send an e-mail to [email protected]; we will do our best to help.
Restricted Rights Notice
(Applicable to licenses to the United States government only.) This software and/or user documentation is/are provided with
RESTRICTED AND LIMITED RIGHTS. Use, duplication, or disclosure by the government is subject to restrictions as set forth in FAR 52.227-14 (June 1987) Alternate III (g)(3) (June 1987), FAR 52.227-19 (June 1987), or DFARS 52.227-7013 (c)(1)(ii) (June 1988), and/or in similar or successor clauses in the FAR or DFARS, or in the DOD or NASA FAR Supplement, as applicable. Contractor/manufacturer is Aprisma Management Technologies, Inc. In the event the government seeks to obtain the software pursuant to standard commercial practice, this software agreement, instead of the noted regulatory clauses, shall control the terms of the government's license.
Virus Disclaimer
Aprisma makes no representations or warranties to the effect that the licensed software is virus-free.
Aprisma has tested its software with current virus-checking technologies. However, because no anti-virus system is 100 percent effective, we strongly recommend that you write-protect the licensed software and verify (with an anti-virus system in which you have confidence) that the licensed software, prior to installation, is virus-free.
Contact Information
Aprisma Management Technologies, Inc. 273 Corporate Drive
Portsmouth, NH 03801
Phone: 603.334.2100 U.S. toll-free: 877.468.1448
Contents
INTRODUCTION 5
Purpose and Scope ...5
Required Reading ...5
Supported Devices...6
The SPECTRUM Model ...7
TASKS 9 DEVICE VIEW 10 Interface Icons ...11
Interface Icon Subviews Menu ...12
Secondary Address Panel ...13
DEVICE TOPOLOGY VIEW 14 APPLICATION VIEWS 15 Main Application View ...15
Supported Applications ...16
Common Applications...16
Device-Specific MIBs...17
Device-Specific Applications ...18
PERFORMANCE VIEWS 19 CONFIGURATION VIEWS 20 Device Configuration View... 20
Client Configuration View... 21
HOST SYSTEM HEALTH 22 CPU Health Information View ... 23
CPU Fault Statistics View... 25
CPU Interrupts View... 26
CPU I/O Statistics View... 27
CPU Miscellaneous Information View ... 29
CPU Page Statistics View ... 31
CPU Process In States Group View... 33
CPU Process Statistics View... 33
CPU Register Window Statistics View ... 34
CPU System Calls View ... 35
CPU Utilization Times View... 38
File System Information View ... 39
NFS Client Information (BASIC) ... 39
RPC Client View ... 40
NFS Server Information (BASIC) ... 40
NFS File System View (AMS) ... 41
Disk Transactions View (AMS) ... 42
UFS File System (AMS) ... 42
File & Scan Information View (AMS) ... 43
Disk Service Times View (AMS)... 43
VXFS File System View (AMS) ... 44
C o n t e n t s C o n t e n t s
Link Information Statistics View (AMS)...45
Queue Cache Group View (AMS) ...45
Qband Cache Group View (Basic) ...46
Stream Head Cache Group View (BASIC) ...46
Streams Event Cache Statistics View (BASIC) ...47
Streams Msg Group View (BASIC) ...47
Syncq Cache Group View (Basic) ...48
Physical Memory (BASIC) ...48
Ram Mem Paging (BASIC)...48
System Information View ...49
Load Averages (BASIC) ...49
User Information (AMS)...49
Swap Space Statistics (BASIC)...49
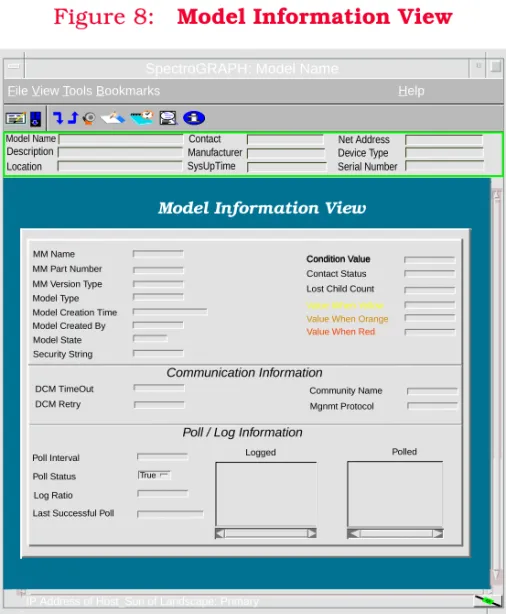
MODEL INFORMATION VIEW 51
Introduction
This section introduces the SPECTRUM Device Management documentation for the Sun Management Center Agent.
This introduction contains the following topics: • Purpose and Scope
• Required Reading
• Supported Devices (Page 6) • The SPECTRUM Model (Page 7)
Purpose and Scope
Use this document as a guide for managing the Sun Management Center Agent devices described on Page 6 with SPECTRUM management module SM-SUN1000. This document describes the icons, menus, and views that enable you to remotely monitor, configure, and troubleshoot Sun Management Center Agent devices through software models in your SPECTRUM database. Information specific to SM-SUN1000 is what is primarily included in this document. For general information about device management using SPECTRUM and explanations of SPECTRUM
functionality and navigation techniques, refer to
the topics listed under Required Reading.
Required Reading
To use this documentation effectively, you must be familiar with the information covered by the other SPECTRUM online documents listed below.
• Getting Started with SPECTRUM for Operators
• Getting Started with SPECTRUM for Administrators
• How to Manage Your Network with SPECTRUM
• SPECTRUM Views • SPECTRUM Menus • SPECTRUM Icons
I n t r o d u c t i o n S u p p o r t e d D e v i c e s
Supported Devices
SPECTRUM management module SM-SUN1000 currently lets you model Sun workstations running the Sun Management Center Agent. There are three individual packages of the Sun Management Center:
• Basic Package
- Provides basic hardware management and
monitoring.
• Advanced Systems Monitoring
- Provides full kernel reader functionality,
Solaris health monitoring, file system monitoring, directory size monitoring, process monitoring, and log viewing. • Premier Management Applications
- Provides a web interface to the Sun
Management Center Agent, group operations, modules configuration propagation, a command line interface, import/export data functionality, and data view.
This management module supports all three packages. The views and information you will be able to see depend on which package they have installed on their system. With the Basic package
installed, you will be able to see the views labeled
“BASIC” in the Host System Health (Page 22)
section. If either the Advanced Systems Monitoring or the Premier Management
Applications packages are installed, you will be able to see the views labeled “ASM” in addition to those available in the Basic package.
Note:
Note:
The current version of SM-SUN1000 does not allow you to launch the Sun Management Center Console. It also currently supports only those devices that have the Sun Management Center Agent running. It is anticipated that later versions of SPECTRUM will support other Sun devices and agents as well as the ability to launch the console.
I n t r o d u c t i o n T h e S P E C T R U M M o d e l
The SPECTRUM Model
The model type for the Sun Management Center Agent devices is Host_Sun.
Modeling results in the creation of Device icons that represent the devices and Application icons that represent their supported applications. The Device icons contain double-click zones and provide access to Icon Subviews menus that let you perform device management activities such
as those listed in Tasks on Page 9.
As Figure 1 shows, the appearance of the Device icons varies slightly depending on the kind of view it appears in.
Figure 1: Device Icons
The device-specific Icon Subviews menu options available from the Device icon are listed below.
The rest of this document covering management module SM-SUN1000 is organized as follows:
Model Name SunMC
Model Name
SunMC Small Device icon appears in Topology and Application views
Large Device icon appears in Device Topology, Location, and Device Interface views.
Option Accesses the...
Fault Management Opens the Fault Management
View. For information on this,
refer to How to Manage Your
Network with SPECTRUM.
Device Device View (Page 10)
DevTop Device Topology View (Page 14)
Application Application Views (Page 15)
Configuration Configuration Views (Page 20)
Host System Health Host System Health (Page 22)
Sun MC Web
Interface > Configure
Client Configuration View
(Page 21) Sun MC Web
Interface > Launch
Sun Management Center Web Interface. This element manager allows you to monitor the Host_Sun device online.
Model Information Model Information View (Page 51)
Primary Application Menu option that lets you select
I n t r o d u c t i o n T h e S P E C T R U M M o d e l
• Tasks (Page 9)
• Device View (Page 10)
• Device Topology View (Page 14) • Application Views (Page 15) • Performance Views (Page 19) • Configuration Views (Page 20) • Host System Health (Page 22) • Model Information View (Page 51).
Tasks
This section contains an alphabetical list of device management tasks, with each task providing one or more links to views that let you perform the task.
Administrative Information (check)
• Model Information View (Page 51)Alarm Thresholds (set)
• Interface Icon Subviews Menu (Page 12)
Configuration Information (check)
• Configuration Views (Page 20)
CPU Faults Statistics (check)
• CPU Fault Statistics View (Page 25)
Host System Health (check)
• CPU Health Information View (Page 23) • File System Information View (Page 39) • System Memory Information View (Page 45) • System Information View (Page 49)
IP Address (find/change)
• Device View (Page 10)• Secondary Address Panel (Page 13)
Network Type (check)
• Network Type Label (Page 12)
Performance (check)
• Device View (Page 10) • Interface Icons (Page 11) • Performance Views (Page 19)
Process Information (check)
• CPU Health Information View (Page 23)
• CPU Miscellaneous Information View (Page 29)
Topology (check)
• Device Topology View (Page 14)
SMC Web Interface (configure)
Device View
This section describes the Device view and subviews available for models of Sun Management Center Agent devices in SPECTRUM.
Access: From the Icon Subviews menu for the Device icon, select Device.
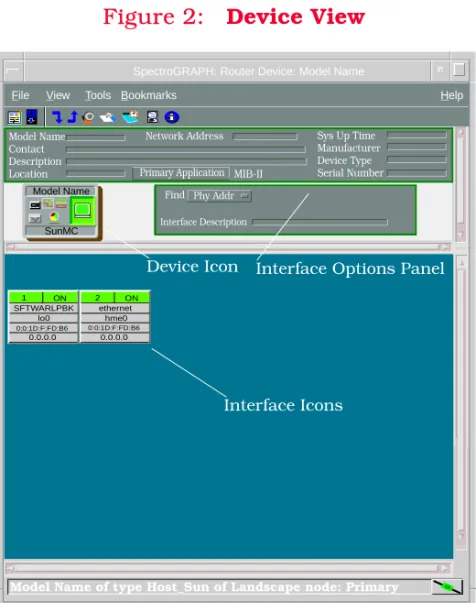
This view (Figure 2) uses icons and labels to
represent the device and its components, such as modules, ports, and applications. The view
provides dynamic configuration and performance information for each of the device’s serial and network I/O ports, which are represented by Interface icons in the bottom panel of the view. The middle panel of the view displays a Device icon, which lets you monitor the device operation and access other device-specific views.
Figure 2: Device View
SpectroGRAPH: Router Device: Model Name
File View Tools Help
Model Name Contact Description Location
Sys Up Time Manufacturer Device Type Serial Number Network Address
Interface Description Find Phy Addr
Interface Options Panel Device Icon
SunMC Model Name
1 SFTWARLPBK
0:0:1D:F:FD:B6
lo0 0.0.0.0
ON 2 ethernet
hme0 0.0.0.0 ON
Interface Icons
Bookmarks
Model Name of type Host_Sun of Landscape node: Primary Primary Application MIB-II
D e v i c e V i e w I n t e r f a c e I c o n s
Interface Icons
Figure 3 shows a close-up of an Interface icon from the Device view. Most of the informational labels on the icon also provide double-click access to other views, as explained in the following label descriptions.
Figure 3: Interface Icon
Interface Number Label
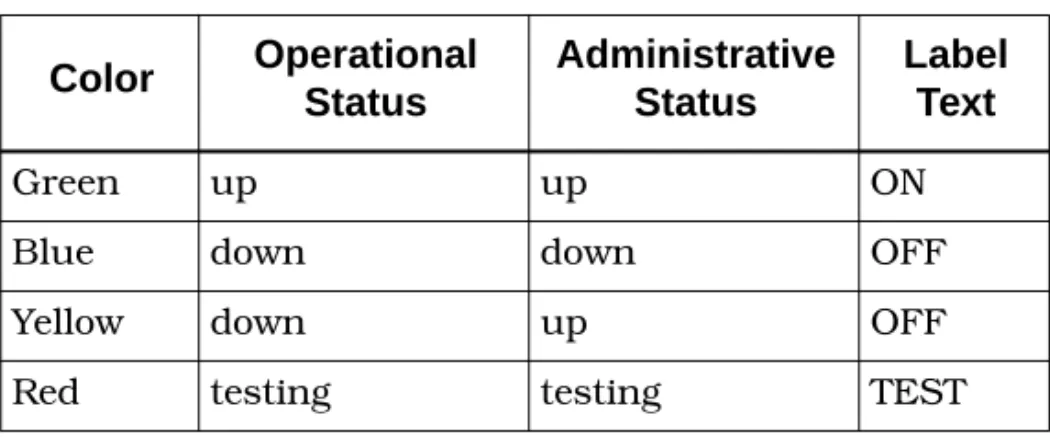
This label displays the interface (port) number. IF Status Label
This label displays the current status of the interface for the primary application selected,
e.g., MIB-II App. Table 1 lists the possible label
color representations. Note that the color of the label also depends on the interface’s current Administrative Status, which you set in the Interface Configuration view. This view can be accessed by double-clicking the Interface Type label.
Interface Type Label
This label identifies the interface type (Ethernet, ATM, etc.). Double-click this label to access the
Interface Configuration view, see the SPECTRUM
Views documentation.
c
f b
1
ethernet
0:0:1D:F:FD:B6 a
a Interface Number Label
b IF Status Label
c Interface Type Label
d Network Type Label
e Physical Address Label
f IP Address Label fxp0 0.0.0.0
d e ON
Table 1: Interface Status Label Colors
Color Operational Status
Administrative Status
Label Text
Green up up ON
Blue down down OFF
Yellow down up OFF
D e v i c e V i e w I n t e r f a c e I c o n S u b v i e w s M e n u
Network Type Label
This label identifies the type of network to which the interface is connected. Double-click the label to open the Model Information view for the
interface.
Physical Address Label
This label displays the physical (MAC) address of the interface. Double-click this label to open the IF Address Translation Table.
IP Address Label
This label displays the IP address for the interface. Double-click this label to open the
Secondary Address Panel (Page 13), which lets you change the address and mask for the interface.
Interface Icon Subviews Menu
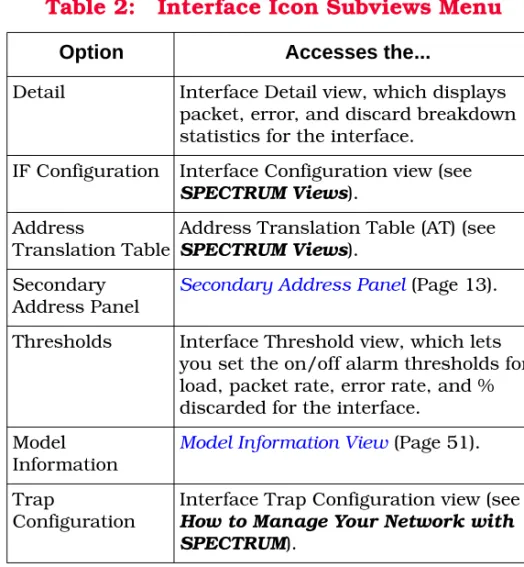
Table 2 lists the device-specific interface Icon Subviews menu options and the views to which they provide access.
Table 2: Interface Icon Subviews Menu
Option Accesses the...
Detail Interface Detail view, which displays
packet, error, and discard breakdown statistics for the interface.
IF Configuration Interface Configuration view (see
SPECTRUM Views). Address
Translation Table
Address Translation Table (AT) (see
SPECTRUM Views). Secondary
Address Panel
Secondary Address Panel (Page 13).
Thresholds Interface Threshold view, which lets
you set the on/off alarm thresholds for load, packet rate, error rate, and % discarded for the interface.
Model Information
Model Information View (Page 51).
Trap
Configuration
Interface Trap Configuration view (see
How to Manage Your Network with SPECTRUM).
D e v i c e V i e w S e c o n d a r y A d d r e s s P a n e l
Secondary Address Panel
Access: From the Icon Subviews menu for the Interface icon in the Device view, select Secondary Address Panel.
This panel provides a table of IP addresses and masks obtained from the Address Translation table within the device’s firmware. You can
change the current address displayed in the IP
Address field by selecting an entry from the table
Device Topology View
This section describes the Device Topology view available for models of the Sun Management Center Agent devices.
Access: From the Icon Subviews menu for the Device icon, select Device Topology.
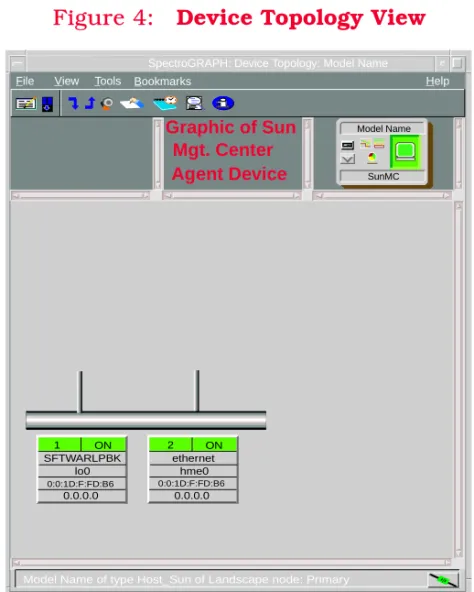
The Device Topology view (Figure 4) shows the
connections between a modeled device and other network entities. The lower panel of the view uses Interface icons to represent the device’s serial, network, and I/O ports. These icons provide the same information and menu options as those in the Device View (Page 10). If a device is connected to a particular interface, a Device icon appears on the vertical bar above the Interface icon along with an icon representing the network group that contains the device.
Refer to the SPECTRUM Views documentation for
details on Device Topology view.
Figure 4: Device Topology View
File View Tools Help
SunMC Model Name
Bookmarks
SpectroGRAPH: Device Topology: Model Name
Graphic of Sun Mgt. Center
Model Name of type Host_Sun of Landscape node: Primary
Agent Device
1 SFTWARLPBK
0:0:1D:F:FD:B6
lo0 0.0.0.0
ON 2
ethernet hme0 0.0.0.0 ON
Application Views
This section describes the main Application view available for models of Sun Management Center Agent devices in SPECTRUM.
Access: From the Icon Subviews menu for the Device icon, select Application.
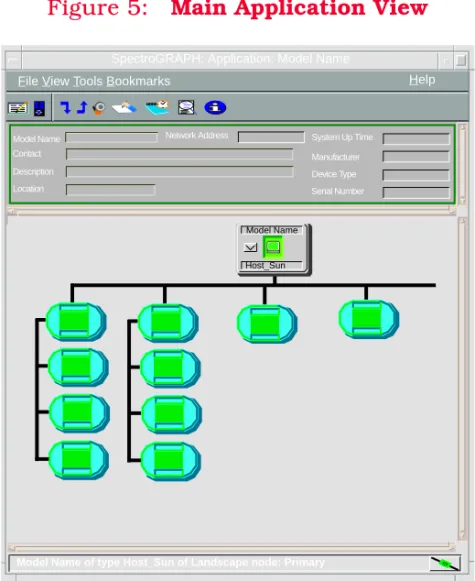
Main Application View
When a device model is created, SPECTRUM automatically creates models for each of the major and minor applications supported by the device. The main Application view identifies all of these application models, shows their current condition status, and provides access to
application-specific subviews. Figure 5 shows this
view in the Icon mode. If you prefer the List mode, which displays applications as text labels, select View > Mode > List.
For more information on this view, refer to the
MIBs and the Application View documentation.
Figure 5: Main Application View
SpectroGRAPH: Application: Model Name
Model Name Contact Description Location
Network Address System Up Time Manufacturer Device Type Serial Number
Model Name
6E132_25 Model Name
Host_Sun
File View Tools Bookmarks
Model Name of type Host_Sun of Landscape node: Primary
A p p l i c a t i o n V i e w s S u p p o r t e d A p p l i c a t i o n s
Supported Applications
SPECTRUM’s applications can be grouped within two general categories as follows:
• Applications associated with non proprietary
MIBs. See Common Applications below.
• Applications associated with device-specific
MIBs. See Device-Specific MIBs (Page 17).
Common Applications
For the most part, these applications represent the non proprietary MIBs supported by your device. Listed below (beneath the title of the SPECTRUM document that describes them) are some of the common applications currently supported by SPECTRUM.
• Routing Applications
- Generic Routing
- Repeater
- AppleTalk
- DECnet
- OSPF
- OSPF2
- BGP4
- VRRP
- RFC 2932
• Bridging Applications
- Ethernet Special Database
- Spanning Tree
- Static
- Transparent
- PPP Bridging
- Source Routing
- Translation
- QBridge
• MIB II Applications
- SNMP
- IP
- ICMP
- TCP
- System2
- UDP
• Transmission Applications
- FDDI
- Point to Point
- DS1
- DS3
- RS-232
Note:
Note:
The documents listed below (in bold font) are available for viewing at:
A p p l i c a t i o n V i e w s S u p p o r t e d A p p l i c a t i o n s
- WAN
- Frame Relay
- Token Ring
- Ethernet
- Fast Ethernet
- RFC 1317App
- RFC 1285App
- RFC 1315App
- 802.11App
- SONET
• Technology Applications
- APPN
- ATM Client
- DHCP
- DLSw
- PNNI
- RFC 1316App
- RFC 1514
- RFC 2287
- RFC 2790
- RFC 2925
• DOCSIS Applications
- DOCSISCblDvApp
- DOCSISQOSApp
- DOCSISBPI2App
- DOCSISBPIApp
- DOCSISIFApp
• Digital Subscriber Line (DSL) Applications
- ADSL
Device-Specific MIBs
SPECTRUM imports the following device-level proprietary MIBs into its database:
• file-scan.mib
• health-monitor-mib.mib • kernel-reader-mib.mib • nfsmon-mib.mib
• nfsstat-mib.mib • print-spool-mib.mib • process-details-mib.mib • process-monitor.mib • trap-mib.mib
These MIBs can be used in conjunction with SPECTRUM’s optional customization products (referred to as the Level I Tool Kits) to create application models and views that display the condition of selected MIB objects.
A p p l i c a t i o n V i e w s S u p p o r t e d A p p l i c a t i o n s
Device-Specific Applications
SPECTRUM management module SM-SUN1000 currently does not support any device-specific applications.
Note:
Note:
Aprisma Management Technologies can provide training, technical assistance, and custom engineering support services for creating
application models and their associated views.
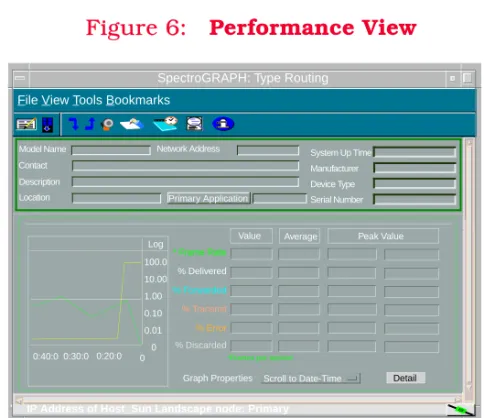
Performance Views
This section introduces the Performance view. For details concerning this view, refer to the SPECTRUM Views documentation.
Performance views display performance statistics in terms of a set of transmission attributes, e.g., cell rates, frame rates, % error, etc. A typical view
is shown in Figure 6. The instantaneous
condition of each transmission attribute is recorded in a graph. The statistical information for each attribute is presented in the adjacent table.
Generally, you determine performance at the device level through Performance views accessed from the Device and Application icons. You
determine performance at the port/interface level through Performance views accessed from
Interface icons.
Figure 6: Performance View
SpectroGRAPH: Type Routing
Model Name Contact Description Location
Network Address System Up Time Manufacturer Device Type Serial Number Log
100.0 10.00 1.00 0.10 0.01 0 0 0:40:0 0:30:0 0:20:0
Value Average Peak Value
* Frame Rate
% Delivered
% Forwarded % Transmit
% Error
Detail
Graph Properties Scroll to Date-Time
File View Tools Bookmarks
% Discarded
*Frames per second
IP Address of Host_Sun Landscape node: Primary
Configuration Views
This section describes the various Configuration views available for models of the Sun Management Center Agent devices in SPECTRUM.
Configuration views let you see and modify current settings for the modeled device and its interfaces, ports, and applications. The following Configuration views are available for models of Sun Management Center Agent devices:
• Device Configuration View (Page 20) • Client Configuration View (Page 21)
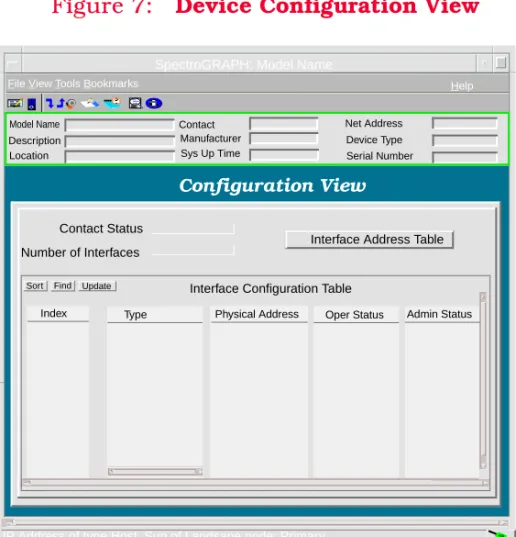
Device Configuration View
Access: From the Icon Subviews menu for the Device icon, select Configuration.
A typical Device Configuration view is shown in
Figure 7. Generally, this view includes a few fields that display device information as well as an Interface Configuration Table that lists interface parameters, some of which can be changed (see
SPECTRUM Views). Some Device Configuration views include one or more buttons that provide access to device-specific configuration
information.
Figure 7: Device Configuration View
SpectroGRAPH: Model Name
Model Name
File View Tools Bookmarks Help
Description Location
Contact Manufacturer Sys Up Time
Net Address Device Type Serial Number
Configuration View
Contact Status Number of Interfaces
Interface Address Table Sort Interface Configuration Table
Index Type Physical Address Oper Status Admin Status
IP Address of type Host_Sun of Landsape node: Primary
C o n f i g u r a t i o n V i e w s C l i e n t C o n f i g u r a t i o n V i e w
Client Configuration View
Access: From the Icon Subviews menu for the Device icon, select SMC Web Interface > Configure.
This view allows you to enter the host name and port number of the web server running the Sun Management Center (SMC) software. This allows you to configure SPECTRUM so when you select the SMC Web Interface option, it will connect you to the appropriate host and TCP IP port number. Host Name
The system name where Sun Management Center is running.
TCP Port Number
The TCP IP port number to which the PC is connected.
Host System Health
This section describes the various Host System Health views available for models of the Sun Management Center Agent devices in SPECTRUM.
Host System Health views and subviews let you view system health information for the modeled device. The following Host System Health views are available for models of Sun Management
Center Agent devices (see Supported Devices on
Page 6 for more information about the Sun Management Center Agent):
• CPU Health Information View (Page 23) • File System Information View (Page 39) • System Memory Information View (Page 45) • System Information View (Page 49)
Views labeled “BASIC” in this section can be seen if you have the Basic package installed. If either the Advanced Systems Monitoring or the Premier Management Applications packages are installed, you will be able to see the views labeled “ASM” in addition to those available in the Basic package.
Note:
Note:
Double-clicking on a table entry in most Host System Health views accesses a single screen view
containing all the information for that table entry. This is so you don’t have to scroll to the right in tables with many columns.
H o s t S y s t e m H e a l t h C P U H e a l t h I n f o r m a t i o n V i e w
CPU Health Information View
Access: From the Icon Subviews menu for the Device icon, select Host System Health > CPU.
This view contains a Process Table and button access to CPU health subviews. The table and buttons are described below.
The Process Table shows monitoring information for processes running on the host. Each row in this table corresponds to a process. This table contains the following information.
UserId
The user ID of the process owner. ProcessID
The process ID of the process.
ParentProcessID
The parent process ID of the process. StartTime
The starting time of the process, given in hours, minutes, and seconds.
ControlTTY
The controlling terminal for the process. When there is no controlling terminal, this value will be “?”.
ExecutionTime
The cumulative execution time for the process. Address
The memory address of the process. Command
The command name by which the process was started.
CommandLine
The full command line, with command
arguments, by which the process was started. EgroupID
The effective group ID of the process. EUserID
The effective user ID of the process. GroupID
The group ID of the process owner.
Note:
Note:
While the CPU Health Information view containing the Process Table is available to users with the Basic package of the Sun Management Center installed, its button-accessed subviews are only available if either the Advanced Systems Monitoring or the Premier Management Applications packages are installed.
H o s t S y s t e m H e a l t h C P U H e a l t h I n f o r m a t i o n V i e w
Nice
Nice value, used in computing priority. Only processes in the time-sharing class have a value for nice.
PercentCPUTime
Percent of CPU time being consumed by the process.
PercentMemory
Percent of memory being consumed by the process.
Priority
The priority of the process. Higher numbers mean higher priority.
ProcessGroupID
Process group ID of the process. SchedulingClass
Scheduling class of the process. SessionID
Session ID of the process. Size
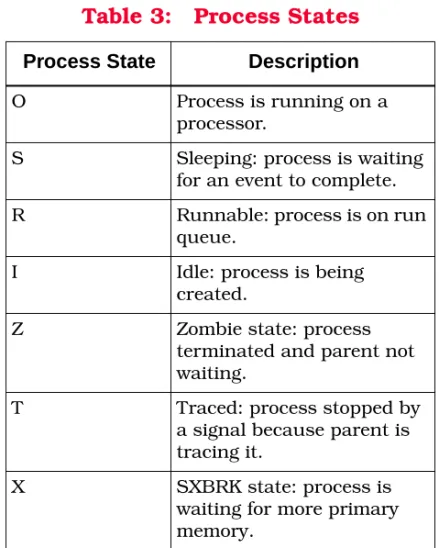
The image size (in number of pages) of the swappable process in the main memory. State
The state of the process as shown in Table 3.
UserName
The user ID of the process owner. This is the login name of the process owner.
Table 3: Process States
Process State Description
O Process is running on a
processor.
S Sleeping: process is waiting
for an event to complete.
R Runnable: process is on run
queue.
I Idle: process is being
created.
Z Zombie state: process
terminated and parent not waiting.
T Traced: process stopped by
a signal because parent is tracing it.
X SXBRK state: process is
waiting for more primary memory.
H o s t S y s t e m H e a l t h C P U H e a l t h I n f o r m a t i o n V i e w
WaitChannel
The address of an event for which the process is sleeping, or in SXBRK state. If the process is running, this value is blank.
CPU Fault Statistics View
This button opens the CPU Fault Statistics view. The following fields appear in this view.
Instance
The CPU number. Minor hat_faults
The rate of the number of minor page faults via hat_fault(). The number of minor page faults via hat_fault() is calculated at different times, either when the refresh interval is reached or when a manual refresh is issued. If at time T1 the value is X and at time T2 the value is Y then this field returns a value equal to (Y - X)/(T2 - T1). Minor as_faults
The rate of the number of minor page faults via as_fault(). The number of minor page faults via as_fault() is calculated at different times, either when the refresh interval is reached or when a manual refresh is issued. If at time T1 the value is
X and at time T2 the value is Y then this field returns a value equal to (Y - X)/(T2 - T1). Major Page
The rate of the number of major page faults. The number of major page faults is calculated at different times, either when the refresh interval is reached or when a manual refresh is issued. If at time T1 the value is X and at time T2 the value is Y then this field returns a value equal to (Y - X)/(T2 - T1).
CopyOnWrite
The rate of the number of copy-on-write faults. The number of copy-on-write faults is calculated at different times, either when the refresh interval is reached or when a manual refresh is issued. If at time T1 the value is X and at time T2 the value is Y then this field returns a value equal to (Y - X)/(T2 - T1).
Protection
The rate of the number of protection faults. The number of protection faults is calculated at
different times, either when the refresh interval is reached or when a manual refresh is issued. If at time T1 the value is X and at time T2 the value is Y then this field returns a value equal to (Y - X)/(T2 - T1).
H o s t S y s t e m H e a l t h C P U H e a l t h I n f o r m a t i o n V i e w
SW Lock
The rate of the number of faults due to software locking req. The number of faults is calculated at different times, either when the refresh interval is reached or when a manual refresh is issued. If at time T1 the value is X and at time T2 the value is Y then this field returns a value equal to (Y - X)/(T2 - T1).
as_Faults
The rate of number of as_faults() in kernel addr space. The number of as_faults() in kernel addr space is calculated at different times, either when the refresh interval is reached or when a manual refresh is issued. If at time T1 the value is X and at time T2 the value is Y then this field returns a value equal to (Y - X)/(T2 - T1).
CPU Interrupts View
This button opens the CPU Interrupts view. The following fields appear in this view.
Instance
The CPU number. Context Switches
The rate of the number of context switches. The number of context switches is calculated at
different times, either when the refresh interval is reached or when a manual refresh is issued. If at time T1 the value is X and at time T2 the value is Y then this field returns a value equal to (Y - X)/(T2 - T1).
Traps
The rate of the number of traps. The number of traps is calculated at different times, either when the refresh interval is reached or when a manual refresh is issued. If at time T1 the value is X and at time T2 the value is Y then this field returns a value equal to (Y - X)/(T2 - T1).
Device
The rate of the number of device interrupts. The number of device interrupts is calculated at different times, either when the refresh interval is reached or when a manual refresh is issued. If at time T1 the value is X and at time T2 the value is Y then this field returns a value equal to (Y - X)/(T2 - T1).
Threads
The rate of the number of interrupts as threads. The number of interrupts as threads is calculated at different times, either when the refresh interval is reached or when a manual refresh is issued. If at time T1 the value is X and at time T2 the value is Y then this field returns a value equal to (Y - X)/(T2 - T1).
H o s t S y s t e m H e a l t h C P U H e a l t h I n f o r m a t i o n V i e w
Locked Preempted Released
The rate of the number of interrupts locked, preempted, or released. The number of interrupts locked, preempted, or released is calculated at different times, either when the refresh interval is reached or when a manual refresh is issued. If at time T1 the value is X and at time T2 the value is Y then this field returns a value equal to (Y - X)/(T2 - T1).
CPU I/O Statistics View
This button opens the CPU I/O Statistics view. The following fields appear in this view.
Instance
The CPU number. Phy Blks Read
The rate of the number of physical blocks read. The number of physical blocks read is calculated at different times, either when the refresh interval is reached or when a manual refresh is issued. If at time T1 the value is X and at time T2 the value is Y then this field returns a value equal to (Y - X)/(T2 - T1).
Phy Blks Write
The rate of the number of physical blocks written (sync or async). The number of physical blocks written is calculated at different times, either when the refresh interval is reached or when a manual refresh is issued. If at time T1 the value is X and at time T2 the value is Y then this field returns a value equal to (Y - X)/(T2 - T1). Log Blks Read
The rate of the number of logical blocks read. The number of logical blocks read is calculated at different times, either when the refresh interval is reached or when a manual refresh is issued. If at time T1 the value is X and at time T2 the value is Y then this field returns a value equal to (Y - X)/(T2 - T1).
Log Blocks Write
The rate of the number of logical blocks written. The number of logical blocks written is calculated at different times, either when the refresh interval is reached or when a manual refresh is issued. If at time T1 the value is X and at time T2 the value is Y then this field returns a value equal to (Y - X)/(T2 - T1).
Raw I/O Reads
The rate of the cumulative number of raw I/O reads. The cumulative number of raw I/O reads is calculated at different times, either when the I/O Statistics
H o s t S y s t e m H e a l t h C P U H e a l t h I n f o r m a t i o n V i e w
refresh interval is reached or when a manual refresh is issued. If at time T1 the value is X and at time T2 the value is Y then this field returns a value equal to (Y - X)/(T2 - T1).
Raw I/O Writes
The rate of the cumulative number of raw I/O writes. The cumulative number of raw I/O writes is calculated at different times, either when the refresh interval is reached or when a manual refresh is issued. If at time T1 the value is X and at time T2 the value is Y then this field returns a value equal to (Y - X)/(T2 - T1).
Bytes Read
The rate of the number of bytes read by rdwr(). The number of bytes read by rdwr() is calculated at different times, either when the refresh interval is reached or when a manual refresh is issued. If at time T1 the value is X and at time T2 the value is Y then this field returns a value equal to (Y - X)/(T2 - T1).
Bytes Written
The rate of the number of bytes written by rdwr(). The number of bytes written by rdwr() is
calculated at different times, either when the refresh interval is reached or when a manual refresh is issued. If at time T1 the value is X and at time T2 the value is Y then this field returns a value equal to (Y - X)/(T2 - T1).
Term Input Chars
The rate of the number of terminal input characters. The number of terminal input
characters is calculated at different times, either when the refresh interval is reached or when a manual refresh is issued. If at time T1 the value is X and at time T2 the value is Y then this field returns a value equal to (Y - X)/(T2 - T1). Canonical Mode Chars
The rate of the number of characters handled in canonical mode. The number of characters handled in canonical mode is calculated at
different times, either when the refresh interval is reached or when a manual refresh is issued. If at time T1 the value is X and at time T2 the value is Y then this field returns a value equal to (Y - X)/(T2 - T1).
Term Output Chars
The rate of the number of terminal output characters. The number of terminal output characters is calculated at different times, either when the refresh interval is reached or when a manual refresh is issued. If at time T1 the value is X and at time T2 the value is Y then this field returns a value equal to (Y - X)/(T2 - T1). Phy Blks Async Write
The rate of the number of asynchronous physical block writes. The number of asynchronous
H o s t S y s t e m H e a l t h C P U H e a l t h I n f o r m a t i o n V i e w
physical block writes is calculated at different times, either when the refresh interval is reached or when a manual refresh is issued. If at time T1 the value is X and at time T2 the value is Y then this field returns a value equal to (Y - X)/(T2 - T1).
CPU Miscellaneous Information
View
This button opens the CPU Miscellaneous
Information view. A Process Information table and the following fields appear in this view.
CPUs
Total number of CPUs. Running
Number of processes in the run queue. Waiting
Number of processes blocked for resources. Swapped
Number of processes runnable but swapped. Spins on Mutexes
The sum of spins on mutexes (where a lock is not acquired on the first try) for all CPUs.
Instance
The CPU number. Context Switches
The rate of the number of context switches. The number of context switches is calculated at
different times, either when the refresh interval is reached or when a manual refresh is issued. If at time T1 the value is X and at time T2 the value is Y then this field returns a value equal to (Y - X)/(T2 - T1).
thread_creates
The rate of the number of thread_create() calls. The number of thread_create() calls is calculated at different times, either when the refresh interval is reached or when a manual refresh is issued. If at time T1 the value is X and at time T2 the value is Y then this field returns a value equal to (Y - X)/(T2 - T1).
Migrations
The rate of the number of CPU migrations by threads. The number of CPU migrations by threads is calculated at different times, either when the refresh interval is reached or when a manual refresh is issued. If at time T1 the value is X and at time T2 the value is Y then this field returns a value equal to (Y - X)/(T2 - T1). Misc Info
H o s t S y s t e m H e a l t h C P U H e a l t h I n f o r m a t i o n V i e w
Xcalls
The rate of the number of xcalls to other CPU. The number of xcalls to other CPU is calculated at different times, either when the refresh interval is reached or when a manual refresh is issued. If at time T1 the value is X and at time T2 the value is Y then this field returns a value equal to (Y - X)/(T2 - T1).
Failed Mutex Calls
The rate of the number of failed mutex enters. The number of failed mutex enters is calculated at different times, either when the refresh interval is reached or when a manual refresh is issued. If at time T1 the value is X and at time T2 the value is Y then this field returns a value equal to (Y - X)/(T2 - T1).
RW Reader Fails
The rate of the number of rw reader failures. The number of rw reader failures is calculated at different times, either when the refresh interval is reached or when a manual refresh is issued. If at time T1 the value is X and at time T2 the value is Y then this field returns a value equal to (Y - X)/(T2 - T1).
RW Writer Fails
The rate of the number of rw writer failures. The number of rw writer failures is calculated at different times, either when the refresh interval is
reached or when a manual refresh is issued. If at time T1 the value is X and at time T2 the value is Y then this field returns a value equal to (Y - X)/(T2 - T1).
Module Loads
The rate of the number of times loadable modules loaded. The number of times loadable modules loaded is calculated at different times, either when the refresh interval is reached or when a manual refresh is issued. If at time T1 the value is X and at time T2 the value is Y then this field returns a value equal to (Y - X)/(T2 - T1). Module Unloads
The rate of the number of times loadable modules unloaded. The number of times loadable modules unloaded is calculated at different times, either when the refresh interval is reached or when a manual refresh is issued. If at time T1 the value is X and at time T2 the value is Y then this field returns a value equal to (Y - X)/(T2 - T1). RW Lock Tries
The rate of the number of tries to acquire rw lock. The number of tries to acquire rw lock is
calculated at different times, either when the refresh interval is reached or when a manual refresh is issued. If at time T1 the value is X and at time T2 the value is Y then this field returns a value equal to (Y - X)/(T2 - T1).
H o s t S y s t e m H e a l t h C P U H e a l t h I n f o r m a t i o n V i e w
CPU Page Statistics View
This button opens the CPU Page Statistics view. The following fields appear in this view.
Instance
The CPU number. Page Reclaims
The rate of the number of page reclaims including pageout. The number of page reclaims including pageout is calculated at different times, either when the refresh interval is reached or when a manual refresh is issued. If at time T1 the value is X and at time T2 the value is Y then this field returns a value equal to (Y - X)/(T2 - T1). Free List Reclaims
The rate of the number of page reclaims from free list. The number of page reclaims from free list is calculated at different times, either when the refresh interval is reached or when a manual refresh is issued. If at time T1 the value is X and at time T2 the value is Y then this field returns a value equal to (Y - X)/(T2 - T1).
PageIns
The rate of the number of page ins. The number of page ins is calculated at different times, either when the refresh interval is reached or when a
manual refresh is issued. If at time T1 the value is X and at time T2 the value is Y then this field returns a value equal to (Y - X)/(T2 - T1). PagedIns
The rate of the number of pages paged in. The number of pages paged in is calculated at
different times, either when the refresh interval is reached or when a manual refresh is issued. If at time T1 the value is X and at time T2 the value is Y then this field returns a value equal to (Y - X)/(T2 - T1).
PageOuts
The rate of the number of page outs. The number of page outs is calculated at different times, either when the refresh interval is reached or when a manual refresh is issued. If at time T1 the value is X and at time T2 the value is Y then this field returns a value equal to (Y - X)/(T2 - T1). PagedOut
The rate of the number of pages paged out. The number of pages paged out is calculated at
different times, either when the refresh interval is reached or when a manual refresh is issued. If at time T1 the value is X and at time T2 the value is Y then this field returns a value equal to (Y - X)/(T2 - T1).
H o s t S y s t e m H e a l t h C P U H e a l t h I n f o r m a t i o n V i e w
SwapIns
The rate of the number of swapins. The number of swapins is calculated at different times, either when the refresh interval is reached or when a manual refresh is issued. If at time T1 the value is X and at time T2 the value is Y then this field returns a value equal to (Y - X)/(T2 - T1). Swapped In
The rate of the number of pages swapped in. The number of pages swapped in is calculated at different times, either when the refresh interval is reached or when a manual refresh is issued. If at time T1 the value is X and at time T2 the value is Y then this field returns a value equal to (Y - X)/(T2 - T1).
SwapOuts
The rate of the number of swapouts. The number of swapouts is calculated at different times, either when the refresh interval is reached or when a manual refresh is issued. If at time T1 the value is X and at time T2 the value is Y then this field returns a value equal to (Y - X)/(T2 - T1). Zero Filled
The rate of the number of pages zero filled on demand. The number of pages zero filled on demand is calculated at different times, either when the refresh interval is reached or when a manual refresh is issued. If at time T1 the value is
X and at time T2 the value is Y then this field returns a value equal to (Y - X)/(T2 - T1). Freed
The rate of the number of pages freed by daemon or auto. The number of pages freed by daemon or auto is calculated at different times, either when the refresh interval is reached or when a manual refresh is issued. If at time T1 the value is X and at time T2 the value is Y then this field returns a value equal to (Y - X)/(T2 - T1).
Scanned
The rate of the number of pages examined by pageout daemons. The number of pages examined by pageout daemons is calculated at different times, either when the refresh interval is reached or when a manual refresh is issued. If at time T1 the value is X and at time T2 the value is Y then this field returns a value equal to (Y - X)/(T2 - T1). Daemon Hand Revs
The rate of the number of revolutions of the page daemon hands. The number of revolutions of the page daemon hands is calculated at different times, either when the refresh interval is reached or when a manual refresh is issued. If at time T1 the value is X and at time T2 the value is Y then this field returns a value equal to (Y - X)/(T2 - T1).
H o s t S y s t e m H e a l t h C P U H e a l t h I n f o r m a t i o n V i e w
Pager Run
The rate of the number of times pager was scheduled. The number of times pager was scheduled is calculated at different times, either when the refresh interval is reached or when a manual refresh is issued. If at time T1 the value is X and at time T2 the value is Y then this field returns a value equal to (Y - X)/(T2 - T1).
CPU Process In States Group
View
This button opens the CPU Process In States Group view. The following fields appear in this view.
Number of CPUs
Total number of CPUs. Proc Blocked
Number of processes blocked for resources. Proc In Run Queue
Number of processes in the run queue. Proc Ready In Swap
Number of processes runnable but swapped.
CPU Process Statistics View
This button opens the CPU Process Statistics view. The following fields appear in this view. Row Status
The row status. Entry Name
The process entry name that is unique within the table. This name represents process(es) grouped depending upon process user id and regular expressions for process command name and process argument.
Command NameRX
The process command name regular expression pattern. This is used as a filter expression to select the processes having a command name matching this expression.
ArgumentRX
The process argument regular expression pattern. This is used as a filter expression to select the processes which have an argument that matches this expression.
UID spec
User ID of the process. Process States
H o s t S y s t e m H e a l t h C P U H e a l t h I n f o r m a t i o n V i e w
Entry Desc
The description of the process entry. Monitoring State
The monitoring state of the entry. The value is ON when the row entry is enabled and OFF when the row entry is disabled.
Pct CPUTime
The percent CPU used by all the processes in this group.
Command Name
The process command name. Size
The total size of all the processes in this group. RSS
The resident size of all the processes in this group.
Count
The number of the processes in this group.
CPU Register Window Statistics
View
This button opens the CPU Register Window Statistics view. The following fields appear in this view.
Instance
The CPU number. User OverFlow
The rate of the number of register window user overflows. The number of register window user overflows is calculated at different times, either when the refresh interval is reached or when a manual refresh is issued. If at time T1 the value is X and at time T2 the value is Y then this field returns a value equal to (Y - X)/(T2 - T1). User UnderFlow
The rate of the number of register window user underflows. The number of register window user underflows is calculated at different times, either when the refresh interval is reached or when a manual refresh is issued. If at time T1 the value is X and at time T2 the value is Y then this field returns a value equal to (Y - X)/(T2 - T1).
H o s t S y s t e m H e a l t h C P U H e a l t h I n f o r m a t i o n V i e w
System OverFlow
The rate of the number of register window system overflows. The number of register window system overflows is calculated at different times, either when the refresh interval is reached or when a manual refresh is issued. If at time T1 the value is X and at time T2 the value is Y then this field returns a value equal to (Y - X)/(T2 - T1). System UnderFlow
The rate of the number of register window system underflows. The number of register window
system underflows is calculated at different times, either when the refresh interval is reached or when a manual refresh is issued. If at time T1 the value is X and at time T2 the value is Y then this field returns a value equal to (Y - X)/(T2 - T1). Total OverFlow
The rate of the number of register window system user overflows. The number of register window system user overflows is calculated at different times, either when the refresh interval is reached or when a manual refresh is issued. If at time T1 the value is X and at time T2 the value is Y then this field returns a value equal to (Y - X)/(T2 - T1).
CPU System Calls View
This button opens the CPU System Calls view. The following fields appear in this view.
Instance
The CPU number. Calls
The rate of the number of system calls made. The number of system calls made is calculated at different times, either when the refresh interval is reached or when a manual refresh is issued. If at time T1 the value is X and at time T2 the value is Y then this field returns a value equal to (Y - X)/(T2 - T1).
Reads
The rate of the number of system reads using read() and readv(). The number of system reads using read() and readv() is calculated at different times, either when the refresh interval is reached or when a manual refresh is issued. If at time T1 the value is X and at time T2 the value is Y then this field returns a value equal to (Y - X)/(T2 - T1). Writes
The rate of the number of system writes using write() and writev(). The number of system writes using write() and writev() is calculated at different
H o s t S y s t e m H e a l t h C P U H e a l t h I n f o r m a t i o n V i e w
times, either when the refresh interval is reached or when a manual refresh is issued. If at time T1 the value is X and at time T2 the value is Y then this field returns a value equal to (Y - X)/(T2 - T1). Forks
The rate of the number of forks called. The number of forks called is calculated at different times, either when the refresh interval is reached or when a manual refresh is issued. If at time T1 the value is X and at time T2 the value is Y then this field returns a value equal to (Y - X)/(T2 - T1). VForks
The rate of the number of vforks called. The number of vforks called is calculated at different times, either when the refresh interval is reached or when a manual refresh is issued. If at time T1 the value is X and at time T2 the value is Y then this field returns a value equal to (Y - X)/(T2 - T1). Executions
The rate of the number of executions called. The number of executions called is calculated at different times, either when the refresh interval is reached or when a manual refresh is issued. If at time T1 the value is X and at time T2 the value is Y then this field returns a value equal to (Y - X)/(T2 - T1).
Messages
The rate of the sum of messages sent or received by msgrcv() and msgsnd(). The sum of messages sent or received by msgrcv() and msgsnd() is calculated at different times, either when the refresh interval is reached or when a manual refresh is issued. If at time T1 the value is X and at time T2 the value is Y then this field returns a value equal to (Y - X)/(T2 - T1).
Semaphores
The rate of the number of semaphore operations using the semop() call. The number of semaphore operations using the semop() call is calculated at different times, either when the refresh interval is reached or when a manual refresh is issued. If at time T1 the value is X and at time T2 the value is Y then this field returns a value equal to (Y - X)/(T2 - T1).
Pathname Lookups
The rate of the number of pathname lookups. The number of pathname lookups is calculated at different times, either when the refresh interval is reached or when a manual refresh is issued. If at time T1 the value is X and at time T2 the value is Y then this field returns a value equal to (Y - X)/(T2 - T1).
H o s t S y s t e m H e a l t h C P U H e a l t h I n f o r m a t i o n V i e w
Ufs_igets
The rate of the number of ufs_iget() calls. The number of ufs_iget() calls is calculated at different times, either when the refresh interval is reached or when a manual refresh is issued. If at time T1 the value is X and at time T2 the value is Y then this field returns a value equal to (Y - X)/(T2 - T1). Dir Blocks Read
The rate of the number of directory blocks read. The number of directory blocks read is calculated at different times, either when the refresh interval is reached or when a manual refresh is issued. If at time T1 the value is X and at time T2 the value is Y then this field returns a value equal to (Y - X)/(T2 - T1).
WAP Inodes
The rate of the number of inodes taken with attached pages. The number of inodes taken with attached pages is calculated at different times, either when the refresh interval is reached or when a manual refresh is issued. If at time T1 the value is X and at time T2 the value is Y then this field returns a value equal to (Y - X)/(T2 - T1). WNAP Inodes
The rate of the number of inodes taken with no attached pages. The number of inodes taken with no attached pages is calculated at different times, either when the refresh interval is reached or
when a manual refresh is issued. If at time T1 the value is X and at time T2 the value is Y then this field returns a value equal to (Y - X)/(T2 - T1). InodeTbl OverFlows
The rate of the number of inode table overflows. The number of inode table overflows is calculated at different times, either when the refresh interval is reached or when a manual refresh is issued. If at time T1 the value is X and at time T2 the value is Y then this field returns a value equal to (Y - X)/(T2 - T1).
FileTbl OverFlows
The rate of the number of file table overflows. The number of file table overflows is calculated at different times, either when the refresh interval is reached or when a manual refresh is issued. If at time T1 the value is X and at time T2 the value is Y then this field returns a value equal to (Y - X)/(T2 - T1).
ProcTbl OverFlows
The rate of the number of process table overflows. The number of process table overflows is
calculated at different times, either when the refresh interval is reached or when a manual refresh is issued. If at time T1 the value is X and at time T2 the value is Y then this field returns a value equal to (Y - X)/(T2 - T1).
H o s t S y s t e m H e a l t h C P U H e a l t h I n f o r m a t i o n V i e w
CPU Utilization Times View
This button opens the CPU Utilization Times view. The following fields appear in this view.
Instance
The CPU number. Delta
The delta of V1(value 1) and V2(value 2), where V1 and V2 are the cumulative CPU clock ticks taken at different times, either when the refresh interval is reached or when a manual refresh is issued. V1 or V2 is the sum of the values of Idle, User Mode, Kernel Mode, and Total Wait. If V1 is the previous value and V2 is the current value then Delta is V2 - V1.
Idle
Idle CPU time in percentage of CPU delta. If V1 is the previous value of idle time and V2 is the current value of idle time then Idle = (V2 - V1) * 100 / Delta.
User Mode
Time spent by CPU in user mode in percentage of CPU delta. If V1 is the previous value of user mode time and V2 is the current value of user mode time then User Mode = (V2 - V1) * 100 / Delta.
Kernal Mode
Time spent by CPU in kernel mode in percentage of CPU delta. If V1 is the previous value of kernel mode time and V2 is the current value of kernel mode time then Kernel Mode = (V2 - V1) * 100 / Delta.
Total Wait
Total CPU wait time in percentage of CPU delta. If V1 is the previous value of CPU wait time and V2 is the current value of CPU wait time then Total Wait = (V2 - V1) * 100 / Delta.
I/O Wait
Total CPU IO wait time in percentage of CPU delta. If V1 is the previous value of CPU IO wait time and V2 is the current value of CPU IO wait time then I/O Wait = (V2 - V1) * 100 / Delta. Swap Wait
Total CPU swap wait time in percentage of CPU delta. If V1 is the previous value of CPU swap wait time and V2 is the current value of CPU swap wait time then Swap Wait = (V2 - V1) * 100 / Delta. PIO Wait
Total CPU peripheral IO wait time in percentage of CPU delta. If V1 is the previous value of CPU peripheral wait time and V2 is the current value of CPU peripheral wait time then PIO Wait = (V2 - V1) * 100 / Delta.
H o s t S y s t e m H e a l t h F i l e S y s t e m I n f o r m a t i o n V i e w
Idle Thread Rate
The rate of the number of idle threads scheduled. If V1 and V2 are the number of idle threads scheduled at time T1 and T2 respectively then Idle Thread Rate = (V2 - V1)/(T2 - T1).
File System Information View
Access: From the Icon Subviews menu for the Device icon, select Host System Health > File System.
This view contains NFS and RPC client and server tables and button access to file system subviews. The tables and buttons are described below.
NFS Client Information (BASIC)
This table contains the following NFS and RPC client information.
Total NFS Calls
Total number of NFS client calls made by the host since last init. This is the total number of bad or good NFS calls made by the host.
NFS Call Rate
Rate at which NFS client calls are being made per second.
Bad NFS Calls
Number of bad NFS client calls since last init. This is the total number of NFS calls rejected. Pcnt Bad NFS Calls
Bad NFS client calls as a percentage of the total NFS client calls made.
Total RPC Calls
Total number of RPC client calls made by the host since last init. This is the total bad or good RPC client calls.
RPC Call Rate
Rate at which RPC client calls are being made per second.
Bad RPC Calls
Number of bad RPC client calls since last init. This is the total number of RPC calls rejected by the RPC layer.
Pcnt Bad RPC Calls
Bad RPC client calls as a percentage of the total RPC client calls made.
H o s t S y s t e m H e a l t h F i l e S y s t e m I n f o r m a t i o n V i e w
RPC Client View
This button provides access to more RPC client information. This view contains the following information.
Auth Refresh
Number of times authentication information was refreshed.
Bad Replies
Number of replies from server that do not correspond to any outside call.
Bad Verifs
Number of calls failed due to a bad verifier in response.
Mem Alloc Fails
Number of failures to allocate memory. Retransmissions
Total number of calls retransmitted due to a timeout.
Timers
Number of times calculated time-out exceeds minimum.
Timed Out
Number of calls timed out while waiting for a reply from server.
Send Fails
Number of failures where client is not able to send the packets for any reason.
NFS Server Information (BASIC)
This table contains the following NFS and RPC server information.
Total NFS Calls
Total number of NFS server calls made by the host since last init. This is the total number of bad or good NFS calls made by the host.
NFS Call Rate
Rate at which NFS server calls are being made per second.
Bad NFS Calls
Number of bad NFS server calls since last init. This is the total number of NFS calls rejected. Pcnt Bad NFS Calls
Bad NFS server calls as a percentage of the total NFS server calls made.
H o s t S y s t e m H e a l t h F i l e S y s t e m I n f o r m a t i o n V i e w
Total RPC Calls
Total number of RPC server calls made by the host since last init. This is the total bad or good RPC server calls.
RPC Call Rate
Rate at which RPC server calls are being made per second.
Bad RPC Calls
Number of bad RPC server calls since last init. This is the total number of RPC calls rejected by the RPC layer.
Pcnt Bad RPC Calls
Bad RPC server calls as a percentage of the total RPC server calls made.
NFS File System View (AMS)
This button provides access to the NFS File System view. This view contains the following information.
Name
The name of the NFS file system. This is the full path name of the NFS file system being
monitored, relative to the host.
Size
The total size of the NFS file system, in Kbytes. UsedSpace
Used disk space for the NFS file system, in Kbytes.
AvailSpace
Available disk space for the NFS file system, in Kbytes.
PctUsedSpa
Percentage of NFS disk space used. PctUsedSpaRate
The rate at which the percentage-used value changes per second.
MountPoint
The mount point for the NFS file system. This is the full pathname of the directory on which the NFS file system is mounted.
Entry Index
Character string value used for indexing in the table.
H o s t S y s t e m H e a l t h F i l e S y s t e m I n f o r m a t i o n V i e w
Disk Transactions View (AMS)
This button provides access to the Disk Transactions view. This view contains the following information.
Name
Name of the disk (e.g. sd0, etc.). AliasName
Name of the disk alias (e.g. c0t0d0, etc.). ReadOpRate
Number of read operations per second on the disk.
WriteOpRate
Number of write operations per second on the disk.
OperationRate
Total number of read and write operations per second (read + write) on the disk.
DataReadRate
Rate of data reads per second from this disk, in Kbytes per second.
DataWriteRate
Rate of data writes per second to this disk, in Kbytes per second.
DataTransferRate
Rate of data transfers per second to or from this disk, in Kbytes per second.
AvgWaitTrans
Average number of transactions waiting. AvgRunTrans
Average number of transactions running.
UFS File System (AMS)
This button provides access to the Disk Transactions view. This view contains the following information.
Mount Point
The full pathname where the file system is mounted.
DiskName
The name of the device (e.g. /dev/dsk/...). Size
The total size of the file system, in Kbytes. Free Space
Available disk space in the file system, in Kbytes. Disk Trans
H o s t S y s t e m H e a l t h F i l e S y s t e m I n f o r m a t i o n V i e w
NonSUFreeSpace
Available disk space in file system for non-superusers, in Kbytes.
Pct Used Space
Percentage of disk space used in the file system. Tot Inodes
The total number of inodes in the file system. Tot Inodes Avail
The total number of inodes available in the file system.
Pct Inodes Used
Percentage of inodes used in the file system.
File & Scan Information View
(AMS)
This button provides access to the File & Scan Information view. This view contains the following information.
Row Status The row status. Name
Scan information for one pattern.
Description
The pattern description. Pattern
The regular expression pattern, which needs to be matched.
State
The monitoring state of the entry. The value is ON when the row entry is enabled and OFF when the row entry is disabled.
Matches
The number of lines that match with the corresponding pattern.
Disk Service Times View (AMS)
This button provides access to the Disk Service Times view. This view contains the following information.
Name
Name of the disk (e.g. sd0, etc...). Pct Wait Time
Percentage of time there is a transaction waiting for service (wait queue length).
File Scan Grp