Suitable model for thin-layer drying of root vegetables and onion
Krzysztof Górnicki *, Agnieszka Kaleta , and Aneta ChoińskaInstitute of Mechanical Engineering, Warsaw University of Life Sciences – SGGW, Nowoursynowska 164, 02-787 Warsaw, Poland
Received February 22, 2019; accepted December 10, 2019
*Corresponding author e-mail: [email protected] A b s t r a c t.The drying behaviour of carrot, parsley, red beet-root and onion slices of 5 and 10 mm thickness was investigated in a convective dryer at a drying temperature of 50, 60 and 70°C under natural convection conditions. The experimental drying data of the vegetables slices obtained were fitted to five empiri-cal thin-layer models: Lewis (Newton), Henderson and Pabis, Page, Modified Page, Wang and Singh. The effects of the veg-etable species, air drying temperature, and slice thickness on the model parameters were determined. Four statistical tools, namely, the determination coefficient, root mean square error, reduced chi-square, and t-statistic method were applied to determine the fittings. The Page model with the model parameters determined by a summation equation, a square type dependence for the drying air temperature and a rational one for the slice thickness is recom-mended as the most suitable model (R2 = 0.9699, RMSE = 0.0587, χ2 = 0.0035, t-stat = 0.6739).
K e y w o r d s:root vegetables, onion, drying kinetics, model-ling, drying models
INTRODUCTION
Drying is one of the oldest and most common opera-tions in the food industry. Food products are usually dried to maintain food safety because the process reduces both enzymatic and microbial changes during the storage period and thereby improves the shelf life of the product (Younis et al., 2018). Large quantities of fruits, vegetables and oth-er plant tissues are also dried to reduce their weights and packaging costs, enhance appearance, and maintain flavour and nutritional values. Although the enhancement of prod-uct quality, economic considerations, and environmental concerns are the main aims of the drying process, the most important objective is preservation which depends on the
drying mechanisms (Barba et al., 2014).
The process of drying moist food involves a combina-tion of heat and mass transfer. Therefore, the drying process could be described as moisture removal by means of simul-taneous heat and mass transfer between the product and the surrounding air. The moisture is removed mainly by vapo- rization which occurs for the most part due to temperature and air convection forces (Avhad and Marchetti, 2016).
Studying the drying kinetics may be of particular re- levance in choosing the optimal conditions for a satisfactory
drying process (Opalić et al., 2009). Full-scale
experimen-tation with different bioproducts and system configurations is in the main costly and therefore impractical. Hence, the mathematical modelling of the drying processes and equip-ment is a very important issue for drying technology. The development of a mathematical model for the drying pro-cess allows for the selection of the most adequate operating conditions and hence the most appropriate size of the drying equipment which enables it to meet the desired operating
parameters (Sacilik et al., 2006).
Drying behaviour is described using the following categories of mathematical models: theoretical models, semi-theoretical models, and empirical models (Rodríguez et al., 2014).
Theoretical models are based on the theory of mass and heat transfer laws. They respect the fundamentals of the drying process and their parameters have a physical mean-ing. Theoretical simulations may provide explanations for various phenomena, which occur during the drying pro-cess. However, the models discussed are time consuming because the diffusion equations governing the process are complicated (Kaleta and Górnicki, 2010b). Theoretical
models have been applied to describe the drying kinetics of such biological materials as apples (Kowalski and Rybicki, 2017), carrots (Mahapatra and Tripathy, 2018;
Sánchez-Sáenz et al., 2015), cherry tomato (Bennamoun et al.,
2015), green bean (Doymaz et al., 2015; Tekin et al., 2017),
hazelnut (Giraudo et al., 2018), peach (Doymaz, 2014),
pumpkin (Agrawal and Methekar, 2017; Junqueira et al.,
2017), peppermint leaves (Ashtiani et al., 2017), poppy
seeds (Stakić and Urošević, 2011), pre-gelatinized potato
starch (Jiang et al., 2017), red beets (Kaleta and Górnicki,
2010b), spinach leaves (Doymaz, 2009), and sunflower
seeds (Darvishi et al., 2013).
Recently, a research study has modelled drying kine- tics using artificial neural networks (Omari et al., 2018;
Özdemir et al., 2017; Rodríguez et al., 2014).
The semi-theoretical models are generally deduced from simplified versions of Fick’s second law of diffusion
(Ashtiani et al., 2017). The empirical models are mainly
formulated from the direct relationship between the mois-ture content and drying time (Ertekin and Firat, 2017). Mathematical equations obtained in this way have parame-ters, which are fitted based on the experimental results. The mathematical form of empirical models does not require the consideration of the theory of drying, therefore their
parameters are without physical meaning (Kaleta et al.,
2013). On account of their simplicity, the models discussed are applied to describe the drying characteristics of
differ-ent products such as apples (Antal et al., 2015; Atalay et
al., 2017), blueberries (Yu et al., 2017), carrots (Aghbashlo
et al., 2011; Mahapatra and Tripathy, 2018), canola (Gazor
and Mohsenimanesh, 2010), cashew (Dhanushkodi et al.,
2017), dill leaves (Motevali et al., 2013), garlic (Younis
et al., 2018), green bean (Doymaz et al., 2015; Tekin et
al., 2017), Hass avocado seeds (Avhad and Marchetti,
2016), kiwi fruit (Tian et al., 2015), Moroccan rosemary
leaves (Mghazli et al., 2017), peach (Doymaz, 2014),
pumpkin (Junqueira et al., 2017), rice (Hacıhafızoğlu et
al., 2008), spinach leaves (Doymaz, 2009), sweet basil
(Phoungchandang and Kongpim, 2012), tomato (Azeez et al., 2017), Vernonia amygdalina leaves (Alara et al., 2017). Some authors have described the effect of drying variables on the parameters of empirical models, in these cases such models may be considered to be more general. In the literature, the predicted parameter values were
cor-related as a function of drying air temperature (Alara et
al., 2017; Kaleta et al., 2013; Mghazli et al., 2017), drying
air temperature and airflow velocity (Hosseinabadi et al., 2012), characteristic particle dimension and initial
mate-rial load (Kaleta et al., 2013), airflow velocity, drying air
temperature, characteristic particle dimension and the ini-tial height of the layer (Kaleta and Górnicki, 2010a), wood
species and drying air temperature (Górnicki et al., 2017).
No information was obtained concerning the examination of the effect of the vegetables species on the parameters of the drying models. Therefore, the objective of this paper
was to investigate the effect of the vegetable species, dry-ing air temperature and slice thickness on the parameters of the drying models.
As mentioned previously, some authors have described the effect of drying variables on the parameters of the empirical models in order to make these models more wide-ly applicable. The effect of the type of the material being
dried was only determined for wood (Górnicki et al., 2017).
Therefore, the authors investigated the effect of conditions of conducting drying process (air drying temperature, slice thickness) and also the effect of differences in the biologi-cal and mechanibiologi-cal structure of vegetables.
MATERIAL AND METHODS
Onions and roots of carrot, parsley, and red beet were obtained from a local market. The material was washed in water, hand peeled, and cut into slices (5 and 10 mm thick-ness) with a cutting machine, and then dried on the same day. The initial moisture content varied between 9.29 and
9.72 kg H2O kg-1 d.m. for carrot, 4.77 and 5.24 kg H2O kg-1
d.m. for parsley, 7.55 and 8.00 kg H2O kg-1 d.m. for red
beet, 7.10 and 8.80 kg H2O kg-1 d.m. for onion. The product
moisture content was determined according to the standard procedure (Horwitz, 2005).
The experiments were conducted in a laboratory dry-er – Memmdry-ert UFP400 (MEMMERT GmbH+Co. KG, Schwabach, Germany) – under natural convection condi-tions. Three drying air temperatures namely, 50, 60, and
70°C were used in the experiments. The measurements
were performed in the following manner. The sample was uniformly spread as a thin-layer on the tulle stretched on a metal frame (scale) and then hung up on the scales WPX 650 (RADWAG, Radom, Poland). The weighing accuracy was ±1 mg. Changes in the sample mass were recorded each 60 s using a computer connected to the scales. Drying was continued until there was no mass change. The experi-ments were performed in three repetitions.
The air temperature inside the dryer was measured using thermocouple TP-01b-W3 (CZAKI THERMO-PRODUCT, Raszyn, Poland). The thermocouple was placed at the centre of the drying chamber. The temperature
was measured with ± 0.1°C accuracy.
Table 1 shows the empirical models applied to describe the drying characteristics of carrot, parsley, red beetroots
and onions (a, b, k, and n are the model parameters).
Simple models with only one or two parameters were cho-sen. These drying models are very often used, especially in practical drying.
The dimensionless moisture ratio MR is calculated
using Eq. (1):
-0
MR= t e e
M M
M M , (1)
where: Mt is the moisture content at t (kg H2O kg-1 d.m.),
t is time (s), Me is the equilibrium moisture content (kg H2O
kg-1 d.m.), and M0 is the initial moisture content (kg H2O
The initial and equilibrium moisture content of the samples were determined gravimetrically by drying in
a laboratory oven at a temperature of 105oC and
atmos-pheric pressure for a period of 24 h, until completely dry
(Lutovska et al., 2017).
The drying curves obtained from the experiments were fitted to the five tested models presented in Table 1. The data were analysed using the computer program Dell Statistica (ver. 13; Dell Inc., Tulsa, OK, USA). A non-linear regression analysis was carried out using the Lavenberg-Marquardt method and thus the model parameters were determined. When statistical analyses are carried out to identify the best fit, frequently used statistical criteria are the determination coefficient (R2), reduced chi-square (χ2), the root mean square error (RMSE), and the t-static method
(t-stat) (Azeez et al., 2017; Kaleta et al., 2013). The criteria
mentioned above may be calculated using Eqs (2)-(5):
(
) (
)
(
)
(
)
i pre,i exp,
2 1 1
2 2
pre, exp,
1 1
MR -MR MR -MR
R
MR -MR MR -MR
= =
= =
⋅ =
⋅
∑
∑
∑
∑
N N
i i
i i
N N
i i i i
i i
, (2)
(
)
2 1/2pre, exp, 1
1
RMSE MR -MR
=
=
∑
N
i i
i
N , (3)
, (4)
( )
2 1/22 2
-1 MBE -stat=
RMSE -MBE
n
t , (5)
where: MRexp and MRpre are dimensionless moisture ratios
obtained from experimental results and modelling,
respec-tively, N is the number of observations, n is the number
of parameters in the drying model, i is the number of
terms, and MBE (mean bias error) is calculated according
to Eq. (6):
(
pre, exp,)
=1
1
MBE=
∑
N MR -MRi i iN , (6)
whereR2 takes the values between 0 and 1. The closer it
is to 1, the closer the relationship between the
experimen-tal and predicted values. The RMSE value is required to
reach 0. Lower RMSE values indicate better fitness of the
established model. The lower the values of χ2 and t-stat, the better the goodness of the fit.
The effect of the vegetable species (VS), drying air
tem-perature (T, °C), and slice thickness (L, mm) on the model
parameters were investigated in the following manner. The
parameters of the applied models 1-5 involving the conside- red variables were obtained by taking into account the fol- lowing equations: summation: X = f(VS)+f(T)+f(L),
sub-traction X = f(VS)-f(T)-f(L), multiplication X = f(VS) f(T)
f(L), division X = (f(VS)/f(T))/f(L), (X is the variable).
The influence of T was described by applying several dif-ferent equations, namely: linear f(T) = A+BT, logarithmic
(common) f(T)=A+Blog(T), rational f(T) = A+BT -1, square
f(T) = A+BT+CT 2. A, B, C are coefficients independent of the vegetable species and slice thickness. The
influ-ence of L was expressed by accepting the following type
of dependencies: linear f(L) = D+EL, logarithmic
(com-mon) f(L) = D+Elog(L), rational f(L) = D+EL-1, and square
f(L) = D+E L+FL2. Coefficients D, E, F are independent of the vegetable species and drying air temperature. The influ-ence of VS on the drying model parameters was determined
using the Av coefficient (f(VS) = Av). Av is the coefficient
independent of T and L and its value depends only on the
type of vegetable.
RESULTS AND DISCUSSION
The moisture ratio versus time diagram for the dry-ing of the investigated vegetables is presented in Fig. 1.
Each of the drying curves MR(t) represents an empirical
formula. The empirical formula approximates the results of three measurement repetitions of the moisture ratio chang-es over time. It may be assumed that the drying procchang-ess of the slices of the considered vegetables was affected by the vegetable species. Figure 1 shows that the drying time for carrot and red beetroots and onions may be regarded as almost the same. It may be observed that the drying process of parsley root slices is slower than that of other vegetable species, however, the drying time may be considered to be the same. The same trends that were observed for drying at
70°C were obtained at 50 and 60°C, and for slices of 10 mm
thickness.
There is no information in the literature concerning a comparison of the drying curves of carrots, parsley, red beets, and onions although the drying process of these vegetables were investigated (Górnicki and Kaleta, 2007; Planinić et al., 2005; Shynkaryk et al., 2008).
An evaluation of the empirical models was applied to describe the drying characteristics of carrot, parsley, red beetroots and onions, it was carried out in the follow-ing manner. The moisture content data received from the
experiments for different T and L values were changed
to a dimensionless moisture ratio formula. The next step was the curve fitting computations with the drying time taking into account the models given in Table 1. Then the regressions were taken into account to explain the influ-ence of the vegetable species, air temperature, and slice thickness on the parameters of the models under
considera-tions. The effects of VS, T, and L on the model parameters
were also included in the models. The following types of dependencies were examined: summation, subtraction,
multiplication, and division. Linear, rational, logarithmic
(common), and square types of equation were applied for the air drying temperature and slice thickness. The
param-etes combinations giving the highest values of R2 were then
considered in the final model. The dependencies obtained, along with the determined coefficients were then applied to calculate the moisture ratio of carrot, parsley, red beet-roots and onions at any time during the drying process. The
models developed were validated by comparing the meas-ured and computed moisture ratios in any particular drying course.
Statistical analyses indicated that the parameters of the models determined by summation and subtraction equa-tions (with the linear, logarithmic (common), rational, and square types of equation for the air drying temperature and slice thickness) may be assumed to be appropriate for the five drying models under consideration (Table 2). The
RMSE values varied between 0.0000 and 0.0500, the χ2
val-ues ranged from 0.0000 to 0.0028, while the t-stat values
ranged from 0.0000 to 0.0486 (for model 5 from 0.0001 to 4.8603). The values of the determination coefficient (R2) are slightly less satisfactory and for models 1, 2, 4, and 5 they varied from between 0.5073 and 0.9752, however, for
model 3, the R2 values ranged from 0.1999 to 0.7342.
All of the parameter equations discussed above were then substituted into the tested models to predict the course of the drying curves for carrot, parsley, and red beetroos and onios slices of 5 and 10 mm thickness in the
tempera-ture range of 50-70°C. The results of the statistical analyses
are presented in Table 3. The results for the Wang and Singh Table 1. Considered thin-layer models
Model No. Model equation Model name References
1 MR(t) = exp(–kt) Lewis (Newton) (Lewis, 1921)
2 MR(t) = aexp(–kt) Henderson and Pabis (Henderson and Pabis, 1961)
3 MR(t) = exp(–ktn) Page (Page, 1949)
4 MR(t) = exp[– (kt)n] Modified Page (Overhults et al., 1973)
5 MR(t) = 1+at+bt2 Wang and Singh (Wang and Singh, 1978)
Table 2. Results of statistical analyses in describing the drying model parameters using a summation and subtraction equation
Model No. Parameter R2 RMSE χ2 t-stat
1 k 0.9682-0.9703 0.0003 0.0000 0.0010-0.0486
2 k 0.5073-0.6294 0.0012-0.0014 0.0000 0.0000-0.0114
a 0.5117-0.6283 0.0158-0.0181 0.0003-0.0004 0.0000-0.0016
3 k 0.1999-0.4124 0.0004 0.0000 0.0000-0.0178
n 0.6481-0.7342 0.0431-0.0500 0.0021-0.0028 0.0000-0.0012
4 k 0.9681-0.9752 0.0003 0.0000 0.0000-0.0127
n 0.6419-0.7342 0.0431-0.0500 0.0021-0.0028 0.0000-0.0019
5 a 0.9404-0.9453 0.0003 0.0000 0.0002-0.0291
b 0.8743-0.8771 0.0000 0.0000 0.0001-4.8603
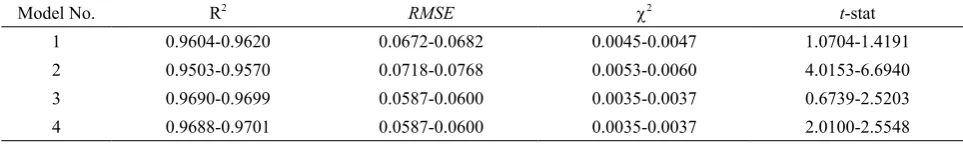
Table 3. Results of statistical analyses concerning the modelling of the drying process of carrot, parsley, red beet and onions (the model parameters are described by summation, subtraction, multiplication and division equations)
Model No. R2 RMSE χ2 t-stat
1 0.9604-0.9620 0.0672-0.0682 0.0045-0.0047 1.0704-1.4191
2 0.9503-0.9570 0.0718-0.0768 0.0053-0.0060 4.0153-6.6940
3 0.9690-0.9699 0.0587-0.0600 0.0035-0.0037 0.6739-2.5203
model (model 5) are not inserted into Table 3 because they turned out to be unacceptable. The other tested models, namely: Lewis (Newton) (model 1), Henderson and Pabis (model 2), Page (model 3), and Modified Page (model 4) fitted very well to the experimental data. The determination coefficient values are high enough (0.9503-0.9701), RMSE
varied between 0.0587 and 0.0768, χ2 ranged from 0.0035
to 0.0060, and the t-stat value varied from 0.6739 to 6.6940.
The effect of VS, T, and L on the model parameters may
be taken into consideration on an individual basis (Table 4). The coefficients of the chosen parameter equations for carrot, parsley, red beetroos and onios drying models are
shown in Table 4. The Av parameter has different values for
different vegetables, which indicates the effect of the type
of vegetable (Avdepends on the vegetable species) on the
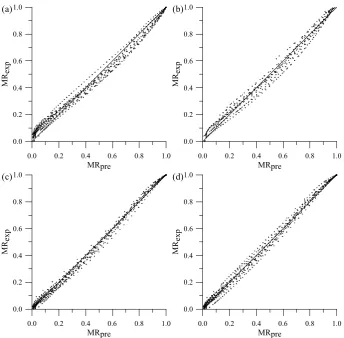
kinetics of the drying process (Fig. 1). By substituting these coefficients into parameter equations and then considering the aforementioned formulas in the examined models, the course of the drying curve of the considered vegetables may be predicted. The parameter equations given in Table 4 are those, which were substituted into an adequate dry-ing model to allow for the most precise description of the drying curves. The results of statistical analyses for the examined descriptions are presented in Table 4. It may be stated that the following models: Lewis (Newton) (model 1), Henderson and Pabis (model 2), Page (model 3), and Modified Page (model 4) with parameter equations ade-quate for each considered model given in Table 4 fitted very well to the experimental data. Figure 2 confirms the exist-ence of an acceptable correlation between the experimental and predicted moisture ratios (for all considered vegeta-bles) and shows that the considered models are appropriate for predicting the drying characteristics of carrot, parsley, red beetroots and onions.
To summarize, the drying models given in Table 4 may be used to describe the drying kinetics of carrot, parsley, red beetroos and onios slices of 5 and 10 mm thickness in
the temperature range of 50-70°C. The Page model with pa-
rameters evaluated using a summation equation and square type dependence for drying air temperature and a rational one for slice thickness may be considered, however, as
the most satisfactory model (R2 = 0.9699, RMSE = 0.0587,
χ2 = 0.0035, t-stat = 0.6739). The statistical analyses results
describing the Page model parameters using the
depend-encies mentioned above are the following: R2 = 0.4017,
RMSE = 0.0004, χ2 = 0.0000, t-stat = 0.0126 for k and R2 =
0.7194, RMSE = 0.0442, χ2 = 0.0022, t-stat = 0.0004 for n.
The investigations revealed that there is a possibility of generalizing the empirical models considered. The inclu-sion of the appropriate VS material coefficient into the parameters of these models gives the chance of predicting the drying process of various vegetables with a significant-ly high degree of accuracy.
Table 4. Coefficie nts of the chosen parameter equations for drying models and the results of statistical analyses concerning the modelling of the drying process of carrot, parsley , red beet
and onions Parameter equation
-CONCLUSIONS
1. It appears that the effect of vegetable species, drying air temperature, and slice thickness on the model (Lewis (Newton), Henderson and Pabis, Page, Modified Page, Wang and Singh) parameters can be taken into account individually.
2. All models, except that developed by Wang and Singh, with the parameters calculated considering the effect of temperature, slice thickness, and vegetable species may be applied to describe the drying kinetics of carrot, parsley, and red beetroos and onios slices of 5 and 10 mm thickness
in the temperature range of 50-70°C.
3. The Page model with the parameters evaluated using a summation equation and square type dependence for dry-ing air temperature and a rational one for slice thickness may be considered to be the most adequate (R2 = 0.9699, RMSE = 0.0587, χ2 = 0.0035, t-stat = 0.6739).
Conflict of interest: The authors declare that they have no conflict of interest.
Compliance with Ethical Requirements: This study does not contain any experiment involving human or ani-mal subjects.
REFERENCES
Aghbashlo M., Kianmehr M.H., Arabhosseini A., and
Nazghelichi T., 2011. Modelling the carrot thin-layer
dry-ing in a semi-industrial continuous band dryer. Czech J. Food Sci., 29(5), 528-538.
https://doi.org/10.17221/158/2010-cjfs
Agrawal S.G. and Methekar R.N., 2017. Mathematical model
for heat and mass transfer during convective drying of pumpkin. Food Bioprod. Process., 101, 68-73.
https://doi.org/10.1016/j.fbp.2016.10.005
Alara O.R., Abdurahman N.H., and Olalere O.A., 2017.
Mathematical modelling and morphological properties of thin layer oven drying of Vernonia amygdalina leaves. J. Saudi Soc. Agric. Sci., 18(3), 309-315.
https://doi.org/10.1016/j.jssas.2017.09.003
Antal T., Kerekes B., Sikolya L., and Tarek M., 2015. Quality
and drying characteristics of apple cubes subjected to com-bined drying (FD pre-drying and HAD finish-drying): Apple drying. J. Food Process. Preserv., 39(6), 994-1005. https://doi.org/10.1111/jfpp.12313
Ashtiani S.-H.M., Salarikia A., and Golzarian M.R., 2017.
Analyzing drying characteristics and modeling of thin lay-ers of peppermint leaves under hot-air and infrared treatments. Inf. Process. Agric., 4(2), 128-139.
https://doi.org/10.1016/j.inpa.2017.03.001
0.0 0.2 0.4 0.6 0.8 1.0
MRpre
0.0 0.2 0.4 0.6 0.8 1.0
MR
exp
(a)
0.0 0.2 0.4 0.6 0.8 1.0
MRpre
0.0 0.2 0.4 0.6 0.8 1.0
MR
exp
(b)
0.0 0.2 0.4 0.6 0.8 1.0
MRpre
0.0 0.2 0.4 0.6 0.8 1.0
MR
exp
(c)
0.0 0.2 0.4 0.6 0.8 1.0
MRpre
0.0 0.2 0.4 0.6 0.8 1.0
MR
exp
(d)
Atalay H., Çoban M.T., and Kıncay O., 2017. Modeling of the drying process of apple slices: Application with a solar dry-er and the thdry-ermal endry-ergy storage system. Endry-ergy, 134, 382-391. https://doi.org/10.1016/j.energy.2017.06.030
Avhad M.R. and Marchetti J.M., 2016. Mathematical
model-ling of the drying kinetics of Hass avocado seeds. Ind. Crops Prod., 91, 76-87.
https://doi.org/10.1016/j.indcrop.2016.06.035
Azeez L., Adebisi S.A., Oyedeji A.O., Adetoro R.O., and Tijani
K.O., 2017. Bioactive compounds’ contents, drying
kinet-ics and mathematical modelling of tomato slices influenced by drying temperatures and time. J. Saudi Soc. Agric. Sci., 18(2), 120-126. https://doi.org/10.1016/j.jssas.2017.03.002
Barba A.A., d’Amore M., Rispoli M., Marra F., and Lamberti
G., 2014. Microwave assisted drying of banana: Effects on
reducing sugars and polyphenols contents. Czech J. Food Sci., 32(4), 369-375. https://doi.org/10.17221/536/2013-cjfs
Bennamoun L., Khama R., and Léonard A., 2015. Convective
drying of a single cherry tomato: Modeling and experimen-tal study. Food Bioprod. Process., 94, 114-123.
https://doi.org/10.1016/j.fbp.2015.02.006
Darvishi H., Hadi Khoshtaghaza M., Najafi G., and Zarein M.,
2013. Characteristics of sunflower seed drying and
micro-wave energy consumption. Int. Agrophys., 27(2), 127-132. https://doi.org/10.2478/v10247-012-0077-8
Dhanushkodi S., Wilson V.H., and Sudhakar K., 2017. Mathe-
matical modeling of drying behavior of cashew in a solar biomass hybrid dryer. Resour.-Effic. Technol., 3(4), 359-364. https://doi.org/10.1016/j.reffit.2016.12.002
Doymaz I., 2009. Thin-layer drying of spinach leaves in a
con-vective dryer. J. Food Process Eng., 32(1), 112-125. https://doi.org/10.1111/j.1745-4530.2007.00205.x
Doymaz I., 2014. Suitability of thin-layer drying models for
infrared drying of peach slices: Infrared Drying of Peach Slices. J. Food Process. Preserv., 38(6), 2232-2239. https://doi.org/10.1111/jfpp.12277
Doymaz I., Kipcak A.S., and Piskin S., 2015. Characteristics of
thin-layer infrared drying of green bean. Czech J. Food Sci., 33(1), 83-90. https://doi.org/10.17221/423/2014-cjfs
Ertekin C. and Firat M.Z., 2017. A comprehensive review of
thin-layer drying models used in agricultural products. Crit. Rev. Food Sci. Nutr., 57(4), 701-717.
Gazor H.R. and Mohsenimanesh A., 2010. Modelling the
dry-ing kinetics of canola in fluidised bed dryer. Czech J. Food Sci., 38(6), 531-537. https://doi.org/10.17221/256/2009-cjfs
Giraudo A., Valentini N., Venturello A., Savorani F., Bertone E.,
Bonazzola G., Zeppa G., and Geobaldo F., 2018. Kinetic
modeling of hazelnut drying: Effects of different cultivars and drying parameters. J. Food Process Eng., 41(1), e12632. https://doi.org/10.1111/jfpe.12632
Górnicki K. and Kaleta A., 2007. Modelling convection drying
of blanched parsley root slices. Biosyst. Eng., 97(1), 51-59. https://doi.org/10.1016/j.biosystemseng.2007.02.006
Górnicki K., Kaleta A., Bryś A., and Winiczenko R., 2017.
Modelling of drying curves of spruce, beech, willow and alder particles. Drv. Ind., 68(1), 11-16.
https://doi.org/10.5552/drind.2017.1602
Hacıhafızoğlu O., Cihan A., and Kahveci K., 2008. Mathematical
modelling of drying of thin layer rough rice. Food Bioprod. Process., 86(4), 268-275.
https://doi.org/10.1016/j.fbp.2008.01.002
Henderson S.M. and Pabis S., 1961. Grain drying theory. I.
Temperature effect on drying coefficient. J. Agric. Eng. Res., 6, 169-174.
Horwitz W. (Ed.), 2005. Official methods of analysis of AOAC
International. AOAC Int.: Gaithersburg, MD, USA.
Hosseinabadi H.Z., Doosthoseini K., and Layeghi M., 2012.
Drying kinetics of poplar (Populus Deltoides) wood parti-cles by a convective thin layer dryer. Drv. Ind., 63(3), 169-176. https://doi.org/10.5552/drind.2012.1201
Jiang J., Dang L., Yuensin C., Tan H., Pan B., and Wei H., 2017.
Simulation of microwave thin layer drying process by new theoretical model. Chem. Eng. Sci., 162, 69-76. https://doi.org/10.1016/j.ces.2016.12.040
Junqueira J.R. de J., Corrêa J.L.G., and Ernesto D.B., 2017.
Microwave, convective, and intermittent microwave-con-vective drying of pulsed vacuum osmodehydrated pumpkin slices. J. Food Process. Preserv., 41(6), e13250.
https://doi.org/10.1111/jfpp.13250
Kaleta A. and Górnicki K., 2010a. Evaluation of drying models
of apple (var. McIntosh) dried in a convective dryer. Int. J. Food Sci. Technol., 45(5), 891-898.
https://doi.org/10.1111/j.1365-2621.2010.02230.x
Kaleta A. and Górnicki K., 2010b. Some remarks on evaluation
of drying models of red beet particles. Energy Convers. Manag., 51(12), 2967-2978.
https://doi.org/10.1016/j.enconman.2010.06.040
Kaleta A., Górnicki K., Winiczenko R., and Chojnacka A., 2013.
Evaluation of drying models of apple (var. Ligol) dried in a fluidized bed dryer. Energy Convers. Manag., 67, 179-185. https://doi.org/10.1016/j.enconman.2012.11.011
Kowalski S.J. and Rybicki A., 2017. Ultrasound in wet
biologi-cal materials subjected to drying. J. Food Eng., 212, 271-282. https://doi.org/10.1016/j.jfoodeng.2017.05.032
Lewis W.K., 1921. The rate of drying of solid materials. Ind. Eng.
Chem., 13(5), 427-432.
Lutovska M., Mitrevski V., Pavkov I., Babic M., Mijakovski V.,
Geramitcioski T., and Stamenkovic Z., 2017. Different
methods of equilibrium moisture content determination. J. Process. Energy Agric., 21(2), 91-96.
https://doi.org/10.5937/jpea1702091l
Mahapatra A. and Tripathy P.P., 2018. Modeling and
simula-tion of moisture transfer during solar drying of carrot slices. J. Food Process Eng., 41(8), e12909.
https://doi.org/10.1111/jfpe.12909
Mghazli S., Ouhammou M., Hidar N., Lahnine L., Idlimam A.,
and Mahrouz M., 2017. Drying characteristics and kinetics
solar drying of Moroccan rosemary leaves. Renew. Energy, 108, 303-310. https://doi.org/10.1016/j.renene.2017.02.022
Motevali A., Younji S., Chayjan R.A., Aghilinategh N., and
Banakar A., 2013. Drying kinetics of dill leaves in a
con-vective dryer. Int. Agrophys., 27(1), 39-47. https://doi.org/10.2478/v10247-012-0066-y
Omari A., Behroozi-Khazaei N., and Sharifian F., 2018. Drying
kinetic and artificial neural network modeling of mushroom drying process in microwave-hot air dryer. J. Food Process Eng., 41(7), e12849. https://doi.org/10.1111/jfpe.12849
Opalić M., Domitran Z., Komes D., Belščak A., Horžić D., and
Karlović D., 2009. The effect of ultrasound pre-treatment
and air-drying on the quality of dried apples. Czech J. Food Sci., 27(Special Issue 1), S297-S300.
Overhults D.G., White G.M., Hamilton H.E., and Ross I.J.,
1973. Drying soybeans with heated air. Trans. ASAE, 16(1),
0112-0113. https://doi.org/10.13031/2013.37459
Özdemir M.B., Aktaş M., Şevik S., and Khanlari A., 2017.
Modeling of a convective-infrared kiwifruit drying process. Int. J. Hydrog. Energy, 42(28), 18005-18013.
https://doi.org/10.1016/j.ijhydene.2017.01.012
Page G.E., 1949. Factors influencing the maximum rates of air
drying shelled corn in thin layers. MSc. Thesis, Purdue University, ProQuest Dissertations Publ., West Lafayette, IN, USA.
Phoungchandang S. and Kongpim P., 2012. Modeling using
a new thin-layer drying model and drying characteristics of sweet basil (Ocimum baslicum Linn.) using tray and heat pump-assisted dehumidified drying: drying characteristics. J. Food Process Eng., 35(6), 851-862.
https://doi.org/10.1111/j.1745-4530.2010.00633.x
Planinić M., Velić D., Tomas S., Bilić M., and Bucić A., 2005.
Modelling of drying and rehydration of carrots using Peleg’s model. Eur. Food Res. Technol., 221(3-4), 446-451. https://doi.org/10.1007/s00217-005-1200-x
Rodríguez J., Clemente G., Sanjuán N., and Bon J., 2014.
Modelling drying kinetics of thyme (Thymus vulgaris L.): Theoretical and empirical models, and neural networks. Food Sci. Technol. Int., 20(1), 13-22.
https://doi.org/10.1177/1082013212469614
Sacilik K., Keskin R., and Elicin A.K., 2006. Mathematical
modelling of solar tunnel drying of thin layer organic toma-to. J. Food Eng., 73(3), 231-238.
https://doi.org/10.1016/j.jfoodeng.2005.01.025
Sánchez-Sáenz C.M., de Oliveira R.A., and Park K.J., 2015.
HTST Pre-drying influence on vacuum drying kinetics and
carrot slices quality parameters evaluation: Vacuum drying kinetics for carrot slices. J. Food Process. Preserv., 39(6), 1636-1646. https://doi.org/10.1111/jfpp.12393
Shynkaryk M.V., Lebovka N.I., and Vorobiev E., 2008. Pulsed
electric fields and temperature effects on drying and rehy-dration of red beetroots. Dry. Technol., 26(6), 695-704. https://doi.org/10.1080/07373930802046260
Stakić M. and Urošević T., 2011. Experimental study and
simu-lation of vibrated fluidized bed drying. Chem. Eng. Process. Process Intensif., 50(4), 428-437.
https://doi.org/10.1016/j.cep.2011.02.006
Tekin Z.H., Başlar M., Karasu S., and Kilicli M., 2017.
Dehydration of green beans using ultrasound-assisted vacu-um drying as a novel technique: drying kinetics and quality parameters. J. Food Process. Preserv., 41(6), e13227. https://doi.org/10.1111/jfpp.13227
Tian Y., Wu S., Zhao Y., Zhang Q., Huang J., and Zheng B.,
2015. Drying characteristics and processing parameters for
microwave-vacuum drying of kiwifruit (Actinidia delicio-sa) slices: Microwave-vacuum drying of kiwifruit slices. J. Food Process. Preserv., 39(6), 2620-2629.
https://doi.org/10.1111/jfpp.12512
Wang G.V. and Singh R.P., 1978. A single layer drying equation
for rough rice. In: Paper - American Society of Agricultural Engineers. ASAE, St Joseph, MI, USA.
Younis M., Abdelkarim D., and El-Abdein A.Z., 2018. Kinetics
and mathematical modeling of infrared thin-layer drying of garlic slices. Saudi J. Biol. Sci., 25(2), 332-338.
https://doi.org/10.1016/j.sjbs.2017.06.011
Yu Y., Jin T.Z., and Xiao G., 2017. Effects of pulsed electric