300
Volume-4, Issue-1, February-2014,
ISSN No.: 2250-0758
International Journal of Engineering and Management Research
Available at:
Page Number: 300-304
Impact of Paddy Demonstrations Conducted under TOT Project of RKVY
in Gadchiroli District
S. S. Karhale1, S. P. Lambe2, S. B. Brahmankar3
1Subject Matter Specialist (Agril. Engg), Krishi Vigyan Kendra,(Dr. PDKV) Sonapur- Gadchiroli, INDIA 2Associate Professor of Extension Education, College oif Agriculture, Gadchiroli, INDIA
3
Associate Professor of Plant Pathology, , College oif Agriculture, Gadchiroli, INDIA
ABSTRACT
The impact assessment of the demonstration on paddy PKV HMT conducted on the farmers’ field were made with the sample of 100 farmers selected for undertaking demonstration under TOT of RKVY. The results pertaining to profile of respondents, revealed that more than half (53.00 %) of the respondents were found in the middle age category and educated up to secondary school (44.00 %). Whereas 33.00 per cent of the respondents were found in small land holding category i.e. 1.1 to 2 ha of land. About 52.00 per cent of respondents were found in the medium annual income category i.e. (up to Rs. 48001 per year). More than half of the respondents were found in the medium social participation category (56.00 %). After conduction of demonstrations of PKV HMT remarkable change is observed in awareness, attitude, knowledge, adoption, increase in area and yield Paddy (PKV HMT)
Keywords--- PKV, HMT, RKVY
I.
INTRODUCTION
It is assumed that the farmers can be directly benefitted in production of land and thereby increasing their income through demonstration of the scientific and technological tools on the farmers field under TOT. Demonstrations can successfully show the yield gaps as they exist between the farmers yield under normal condition. Accordingly the transfer of technology under RKVY was implemented in Gadchiroli District through KVK Sonapur-Gadchiroli. The impact of the project was definitely positive as 100 farm families are directly get benefited and indirectly the project benefited more farm families from the nearby villages. As the scientists of the KVK and officials of department of agriculture were involved in the project the same module can be implemented in other blocks of Gadchiroli district. Under the project demonstrations of Paddy (PKV-HMT) in Kharif season were conducted on farmers field by
providing all inputs along with technical guidance by conducting farmers field school, training and field days on the farmers field in the year 2012-13 and 2013-14.
II.
OBJECTIVES
1. To study the profile of the beneficiary farmers.
2. To study the impact of Paddy demonstrations conducted under TOT project of RKVY.
III.
METHODOLOGY
The present study was conducted in Gadchiroli districts of Vidarbha region. Ten villages of Gadchiroli district were selected for the study purposively as the demonstrations of Paddy (PKV-HMT) were conducted in these villages. Ten beneficiary farmers under demonstrations in the 10 selected villages were selected for the study. Thus total number of 100 respondents was selected in the study. The Ex-post facto approach was used for present research study. A structured interview schedule was prepared for data collection. In accordance with the objectives of the study, questions were framed in the schedule. Thus, the data obtained from 100 beneficiary farmers was put forth for tabulation and statistical analysis.
IV.
RESULT AND DISCUSSION
1. Socio-personal and psychological characteristics of respondents.
1.1 Age
301
Table 1 Distribution of respondents according to age.Sr. No. Category Number Percentage
1. Young age (up to 32 years) 32 32.00
2. Middle age (33 to 49 Years) 53 53.00
3. Old age (50 and above) 15 15.00
Total 100 100.00
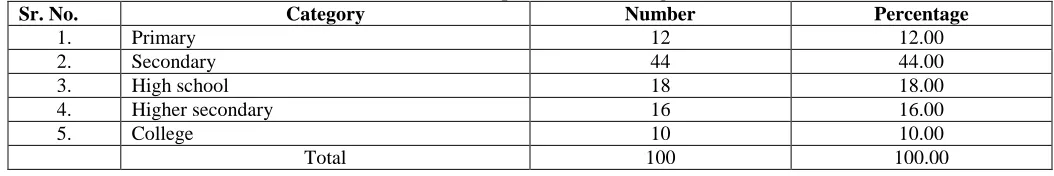
1.2 Education
It is observed from table 2, that 44.00 per cent of the respondents were educated up to secondary school. Whereas, 18.00 per cent of the respondents were educated
up to high school. It is also reported that 16.00 per cent of the respondents were educated up to higher secondary level and 10.00 per cent up to college level education.
Table 2 Distribution of respondents according to education.
Sr. No. Category Number Percentage
1. Primary 12 12.00
2. Secondary 44 44.00
3. High school 18 18.00
4. Higher secondary 16 16.00
5. College 10 10.00
Total 100 100.00
1.3 Land holding
It is observed from table 3 that 36.00 per cent of the respondents were found in the marginal l land holding category i.e. (upto 1 ha of land), followed by 29.00 per cent in small land holding category i.e. (1.01 to 2 ha of
land). It is also reported that 24.00 per cent of the respondents were observed in the semi medium land holding category i.e. (2.01 to 4 ha) and 10.00 per cent respondents having land in medium category (4.01 to 10 ha).
Table 3 Distribution of respondents according to land holding.
Sr. No. Category Frequency Percentage
1. Marginal (up to 1 ha) 36 36.00
2. Small (1.01 to 2 ha) 29 29.00
3. Semi medium(2.01 to 4 ha) 24 24.00
4. Medium (4.01 to 10 ha) 10 10.00
5. Big (above 10 ha) 02 02.00
Total 100 100.00
1.4 Annual Income
It is reported from Table 4 that majority (52.00%) of the respondents were found in the Low annual income category i.e. ( up to Rs. 48000/-), followed by 43.00 per
cent in medium annual income category i.e. Rs. 48001 to 94000. It is also reported that 05.00 per cent of the respondents were found in the high annual income category i.e. Rs. 94001 and above.
Table 4 Distribution of respondents according to annual income.
Sr. No. Category Frequency Percentage
1. Low (up to Rs. 48000) 52 52.00
2. Medium (Rs. 48001 to 94000) 43 43.00
3. High (Rs. 94001 and above) 05 05.00
Total 100 100.00
1.5 Social Participation
It is noted from table 5 that more than half (56.00 %) of the respondents were found in the medium social participation category, followed by 27.00 per cent in low
social participation category. It is also reported that 18.00 per cent of the respondents were found in the high social participation category.
Table 5 Distribution of respondents according to social participation.
Sr. No. Category Frequency Percentage
302
2. Medium (up to 2) 56 56.00
3. High (up to 3) 27 27.00
Total 100 100.00
1.6 Extension Contact
It is observed from table 6 that majority (51.00 %) of the respondents were found in the Low extension
contact category, followed by 35.00 per cent in medium extension contact category. It is also reported that 14.00 per cent of the respondents were having low extension contact.
Table 6 Distribution of respondents according to extension contact.
Sr. No. Category Frequency Percentage
1. Low (up to 1) 51 51.00
2. Medium (up to 2) 35 35.00
3. High (up to 3) 14 14.00
Total 100 100.00
2. Impact of demonstrations of Paddy – PKV HMT As regards impact of demonstrations, the parameters like change in awareness, change in attitude, change in knowledge, change in adoption, change in area,
change in yield and change in productivity were studied and the data for the year 2012-14 are presented below. 2.1 Awareness
Table 7 Distribution of farmers according to awareness.
Sr. No. Category Before After
Number Percentage Number Percentage
1. Low (12 to 18) 63 63.00 25 25.00
2. Medium (19 to 25) 30 30.00 61 61.00
3. High (above 25) 07 07.00 14 14.00
Total 100 100.00 100 100.00
It is reveled from table 9 that before conduction of demonstrations 63.00 per cent and 30.00 per cent of respondents were having low and medium level of awareness about recommended practices respectively. However after conduction of demonstrations awareness level of 61.00 and 25.00 per cent of the respondents were observed in medium and low awareness category
respectively. Further, it is reported that high awareness level of the respondents (07.00 %) before the conduction of demonstration was increased to 14.00 per cent after conduction of demonstration.
It is thus inferred that the awareness level of the respondents was increased significantly after the conduction of demonstrations.
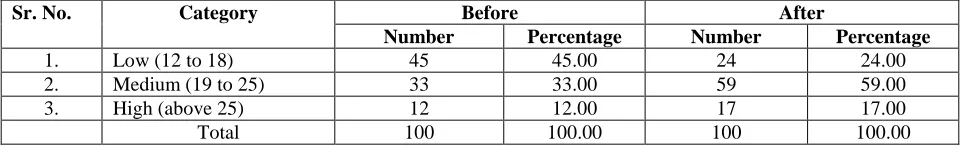
2.2 Attitude
Table 8 Distribution of farmers according to attitude.
Sr. No. Category Before After
Number Percentage Number Percentage
1. Low (12 to 18) 45 45.00 24 24.00
2. Medium (19 to 25) 33 33.00 59 59.00
3. High (above 25) 12 12.00 17 17.00
Total 100 100.00 100 100.00
It is reveled from table 8 that before conduction of demonstrations 45.00 per cent and 33.00 per cent of respondents were observed to be in low and medium level of possessed attitude category respectively. However after conduction of demonstration it was spectacularly observed that attitude level in low and medium category of attitude was sizeable changed to 59.00 and 24.00 per cent of respectively. Further, it is reported that 12.00 per cent of
the respondents were observed in high attitude category before demonstrations, while it was shifted to 17.00 per cent, after conduction of demonstrations of PKV HMT.
It is thus inferred that, attitude level of the respondents was significantly changed after conduction of demonstrations.
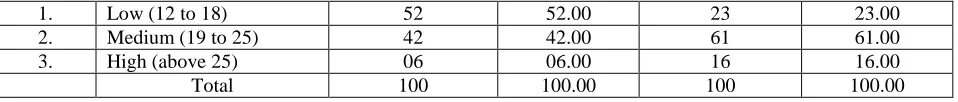
2.3 Knowledge
Table 9 Distribution of farmers according to knowledge.
Sr. No. Category Before After
303
1. Low (12 to 18) 52 52.00 23 23.00
2. Medium (19 to 25) 42 42.00 61 61.00
3. High (above 25) 06 06.00 16 16.00
Total 100 100.00 100 100.00
It is reveled from the table 9 that before conduction of the demonstrations 52.00 per cent and 42.00 per cent of respondents were having low and medium level of knowledge about recommended practices of gram respectively. However after conduction of demonstration knowledge level of 61.00 and 23.00 per cent of the respondents were observed in medium and low category respectively. Further, it is reported that high knowledge
level of the respondents (06.00%) before the conduction of the demonstrations were increased to 16.00 per cent after conduction of demonstration.
It is thus inferred that the knowledge level of the respondents was increased significantly after the conduction of demonstration.
2.4 Adoption
Table 10 Distribution of farmers according to adoption.
Sr. No. Category Before After
Number Percentage Number Percentage
1. Low (12 to 18) 50 50.00 24 24.00
2. Medium (19 to 25) 33 33.00 61 61.00
3. High (above 25) 07 07.00 15 15.00
Total 100 100.00 100 100.00
It is reveled from the table 10 that before conduction of the demonstrations 50.00 per cent and 33.00 per cent of respondents were having low and medium level of adoption of recommended practices of gram respectively. However after conduction of demonstration adoption level of 61.00 and 24.00 per cent of the respondents were observed in medium and low adoption category respectively. Further, it is reported that high
adoption level of the respondents (07.00%) before the conduction of the demonstrations were increased to 15.00 per cent after conduction of demonstration.
It is thus inferred that the adoption level of the respondents was increased significantly after the conduction of demonstration.
2.5 Increase in area
Table 11 Distribution of farmers according to increase in area.
Sr. No. Category Before After
Number Percentage Number Percentage
1. Low (1 to 2 acre) 71 71.00 56 56.00
2. Medium (2.1 to 5 acres) 24 24.00 37 37.00
3. High (above 5 acres) 05 05.00 07 07.00
Total 100 100.00 100 100.00
It is reveled from the table 11 that before conduction of the demonstrations 71.00 per cent of respondents were cultivating PKV HMT on 1 to 2 acre (low) of land, while after conduction of demonstration 37.00 per cent of the respondents were cultivated PKV HMT on 2.1 acres to 5 acres of land. Further, it is observed that 05.00 per cent of respondents cultivating PKV HMT on above 5 acres of land before the conduction of
demonstration while it was increased to 07.00 per cent after conduction of demonstration. The variation was not observed much because of the low land holding of the respondents.
It is thus inferred that the area under Paddy (PKV HMT) was increased significantly after the conduction of demonstration.
2.6 Yield
Table 12 Distribution of farmers according to yield.
Sr. No. Category Before After
Number Percentage Number Percentage
1. Low (up to 4 q/a) 57 57.00 29 29.00
2. Medium (4.1 to 5.5 q/a) 27 27.00 52 52.00
3. High (above 5.5 q/a) 16 16.00 19 19.00
304
It is revealed from table 12 that before conductionof demonstration 57.00 per cent and 27.00 per cent of respondents were observed in low and medium level of yield respectively. However, after conduction of demonstration yield level of 52.00 and 29.00 per cent of the respondents were observed in medium and low category respectively. Further, it is reported that high yield category of the respondents (16.00 %) before the conduction of demonstration was increased to 19.00 per cent after conduction of demonstration.
V.
CONCLUSION
The findings of the present study concluded that after conduction of demonstrations of PKV HMT
significant change is observed in awareness, attitude, knowledge, adoption, increase in area and yield Paddy (PKV HMT)
REFERENCES
[1] Afzal Ahmad, Guru Prem and Ramesh Kumar (2013). Impact of Frontline Demonstrations on Indian Mustard through Improved Technologies. Indian Res. J. Ext. Edu. 13(1): 117-119.
[2] Narkhede, M.B. and P.O. Ingle (2004). Impact of
Nalganga Irrigation Project on Beneficiaries. Asian Jour. Of Extn. Edu.,XXIII(1) : 148-156.
[3] Shrivastava, D., P.R. Singh (2004). Impact of Institutional Village Linkage Programme on Productivity of Crops. Asian Jour. Of Extn. Edu., XXIII(1) : 201-205.