Improving field management by machine vision - a review
Saeedeh Taghadomi-Saberi,
*Abbas Hemmat
( Department of Farm Machinery, College of Agriculture, Isfahan University of Technology (IUT), Isfahan 84156-83111, Isfahan, Iran )
Abstract: Growing population of people around the world and thus increasing demand to food products as well as high tendency for declining the cost of operations and environmental preserving cares intensify inclination toward the application of variable rate systems for agricultural treatments. Machine vision as a powerful variable rate appliance has been paid vast attention by agricultural researchers and farmers as technology consumers. Various applications have introduced for machine vision in different fields of agricultural and food industry till now that confirms the high potential of this approach for inspection of different parameters affecting productivity. Computer vision has been utilized for quantification of factors affecting crop growth in field; such as, weed, irrigation, soil quality, plant nutrients and fertilizers in several cases. This paper presents some of these successful applications in addition to representing an introduction to machine vision.
Keywords: precision agriculture, field management, image processing, variable rate.
Citation: Taghadomi-Saberi, S., and A. Hemmat. 2015. Improving field management by machine vision - a review. Agric Eng Int: CIGR Journal, 17(3): 92-111.
1 Introduction
1Playing a substantial role in the progression of human
civilization, agriculture is taken into account as the
mother of all cultures. Recently, yield per land unit has
intensified many times due to great attempt to apply new
techniques for agricultural practices, of which traditional
forms are either cumbersome, expensive or time
consuming. This attempt provides a cautious and precise
management of all inputs by considering the complex
interaction of soil, seed and agro chemicals (Anand and
Ashwin Patil, 2012). Modern agriculture is completely
different from traditional farming. The management
practices have changed substantially and variable rate
application (VRA) of inputs are paid attention more due
to factors; such as, increasing productivity per unit area,
increasing agricultural operation speed and applying
precise amounts of inputs in order to prevent
environmental contamination and lower the costs. Such
accurate and fast operations are impossible by only
Received date: 2015-02-27 Accepted date:2015-06-16
*Corresponding author: Saeedeh Taghadomi-Saberi, PhD student, Department of Farm Machinery, College of Agriculture, Isfahan University of Technology (IUT), Isfahan 84156-83111, Isfahan, Iran. Email: [email protected]
human power. New techniques and among them machine
vision (MV) as a powerful instrument showed great
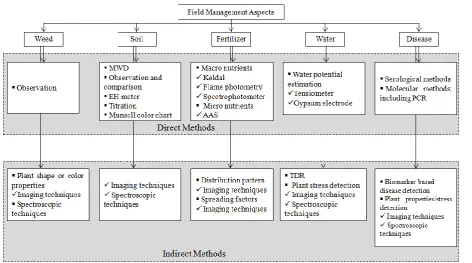
potential to realize these factors. Determining
field-related factors is necessary to apply VRA. The
techniques of measuring field-related factors can be
broadly classified into direct and indirect methods.
1.1 Precision agriculture
Precision agriculture or site specific crop management
(SSCM) is a farming management concept based on
observing, measuring and responding to inter and
intra-field variability in crops. Crop variability typically
has both spatial and temporal components which make
statistical/computational treatments quite involved. The
aim of precision agriculture is optimizing returns on
inputs while preserving resources. In fact, SSCM explains
the use of environment and crop parameter variability for
precision application of agricultural inputs. Based on
SSCM, there exists three main approaches; including
farming suspension in field or a piece of land because of
its low efficiency and high cost of desirable inputs,
conventional and consistent application of inputs because
of a relative consistency over the farming land and trivial
increasing in productivity profits due to the costs of VR
methods and finally the most important approach which
has been paid a great attention in the last decades is the
VRA of inputs leading to lowering the cost and
environmental contamination, and increasing
productivity.
VRA is divided into two major parts: Map-based VRA
and Sensor-based VRA. Both methods contribute to
coincidence of inputs to existence conditions of farming
land and plant need. Both of these methods have some
advantages and disadvantages, and in order to maximize
economical and environmental profits, farmers apply one
of these methods or a combination of them. However the
map-based VRA have some advantages, such as more
process on sample d data because of time delay between
sampling and input application, the errors of positioning
for whether sampling or input application and temporal
variability are unavoidable in this method.
1.2 The role of MV in precision agriculture
Many researchers have focused on MV around the
world and this technique is improving and developing in
diverse scientific and practical fields, such as safety,
medicine, farming, food engineering and packaging. The
theoretical and scientific improvement along with the
abundance of technical apparatuses and decline in their
costs justify and encourage more applications of MV
especially in agriculture which is being led to automation
and intelligentization to produce and supply high demand
perspective especially in the plant protection field, that
result in crop management (Pokharkar and Thool, 2012).
However it may seem that MV in agriculture can
simulate human eye to complete the measurement and the
evaluation processes for replacing human's operation at
first, its application in recent years demonstrated that
MV-based systems can been utilized beyond the common
view of eye simulation. The application of IR images for
water stress detection and hyperspectral spectral indices
for nitrogen content estimation are the examples of this
claim and the growing use of spectral images boosts it
(McCarthy et al., 2010; Li et al., 2013).
There are a number of reasons which lead to the
high-extent application of MV in farming; such as,
relatively low cost of apparatus, consistency, high speed
and accuracy. Right now, MV is being adopted at
commercial level in some cases.
2 An introduction to machine vision
MV originated in the 1960s and as mentioned
previously it has been developed with its applications in
various fields: remote sensing; factory automation;
forensics; medical diagnostic imaging; autonomous
vehicle and robot guidance. In order to take and interpret
an image as non-contact optical sensing and processing
devices, MV embodies several processes in sequence:
image acquisition with a sensor, analysis by means of
computing software and hardware for doing a predefined
visual operation. Correspondingly, MV technique
consists of three major steps: image acquisition, image
processing-analysis, I/O control. In this paper two first
steps have reviewed, i.e. image acquisition and image
analysis, because agronomy researchers highlighted them
more. Moreover, control components are applied without
any redesigning and their producers provide some
indispensable technical support (Ji et al., 2009).
2.1 Hardware
Diversity in hardware features involving power, price,
computing speed and so on makes MV in agriculture
more practical. Researchers choose their own acquisition
and analysis methods based on case-study and their
expectation from image quality. A MV system includes
five fundamental constituents: illumination, a camera, an
image capture board (frame grabber) for image
acquisition, computer hardware and software for image
analysis. It is obvious that illumination influences the
quality of images and different kinds of illumination
cause different characteristics in images and make the
objects blurred or clarified. Insufficient precision in this
stage can impose hard work in analysis step and result in
low accuracy and efficiency of system.
Designing an illumination system consists of two
major parts: the lighting arrangement which is grouped as
front or back lighting, and the choice of light sources
among incandescent, fluorescent, lasers, X-ray tubes and
infrared lamps (Brosnan and Sun, 2004). Furthermore,
illumination which is one of the key parts of designing
MV systems is considered in two conditions i.e. outdoor
and indoor. Under controlled conditions of indoor cases,
analysis is easier while various conditions of outdoor
cases such as the varying intensity of daylong light and
different climates make analysis more complex. Shadows
due to light sources, sufficient contrast, reflection, other
noises and various characteristics of images especially
brightness by virtue of different conditions are challenges
of illumination. The mentioned challenges have
motivated researchers to study different alternatives for
overcoming changing parameters. For instance in a scarce
work, Søgaard and Olsen (2003) replaced segmentation
step by the computation of the centers of gravity in the
image for detecting the position and direction of the crop
rows under a wide range of natural illumination
conditions. Therefore, they could reduce the
computational burden of the image processing software.
In this approach, gray images were divided into
approximately 15 strips, vertical summations of grey
values in the strip were computed and this vector then
was split up into sub-vectors with corresponding lengths
to the nominal inter-row spacing in the middle pixel row
sections to obtain a combined estimate of the positions of
centers, the center of gravity was determined and the
estimated row positions were projected back into the
image strip.
Common sensing techniques include monocular vision
with an RGB camera, stereo vision and 3D structure,
multispectral and hyper spectral imaging, range sensing,
and CT scanner. However outdoor applications involve
difficulties which make automation challenging, such as:
various natural lighting(both intensity and direction), the
overlapping of neighboring plants and background
material. Stereo vision, multispectral imaging and range
sensing as improvement to MV reduce the effect of
surrounding factors on image and lead to simpler and
more reliable data processing.
Monocular sensors capture images like visual
perception of humans. In other words, human vision
simulation is the objective of such systems. Based on the
objective of study, color or shape features can be
underlined; for instance these features are considered for
fruit identification and species classification. The most
common sensor in this cases is CCD camera either of the
array type or line scan type (Brosnan and Sun, 2004). By
using color indices, vegetation discrimination from
background is possible in this method(Wang et al., 2013).
Moreover a particular situation for camera; for example
an up-ward position under the canopy make a back-lit
condition which is useful for LAI estimation(Jonckheere
et al., 2004). In this class of imagery, some mechanical or
optical components can be applied to make features of
interest more identifiable; for example, as vegetation has
higher reflectance than soil in NIR wavelengths, their
dissociation is possible with NDVI (Normalized
Difference Vegetation Indices). An alternative for making
uniform illumination is using a cover during image
acquisition which is unlikely unpractical because of the
imposed inconvenience and time delay during measuring
operation and its application is impossible especially for
large plants. These cameras are more reliable for more
controlled condition of easier indoor application. Small
variation in plant configuration e.g. changes in leaf
disposition which can be related to wilt and thus water
stress is identifiable with RGB cameras. In addition MV
assisted air blower has capability of foliage
discrimination from stem and fruit because of its
movement (McCarthy et al., 2010).
Stereo image has the capability of crop growth control
(e.g. phyllotaxis), species discrimination (by height
change identification) and reconstruction 3D models by
determining structure parameters of plants. Probably the
most challenging part in this domain is matching stereo
images (McCarthy et al., 2010).
A multispectral image containing data at specific
frequencies beyond the visible light range across the
electromagnetic spectrum provides additional information
that human eye fails to capture with its receptors.
Differences between cellular structures, thermal and
hardness attributes are recognizable by NIR, MIR and
X-ray. Weed and plant classification is completely easier
by means of these images awing to the significant
discerning wavelength between them. Water stress
detection is possible by visible, IR, NIR, UV and
microwave radiation (McCarthy et al., 2010). Fruit
discrimination from foliage and stem identification are
possible with hyperspectral image and X-ray, respectively.
However, high cost of these devices and some safety
regulation limit their application. As range sensors are
active, they are more reliable in various lighting
conditions in comparison with passive sensors. Laser and
ultrasonic sensors in this class have been used for
measuring canopy characteristics (Tumbo et al., 2002).
The digitization process, in which an image is
converted to numerical form containing pixels, is done by
digitizer or frame grabber. Selection of the frame grabber
is based on the camera output, spatial and grey level
resolutions required, and the processing capability of the
processor board itself (Brosnan and Sun, 2004).
2.2 Image analysis
Actually, image analysis is the core of computer
procedure in order to enhance the image quality and
remove drawbacks. Image processing involves color
space transforming, filtering, graying, and edge detection,
etc. These procedures finally lead to object detection and
feature extraction which is used in the subsequent control
systems for decision making.
In this scenario, a number of preprocessing operations,
such as median and Gaussian filters are applied to reduce
noises and blurring, and to enhance desired features of
image however some of these operations have bad effects
on edges. So, one should compromise between image
enhancement due to filter application and preserving the
edge of image objects by controlling the size of filters.
Image enhancement is possible whether in spatial
domain; for example by using spatial filtering and gray
level transformation for some cases such as increasing
contrast and dynamic range, or in transform domain such
as frequency domain for instance by using FFT or
wavelet for cases such as edge detection or smoothing.
For instance in the case of sharpening image, Laplacian
filter or unsharp masking, done respectively in spatial and
frequency domain, are applicable.
Most of images are corrupted by sinusoidal noises
specially because of camera vibration in agricultural
applications. By transforming the image into frequency
domain and based on noises distances, such noises can be
eliminated by using notch or band reject filters. After
image enhancement, the most important step of image
processing is considered, ''image segmentation''.
The main objective of image segmentation is to divide
the image into target regions which contain useful
information for decision making and non-target regions
of background. Depending on the difference between
target and non-target regions, two segmentation methods
are used: one is the segmentation of target itself, and
another one is the extraction of closed border; which the
first and the second ones are used for high and small
differences, respectively. For this purpose, there exist
three different techniques including: thresholding,
edge-based segmentation and region-based segmentation
(Brosnan and Sun, 2004).
Thresholding technique has applied in great number of
agricultural applications owing to its intuitive properties
and simplicity of implementation. In this technique, the
object pixels are segmented of background pixels by
using a threshold. The threshold can be simply
determined by gray-level histogram and based on the
existent differences between reflection features of
background and object surfaces. Algorithm of Otsu is a
nonparametric and unsupervised method of automatic
threshold selection for image segmentation
(Taghadomi-Saberi et al., 2014a). Smoothing noisy
images for example by using average filter can improve
the outcomes of thresholding remarkably.
Edge detection is the most common approach for
detecting meaningful discontinuities in gray level. The
first- and second-order digital derivatives for the
detection of edges in an image are taken into
consideration. In fact, whenever the first-order derivative
is higher than a threshold or the second-order one has a
zero transition, there exists edge possibility. Canny and
SUSAN are from the methods of edge detection. SUSAN
which is newer, is suitable for angular edges. Generally,
edge detection methods are not advisable for closed
region segmentation.
In contrast with thresolding and edge-based
segmentation which are respectively based on the
distribution of pixel properties (such as gray-level values)
or based on discontinuities in gray-levels, regions are
segmented directly in region-based segmentation. In this
method, the adjacent pixels which are similar based on
their features such as color or texture are detected as a
single region.
Generally, a region or boundary image which is the
outcome of segmentation is appropriate for size
determination and texture or defect detection. In addition
to image explanation, morphological operations can be
applied for segmentation improvement. After image
features are based on region, color, texture and etc.
Several researchers have introduced various color
features by using statistical criteria (Taghadomi-Saberi et
al., 2014a and b). Finally by using extracted features and
artificial techniques, such as: ANN, fuzzy, ANFIS, GA
for building database, management decisions are made
and sent to control systems for VRA.
3 Applications
Now, MV has various applications in different parts of
agriculture and these applications are becoming better
and better in whether quality or quantity to contribute
farmer for better field management. Remarkable number
of articles on the inspection of variables affecting crop
growth by using MV represents the high potential of this
approach for farming. Recent advances in hardware and
software have aided in this expansion by supplying
inexpensive powerful alternatives, leading to more
investigation on the development of computer vision
systems in agriculture (Brosnan and Sun, 2004).
3.1 Soil
MV has applied in the quantification of soil related
features in a large number, just like other parts of
agriculture. Soil deformation and the effect of
physicochemical stresses on it, structural changes
evaluation, pore space and soil compaction
characterization, surface soil organic matter estimation,
soil moisture prediction, pedological features and soil
redoximorphic features quantification are the examples of
MV application in the quantification of soil related
features which are instrumental parameters for soil
management and the evaluation of plant conditions. Soil
texture is determined by the size and type of particles that
make up the soil (including the organic but mostly
referring to inorganic material). Soil texture is really
important for agriculture. It influenced some factors, such
as: water infiltration into the soil. Coarse-grained sandy
soils have large spaces between each grain and allow
water to infiltrate quickly. Consequently, it is necessary
to irrigate such soils more. However clay soils, specially
weighty ones, hold water strongly. It makes water
inaccessible for plant and therefore crop wilting is more
probable. Generally, clay soils are known to have weak
fertility and better drainage (Nasiri Tousi, 1995). Diverse
in the size of soil particles, different soil textures are
discernable using MV.
Soil structure is the arrangement of soil particles into
groupings. These groupings are called peds or aggregates
which often form distinctive shapes typically found
within certain soil horizons. Developed and stable soil
structures have good infiltration proportional to the
climate. So working on such soil is easy and not
power-demanding. From single to a few millimeters
structural units are the constituents which make an
appropriate soil for plant growing. Generally in regions
such as Iran, adding organic material to arable soil and
performing tillage operation in optimum condition
(moisture content of 0.8-0.9 plastic limit) are suitable for
soil structure development and preservation (Khajeh Pour,
2002).Soil structure is important for water and air
infiltration and their availability to plants and
microorganisms cut down perspectives which influences
the soil quality. Various types of images have been used
for the inspection of soil structure, such as CT scanner,
back scattered electron images, and digital images.
Soil deformation is an unending process in the
pedosphere that as well physicochemical stresses,
primarily alternating mechanical and hydraulic stresses,
permanently re-arrange the formation of solid particles.
So soil structure and consequently all structure related
soil functions are highly dynamic. This makes complexity
that restricts the treatment of soils as static porous media
(Or and Ghezzehei, 2002). Understanding the complex
mechanisms involved in structure evolution and dynamics
have to be overcome to better predict soil responses to
changes in environmental boundary conditions resulting
from natural and anthropogenic factors. Digital image
processing techniques have provided useful tools for
quantifying various soil attributes; for instance, Protz et al.
quantify soil voids, organic material, mineralogy, and
SRFs. Adderley et al. (2002) refined digital image
processing of soil thin sections to aid in feature
interpretation. Other important cases which have been
studied with MV systems are soil redoximorphic features
which are useful for documenting wetland soil
morphology, correlating soil water and oxygen content
with soil color, studying altered drainage effects on soil
morphology, correlating subsurface flow paths with soil
color, and documenting restrictive and subsurface horizon
effects on hill slope hydrology. O'Donnell et al. (2010)
developed a new method of soil redoximorphic features
identification and quantification from soil cores using a
digital camera and image classification software. Digital
image reconstructions were also used by Peth et al. (2010)
to quantify local structural pore space characteristics and
local soil deformation processes which could improve the
conceptual understanding of the physical behavior of soil
systems.
In the last decade of the 20th century a tendency had
been existed for using back scattered electron images,
providing a great contrast between pores and solid
material, to characterize pore space. Sort and Alcaniz
(1999) used these images and image-processing computer
equipment to investigate the effect of the application of
sewage sludge on soil porosity over a period of 28
months. Aydemir et al. (2004) used digital image
processing and unsupervised nearest neighbor
classification for the identification and quantification of
pedological features in soil thin sections, such as: calcite,
void, sesquioxides, and plasma with much less error than
other methods. However they were not successful at
identification of quartz as well, and they suggested the
use of incident UV light which might overcome the
difficulties with basal sections of quartz.
CT images have been applied in this field, too. In
order to evaluate changes in the structure of clayey soil
samples with surface compaction submitted to wetting
and drying cycles, Pires et al. (2011) used a gamma-ray
CT scanner for analyzing changes in soil structure of a
very same sample, which cannot be obtained by using
traditional techniques of MV. By the use of CT, they
could specify the thickness of the compacted region and
alterations in soil porosity distribution which are very
important, for instance in estimating hydraulic parameters
in infiltration models, water retention and movement.
Soil compaction affects the pore system, and
consequently the soil mechanical parameters like
pre-consolidation load or bulk density and the transport
properties of the pore system. Compaction inducing the
changes of water infiltrability and the availability of
water and air to plants and microorganisms may hinder
the functioning of the soil environment. Some researchers
have focused on soil compaction by using digital image
processing. Accordingly, Ewing and Horton (1999),and
Forrer et al. (2000) developed methods to process images
of flow patterns digitally in order to trace the infiltration
pathways e.g. in compacted and non-compacted soils.
Kulli et al. (2003) applied digital image analysis to study
the effects of the mechanical impact applied by a sugar
beet harvester on soil porosity, bulk density and on the
water infiltration regime under field conditions.
Having cognizance of growing concern about the
potential environmental hazards from excessive uniform
fertilizer and herbicide application rates to
spatially-variable landscapes and the effect of soil organic
matter (SOM) content on many current herbicide and
fertilizer recommendations, estimation of SOM content
can be very useful for reduction of the environmental
hazards associated with over-applying crop inputs such as,
surface and groundwater contamination. Furthermore,
OM causes positive effects. This can be useful for
management decision, including the modification of soil
structure, the improvement of soil ventilation and air and
water infiltration into it, the supply of nutrient for plant
and microorganisms and the increase of cation exchange
capacity (Khajeh Pour, 2002). Aerial images can be a
good and fast choice for SOM estimation as well as other
features of soil (Schepers et al., 2004 and Chen et al.,
variety of strategies to evaluate the capability of an active
sensor and a wide-band aerial image to estimate surface
SOM. Among their applied strategies, interpolation,
field-specific and intercept-adjusted strategies showed
more accurate predictions of OM in comparison with
multiple-layer, uniform and universal prediction models.
They claimed their obtained accuracy could be increased
by acquiring the data when there is minimal surface
residue or by accounting for soil moisture content with
supplementary sensors at the time of data collection.
Soil color is a good representative for soil features in
many cases. Among the possible color of soil, dark brown
and black colors show high amount of humus. Good
ventilation and infiltration are from features of such soil.
However ventilation is less in yellow soil and yellow
color represents the existence of ferric in form of ferro.
Soil heat also depends on soil color. Soil heat is
considerably important for agriculture. Dark color soil
absorbs heat more and consequently is warmer
(NasiriTousi, 1995).By using digital image analysis, van
Huyssteen et al. (2006) demonstrated the quantification of
soil color from 10 excavated soil pits. However this
methodology could accurately reproduce only one
Munsell Hue which limits the extension of this method to
the continuum of soil colors. Soil color can be a
characteristic of the evaluation of soil wetness. For the
primary aim of the prediction of soil moisture content and
SOM, Kumar Roy et al. (2006) used soil image texture
statistics to extend the possibility of using RGB color
space in representing composite soil color.
Now we can say that even classifying soil surface
states in relation with land cover and tillage practices and
detecting the agricultural operations such as harrowed
fields and ploughed fields are possible with MV
techniques. Hadria et al. (2009) were able to classify
fields into three major classes: ploughed, harrowed, and
not ploughed and not harrowed based on FORMOSAT
and ASAR images with simple mapping algorithms
including band thresholding and decision tree.
3.2 Weed
A harmful and unwanted plant is considered as weed.
In other words, weed is a plant which grows undesirably.
There are a lot of disadvantages for weed, including:
entering competition for water, nutrient and light with
crop, trouble causing for agricultural operations and
machinery tools, weed seed and harvested crop
integration which reduce the product worth, shadow
shedding on crop, crop-made nutrients consumption (for
example, Custasp cause remarkable damages in tobacco,
alfalfa, clover and cotton) and contribution to the
dispersion of pest and diseases (Rastegar, 1993).
Information on weed distribution in the field is necessary
to implement spatially variable herbicide application or
other implements to remove weeds from the field (Kiani
and Jafari, 2012). Whereas non-imaging photodiode
sensors are unable to distinguish between plant species,
the measurement and application should be possible
on-the-go, not in two separate steps for mapping and
application, since the weed management needs a fast
reaction for weed control decisions during a single
management operation (Andújar et al., 2012).Weed
detection systems have been developed mainly to make
more effective use of pesticides, either for band spraying
along a crop row or detecting individual weed or crop
plants for treatment (Bond et al., 2003). As mentioned in
3.1.section, MV techniques can lead to the site-specific
application of herbicides. Because of high labor, energy,
and chemical demands, a method of automatic detection
along with site-specific application is more efficient not
only from an environmental perspective but also from an
economic perspective. Using weed maps based on MV
techniques, farmers can identify the weed distribution
within the crop (Yang et al., 2003).The main challenge in
this application of MV is to achieve appropriate
discrimination between weeds, crop and soil in outdoor
field images under uncontrolled conditions and varying
light, soil background texture and crop damage
(Burgos-Artizzu et al., 2009).There are a wide range of
field based on morphology, color and texture features of
images.
Yang et al. (2003) developed a simple method, “greenness method”, in which the red, green, and blue
intensities of each pixel were compared. Since the images
were taken between corn rows, based on the percent of
greenness area in the images, weed patchiness was
estimated to create a weed map. Site-specific herbicide
application rates were determined by use of a fuzzy logic
model and resulted in saving significant amounts of
herbicide.
Søgaard (2005) used young weed seedlings with up to
two true leaves to establish a database containing image
examples of 19 of the most important weed species in
Danish agricultural fields. By using this database, an
active shape model for each species was constructed and
then the algorithm of image processing that could classify
new unknown weed seedlings by comparing them with
the weed models has been developed for the identification
of weed species.
Hague et al. (2006) applied the red, green and blue
channels of a conventional CCD camera to compute a
vegetative index2 which is invariant over the range of
natural daylight illumination i.e. it is insensitive to the
amplitude of the illuminant. The image can be segmented
into soil and vegetative components using a fixed
threshold. In their procedure a previously reported
algorithm (Hague and Tillett, 2001) was applied to
robustly locate the crop rows. In few words, they
transformed the original image to gray scale and then
divided it into eight horizontal bands in this algorithm.
The intensity of the pixels across these bands represented
a periodic variation due to the parallel crop rows. Based
on information about camera position and row crop
spacing, crop rows were located. So positions over and
between the crop rows assessed to crop and weed growth
(Hague et al., 2006).
2 . index=
) 1
( a
a
b
r
g
, where a is a constant
A similar work has done on the identification of one
of the most invasive and persistent weed species on
European grassland, the broad-leaved dock, in complex
mixtures of perennial ryegrass by Gebhardt et al.
(2006).However they obtained their photographs under
more controlled conditions, such as constant recording
geometry and illumination. By transforming the RGB
color images to grayscale intensity images and using a
threshold, binary images were derived. After some
morphological operation, the remaining contiguous
regions were considered to be objects. At last, they
calculated shape, color, and texture features for each of
these objects. They also accomplished a
Maximum-likelihood classification to discriminate
between the weed species. Moreover, rank analysis was
used to test how combinations of features affected the
classification result. It was concluded that a combination
of all features , including shape, color and texture
attributes, is the best.
Gebhardt and Kuhbauch (2007) developed a new
algorithm to improve classification accuracy. Weeds and
other homogeneous regions were segmented
automatically in digital color images using local
homogeneity and morphological operations. Additional
texture and color features were identified helpful to the
differentiation between grassland weeds using a stepwise
discriminant analysis in SPSS software. As well,
maximum-likelihood classification, in MATLAB
Classification ToolBox, was performed on the variables
retained after discriminant analysis. In this way they
could improve Classification accuracy. The effect of
image resolution on classification results was investigated
in a subsequent study. Image processing time ranged
from 45 s for the full resolution images to 2.5 s for the
lowest resolution ones with a trivial reduction in detection
rates accuracy (Gebhardt and Kuhbauch, 2007). In most
cases agricultural application of MV, the high resolution
of images is not useful and it is time consuming which
Nieuwenhuizen et al. (2007) compared two
color-based MV algorithms, which are faster and less
complex than shape and texture-based algorithm, for
in-field volunteer potato plant detection in two sugar beet
fields. They used a combination of K-means clustering
and a Bayes classifier as the first algorithm and training
an Adaptive Resonance Theory 2 (ART2) Neural
Network for Euclidean distance-based clustering as the
second one. The results of both methods were closely
matched within completely different fields. In another
work of Nieuwenhuizen et al. (2010), an adaptive
Bayesian classification method was developed for the
same problem. In this way, they could improve the
classification accuracy for the constant and especially
changing natural light conditions (from 84.6 and 34.9% to
89.8 and 67.7%) in comparison with non-adaptive
scheme.
Jones et al. (2009) developed a new method for weed
detection based on modeling agronomic images of a
virtual camera placed in a virtual field, and then the
effectiveness of the developed algorithms was measured
and compared. They evaluated the performance of two
crop/inter-row weed discrimination algorithms based on
Gabor filtering and based on the Hough transform for
images with and without perspective effects. They
concluded that the method based on the Hough transform
has better results in all cases.
Burgos-Artizzu et al. (2009) processed digital images
of a crop field by using a computer-based image analysis
to estimate the percentages of weeds, crop and soil
present in the image. They used a real time Case-Based
Reasoning (CBR) system that determines which
processing method, involving two non-CBR, one
pseudo-CBR and one CBR methods, is the best for each
image. However the images were taken indifferent fields
and under different and uncontrolled conditions, such as
different light, crop growth stage and size of weeds, the
obtained correlation coefficients with real data were
almost 80%.
In a comprehensive work, a real-time MV system for
crop/weed discrimination in maize fields integrated into a
treatment system was introduced by Burgos-Artizzu et al.
(2011). The system which had very good results under a
wide variety of conditions consisted of two independent
subsystems, a real-time image processing and a slower
and more precise processing to modify the first
subsystem’s mistakes. This system showed acceptable
results even in the presence of dramatic sowing errors or
abrupt camera movements.
3.3 Disease and pest
Pathogenic agents change plant anatomy, morphology
or metabolism. These microorganisms affect not only
crop quality but also its quantity (Khajeh, 2002). Early
disease detection and pest insect population monitor are
currently key issues in agriculture. Poor control in some
cases causes diseases to spread to neighboring fields. So
achieving high accuracy assessment for site-specific
management is completely obvious. Traditionally, pest
management has been done by means of a regular spray
program based on a schedule without any special
attention to the presence or likelihood of presence of
insects in the field. An automatic method for monitoring
pest can fight bioagressors of crops and minimize
pesticide usage, which is resulted in environmental and
economical profits. MV has had some successful
application in this part as well as other parts of precision
agriculture.
3.3.1 Insects
To detect biological objects on a complex background,
Boissard et al. (2008) combined knowledge-based
systems for image analysis and natural object recognition,
image processing programs and machine learning. They
paid special attention to low infestation cases and their
results finally showed that this automatic detector was
reliable for detection and counting of whiteflies at a
mature stage of roses. For the similar purpose of whitefly
detection in a greenhouse, Qiao et al. (2008) developed a
density of whiteflies on sticky traps as convenient
samplers based on size and color.
One of the most popular methods to monitoring pest
population is distributing a set of traps strategically across
an area and then collecting trap data with visual
inspection done by operators every 15 to 30 days. This
method is not only labor intensive and therefore costly,
but also impossible to be synchronized for all monitoring
traps. Inspired from this traditional method, López et al.
(2012) designed and developed an autonomous
monitoring system based on a low-cost image sensor,
able to capture and send images of the trap contents to a
remote control station. Covering large areas with very
low energy consumption over several months are from
positive advantages of their system.
Recently, internet is used in combination with image
processing techniques to do additive works such as
variable rate application map delineation, image data and
other monitoring data (such as temperature) transmission
and sharing data with experts (Koumpouros et al., 2004
and Fukatsu et al., 2012). This may decrease required
time to perform a diagnosis and provide a more versatile
way for telecommunication among experts, farmers and
extensions agents. Accordingly, Fukatsu et al. (2012)
used WLAN for sending acquired data to be managed and
analyzed in order to provide useful information on insect
count. They used the number of white pixels for
estimating insect population. As another example of
internet role in nowadays systems, McKinion et al. (2009)
evaluated the possibility of using multispectral imaging
for developing GIS maps for monitoring cotton pests for
seven years in order to apply spatially variable
insecticide.
Wen and Guyer (2012) used three models; including,
an invariant local feature model using affine invariant
local features, a global feature model using 54 global
features, and a hierarchical combination model based on
local feature and global feature models to develop an
image-based automated insect identification and
classification method. As expected, the combination
model had better results in comparison with the other
models because of the combine advantages of both
models.
3.3.2 Pest
The fluorescence imaging has been applied in
monitoring leaf diseases in some cases (Sankaran et al.,
2010 and Lenk et al., 2007).The development inspection
of tobacco mosaic virus infection in tobacco plants
(Chaerle et al., 2007) and detecting yellow rust in winter
wheat (Bravo et al., 2004) are from its examples.
Multispectral and hyperspectral images provide useful
information about plant diseases but researchers should
focus on the selection of disease-specific spectral band
and selection of statistical classification algorithm for a
specific application, which depends on the data
acquisition setup (Sankaran et al., 2010).Bravo et al.
(2003) investigated the application of visible-NIR
hyperspectral imaging for the early detection of yellow
rust disease (Pucciniastriiformis) in winter wheat and
they could obtain satisfying results. By using air-borne
hyperspectral imaging and different vegetative indices,
Shafri and Hamdan (2009) indicated the capability of
these images for detection healthy from diseased oil palm
plantations to ganoderma basal stem rot and management
of plantations in large scale.
Han et al. (2012) studied the feasibility of on-line pest
classification using MV technology. They used a digital
signal processor because of its powerful data processing
functions and a host control platform for further
identification. They gained satisfying results and the pest
images were very clear and sufficient. Pokharkar and
Thool (2012) used technique of MV to detect and
segment infected parts of the particular plants and then
processed the segmented part to extract more features that
make general idea about pests on greenhouse crops.
Various technologies have been used in the past to
measure temperature of plant leaves which can be related
to plant health. For example, McGuire and Pearson (2006)
used visual light reflectance to generate NDVI images.
therefore taught that the optimum time for image
acquisition using the disclosed process is within two
hours of "solar noon" and on cloudless days. This makes
it very impractical for a commercial application. This
methodology was only able to indicate the existence of a
problem after the change of plant structure and therefore
its color. In many cases, this is too late to take corrective
action.
Thermography is another method for monitoring the
health of plants in a field. Sutton(2013) applied this
method. This system acquired a thermal image indicative
of thermal energy emitted by the plants and processed the
thermal image to assess variations in the temperatures
among the plants without any reliance on sensing
reflected light or ground-based measurements. By means
of a trained thermographer, Sutton could detect disease or
other stress factors in vegetation before they became
apparent to visual or near infrared cameras.
3.4 Water
Water is one of the major items in the development of
agriculture. In fact, it plays an effective role not only in
arid regions but also in moist regions. Moreover, it is the
most important limiting factor for cultivation area. While
water is vital for plant to live and grow, the large amount
of water around root causes plant asphyxiation (lack of
oxygen) (Shamsaei, 1995).
If the amount of water is sufficient in soil, plant may
need less force to absorb water. Consequently, it will
grow better. It is obvious insufficient irrigation causes
increase in required force to absorb water and therefore
decrease in the absorbed water. It results in non-optimal
growing and consequently performance reduction. On the
other hand, inordinate irrigation especially in warm and
dry climate causes some troubles because natural drain
are disable to give off the further water. Water returns to
surface and evaporates. This causes solution aggregation
and therefore soil salinity and infertility (Mahallati,
1995).Filling large pores with water and lacking oxygen,
NO3 converts to NO2. NO2 is not only unavailable for
plant but also is harmful for its growing (Mahallati, 1995).
In order to determine the amount and schedule of
irrigation, some instruments such as tension meter and
gypsum electrode are applicable for estimating water
potential. Whenever a perfect irrigation is managed, a
desirable performance is possible (Rastegar, 1993). It
means irrigation in optimum time and content improves
productivity. Determination water stress, irrigation canal
leakage and discharge are from the other applications of
MV in water management of field. Productivity analysis,
irrigation scheduling, irrigation planning and water
allocation can be handled only with timely and accurate
information about water consumption by crops
(González-Dugo et al., 2013).
3.4.1 Water stress
Water potential affects the amount of photosynthesis
and consequently plant growing. However the response of
photosynthesis and various plants growing are variable in
leaves with different water potential. Generally, the rate
of photosynthesis decrease is higher than the rate of water
decrease in plant or soil. Moreover, retrieving
photosynthesis is remarkably slow after a period of water
deficit. However a complete retrieving is impossible
when damages are drastic (Khajeh, 2002). As
aforementioned, moisture stress as well as its effect on
the vital process of photosynthesis is really instrumental.
MV and IP have been frequently applied to reveal the
water stress in plants (Wang et al., 2010 and Meron et al.,
2010 and 2013). Recently, some researchers have focused
on the feasibility of variable-rate irrigation; so mapping
crop water status is unavoidable to specify site-specific
crop water demands. Accordingly, Meron et al. (2010 and
2013)used remote thermal sensing for mentioned map
delineation in detail by using geo-referenced high
resolution thermal images and artificial reference surfaces.
In this study, crop water stress was determined based on
canopy temperatures. By using thresholding technique
canopy-related pixels were segmented. Then the coldest
33% of the pixel histogram was considered as canopy
temperatures. They found a linear relation between leaf
stress index values. Finally stress levels were applied to
divide fields into sections for spatially variable irrigation
scheduling.
Typically, measurement data of the IR thermography
sensing system consists of a reference optical image and
an IR image. The optical image allows the underlying
plant canopy of interest to be flawlessly identified.
Registration of optical and IR images is crucial for
variable rate irrigation system in this cases, and it is of
course challenging due to the possible translation and
rotation of images. Wang et al. (2010) presented an
autonomous and efficient algorithm process for extracting
plant water stress information which can be fed into an
automated irrigation control system. In fact, they
developed a completely automatic image registration
algorithm for the alignment of optical and IR image pairs.
The comparisons with conventional techniques confirmed
the effectiveness and successes of their proposed
algorithm.
In a similar study and to overcome the problem of
referencing, Jiménez-Bello et al. (2011) took the thermal
and visible images at the same time so that they could
develop a batch processing, no operator participated
method by using unsupervised classification to calculate
canopy temperature and dramatically reduce the time
needed for image analysis. In this way, sunlit and shady
leaves could be detected and isolated.
Considering the capability of thermal imagery for
water status determination, optimal time for image
acquisition and other parameters, such as the angle of
view should be investigated for the efficiency
optimization of these systems. Generally, studies have
shown that midday is the optimal time for thermal image
acquisition and angle of view and spatial resolution do
not have any special effect on the representation of the
measured leaf water potential for canopy
temperature-based expression of water status by using
thermal imaging system (Alchanatis et al., 2010),
moreover, crop evaluation has an important influence in
the obtained results from this method (Jiménez-Bello et
al., 2011). However measurement of crop temperature for
estimating water stress has a wide literature, soil
interference on the measured signal or directional effects
involved in temperature measurements related to sun
sensor angles configuration and plant structure cause
some limitations into the application of this method.
Luquet et al. (2003) used an energy balance model which
was based on 3D description of plants to simulate the
temperature variability of cotton plants in accord with
water status and plant structure. Heat exchange with the
plant, water balance and soil temperature were
computable with this model. As this system could handle
partially covering plants, analysis of the limits of water
status expression based on crop temperature was possible.
Another symptom of water stress is wilting. Recently,
a sensing method based on 3D images of a laser scanner
was presented by Cai et al. (2013). They defined the
spectrum of a 2D Fourier transform as a leaf wilting
index (LWI2DFT). In fact they assumed a leaf as a
mathematical surface in 3D space, and therefore a wilting
process refers to a series of the curved surfaces. Their
acquired correlation coefficients confirmed the capability
of their discussed method for sensing the stress response
from trivial wilting to drastic stress levels.
Feature selection is one of challenging step in using
MV for every application. Hendrawan and Murase (2011)
proposed four nature-inspired feature selection techniques,
including Neural-Simulated Annealing (N-SA),
Neural-Intelligent Water Drops (N-IWD),
Neural-Discrete Particle Swarm Optimization (N-DPSO)
and Neural-Genetic Algorithms (N-GAs), to find the best
set of Textural Features (TFs) which is suitable for
prediction the water content of cultured Sunagoke moss.
Based on their results, models using FS are remarkably
better than models using individual feature-subsets or
without FS. For this case Neural-Intelligent Water Drops
(N-IWD) had the best prediction performance among
others for selecting features from 120 features extracted
from grey, HSL, HSV, RGB and L*a*b*color spaces
The third major division of the electromagnetic
spectrum (1500-3000 nm) is referred to as the
middle-infrared. In this portion of the electromagnetic
spectrum does moisture play a dominant role. Although
other factors such as OM, iron content, and clay content
have an effect, it sounds that moisture is the primary
mechanism affecting reflectance. More specifically, the
higher the moisture content is, the lower the reflectance is.
As objects loose moisture or begin to dry, their
reflectance in this portion of the electromagnetic
spectrum increases. This information provide background
for application of MIR for water estimation.
3.4.2 Canals
From other applications of MV in irrigation are
determination of irrigation canals leakage and discharge.
Excess seepage in a canal segment, point leaks from
breaks or fissures in the canals or pipelines, and
evaporation are from the causes of water loss which is a
worldwide issue in irrigation canals. Fipps (2000)
reported a 4.55×10⁸ m3 loss for a region in Cameron
County, which is 30% of the total water supply in this
region. This value must be higher in many countries with
older irrigation distribution systems. As traditional
methods for these leakage detections are cost- and
time-consuming, exploring new methods for solving this
problem are justified and even crucial. For this purpose,
Huang et al. (2009) used multispectral images taken with
red, near infrared and thermal sensors at low altitude.
Their prediction of likely sites to have leaks was
successful in 92% of cases.
The possibility of error in the traditional equipment
for measurement of canal discharge is high, and some
efforts have been done to use imagery to present new
methods for flow measurement especially in a laboratory
environment (Gallanzi, 1998; Wereley and Gui, 2003).In
a research by Lee et al. (2010) in field condition, floating
bubbles on the water surface and a cross-correlation
analysis between two continuous images were used to
determine the surface velocities in the irrigation canal. In
the case of infiltration that the formation of seals on soil
surfaces restricts it, seal formation is strongly affected by
the drop size from spray nozzles; it means drop size is
somehow effective on the amount of runoff and erosion;
in addition droplet size analysis can be important for
estimating spray deposition efficiency under ambient
conditions (Sayınci et al., 2012). Despite the importance
of this case, few studies have focused on the relationship
between nozzle size, operating pressure and the drop size
distribution, which is probably due to non accessibility of
an accurate technique to specify the drop size. However
there existed some limitations for adaptation, Sudheera
and Panda (2000) revealed that image processing
technique can be successfully implemented for drop size
measurement accurately.
González-Dugo et al. (2013) used high spatial
resolution satellite images to map evapotranspiration (ET)
on large spatial scales for water management purposes at
different decision levels. Such information can be useful
to overcome problems due to the large scale of basin
applications and the heterogeneity and small size of the
irrigated fields.
3.5 Fertilizer
Fertilizing poor soil is more critical than rich soil.
Generally, the amount of nutrient in sandy soil is less
than clay. In addition, sandy soil capacity for suction and
preservation elements is low. As such soil is flooded
more, spreading a high amount of fertilizer at the same
time to these kinds of soil is not advisable (Khajeh, 2002).
So MV techniques are useful for discrimination of
dominant soil structure. This discrimination is effective
for fertilizer management.
The amount of soil nutrient depends on planting
history and performed operations on it. A high amount of
ferro, aluminum and calcium and active magnesium in
soil make condition in which phosphorus is quickly fixed
and become unavailable for plant. There exist a few
conditions for consuming phosphorus fertilizer (Khajeh,
2002).
Spreading fertilizers is economic when the increase in
and its spreading together (Khajeh, 2002). The site
specific application of fertilizer can result in significant
increase in the ratio of performance to fertilizing cost.
Moreover, excessive application of fertilizer has got a
major role in the increasing environmental imbalance
observed over the past 20 years (Hijazi et al., 2010).As
mentioned in soil-related sections, the existence of some
elements such as ferro in soil creates some color features
in soil. Such colors are detectable by MV systems.
Studying the spatial distribution of broadcasting spreaders
is necessary not only to limit excess fertilizer loss into the
environment but also to assure of a uniform distribution
and covering of fertilizer in proposed sites of the field. In
a work of 1991, Pettersen et al. studied the effect of
fertilizer particle size on a stationary twin-disc spreader
by using image processing technique. They found that
particle size affect the spatial distribution in broadcasting
spreaders. Their results represented that the relative
contribution of the smaller particles intensifies close to
and on both sides of the spatial distribution of spreader;
so larger particles contribute less in this area of the spatial
distribution and more in the central and outer region of
the distribution which is probably because of the
overlapping effect of the two discs in the spatial
distribution and large particles tendency for leaving the
rotating disc earlier (Pettersen et al., 1991).Hijazi et al.
(2010) developed a multi-phase cross-correlation method
for motion estimation of fertilizer granules during
centrifugal spreading by using a stroboscope with
power-LEDs to provide consistent illumination. The
application of cross-correlation in signal processing is to
measure the resemblance of two waveforms. Pattern
recognition, single particle analysis, and PIV (Particle
Image Velocimetry) are from cross-correlation
applications in image processing. Its methodology
consists of the correlation between the same blocks in
successive images. The difference between luminosities
of the blocks is expressed as the resemblance between
blocks (Fournel et al., 2003 andHijazi et al., 2010).
The distribution pattern of centrifugal spreaders relies
on many parameters. In order to avoid on-spinner
dynamic models and their difficulties, measurement
methods, focusing on the initial conditions of the ballistic
flight of the fertilizer particles, have been developed. The
outlet velocity vector of the particles in three dimensions
depends on the horizontal outlet angle, the disc
configuration and the rotational speed; Villette et al.
(2008) used a digital imaging system to measure the
horizontal outlet angle and therefore determine velocity
components. In a work of 2010 based on the
measurement of the outlet angle of the particles, Villette
et al. calibrated the same imaging system to estimate
factors affecting centrifugal fertilizer spreading other than
outlet velocity vector, including friction coefficient of the
fertilizer against the vane and fertilizer moisture which
affect the particle acceleration on the spinning disc.
Garcia-Ramos et al. (2012) analyzed the utility of 3-D
laser scanner images to evaluate the quality of centrifugal
fertilizer spreaders by obtaining the curve of the
distribution for any forward speed, determining the
surface distribution of the product, determining the
maximum spreading distance, visualizing the trajectory
followed by the fertilizer, and quantifying the symmetry
of the fertilizer spread on both sides of the spreader.
Nitrogen is one of the main structural components of
chlorophyll and thus is highly correlated with the
greenness of leaves. High amount of nitrogen in plants is
harmful for their consumers and nitrogen entry into
underground water will contaminate it; so developing
automatic methods to detect its amount according to the
plants demands and therefore variable rate application of
it seem perfectly reasonable nowadays. Based on the
effect of nitrogen on greenness of leaves, many
researchers have focused on variable rate application of
nitrogen by using MV technique. There are some papers
which discuss different greenness indices based on RGB
channels to extract an estimation of chlorophyll content in
leaves (Kawashima and Nakatani, 1998 and Pagola et al.,