Behavior of Filled and Encased Composite Column
Using 3D Numerical Modelling ANSYS
Syahril Taufik1,*, Gunaedy Utomo2, Agus Sugianto2
1Civil Engineering Department, Lambung Mangkurat University, Banjarmasin, Indonesia 2Civil Engineering Department, Balikpapan University, Balikpapan, Indonesia
Abstract
This paper addresses the behavior of concrete-filled steel tubes and concrete-encased steel. The composite structure under study was simulated with a tridimensional numerical model using the ANSYS software, which is based on the finite element method (FEM). Two reference models were validated with previously obtained experimental results and were used as references for the parametric study. The parameters considered in the study included the concrete grade, steel size and steel grade. Axially static load has been applied to the models with coupling technique. Plotting of load-displacement has been obtained to study the column behavior in terms of stress concentration and ductility. Analysis of the results led to the conclusion that changing a single parameter did not increase the column capacity because the failure was transferred to other structural elements in the composite section. Instead, the concrete grade and steel dimensioning procedure should consider the entire set of parameters to guarantee the structure's strength. The final results obtained from the study of composite column are enhancement or reduction capacity of column that has a significant influence on the strength of the column due to changes in the material properties. Type of composite column is highlighted to consider for effectively chosen as building structure. Finally, the composite column behavior is discussed in detail, and recommendations for the design are presented.Keywords
Composite column, Filled composite, Encased composite, Numerical modeling, ANSYS1. Introduction
Three dimensional FE models of steel column structures have been well verified with previous experimental results. More recent studies using FE modeling have focused mostly on encased column structures. Debski (2013), Li et al. (2010), Taufik et al. (2007) and de Sousa et al. (2005), have been considered numerical analysis on the composite structures. Finite element modellings of composite column have been studied by Xu et al. (2016), Kołakowski (2013) and Kima (2013). Taufik et al (2007) have studied the behaviour of bolted connection with hollow section using 3D numerical modelling software ANSYS with solid element model.
A lot of works have been done to analyze the behaviour of composite column experimentally. Two reference models were validated with previously obtained experimental results and were used as references for the parametric study (Ghannam, 2004 and Kim, 2005).
This study has been done to analyze the behaviour of encased composite column (ECC) and filled composite column (FCC) using ANSYS. The parameters considered in the study included the concrete grade, steel size and steel
* Corresponding author:
[email protected] (Syahril Taufik)
Published online at http://journal.sapub.org/cmaterials
Copyright © 2018 Scientific & Academic Publishing. All Rights Reserved
grade subjected to axially static load. A comparative analysis of collapse pattern and the strength effectiveness of each type of composite columns is based on behavior against various parameter change.
The analysis results obtained from the study of composite column are enhancement or reduction capacity of column that has a significant influence on the strength of the column.
2. Composite Column Configuration
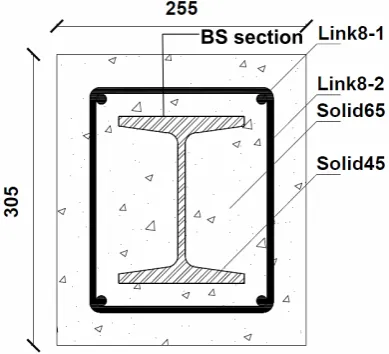
Most of the research conducted to know the behavior of the composite tubular hollow column (concrete-filled tubular section). In terms of architectural, columns composite hollow pipe (concrete-filled tubular section) has some interesting advantages in terms of visual namely concrete as filler material does not cause the visual effects of the concrete surface itself. In general, the behavior of filled and encased composite column is based on the basic principle is the same. However, both types of composite column have quite a difference especially with respect to detail with either rectangular hollow section (RHS) or beam section (BS). AISC regulations gave the treatment of each type of composite columns differently (Segui, 2007).
be different than planned. The tendency usually is to decrease the quality of the material. The decline in the quality of materials certainly influenced the nominal compressive strength of composite columns. Changes in nominal compressive strength of a composite column due to a decrease or increase in the quality of material will produce a comparison between the value of the capacity of cross-section with material properties. The amount of such comparisons can later be used as a reference in determining the effectiveness and efficiency of composite columns based on material properties.
In this study assumed the behavior of both types of composite columns is different for each type. There are some parameters that are changed in each type of composite column so that it can be seen behavior includes the relationships load-displacement (P-δ), stress-strain (σ-ε), stress concentration and cracking of the concrete before and after the change of parameters. This study has been conducted using the finite element method analysis using FEM computational program ANSYS version 11.0 whilst the geometry in the non-linear finite element modelling is illustrated in Figure 1 and 2.
Figure 1. Filled composite column model
Figure 2. Encased composite column model
Parametric study of composite column is based on Tables 1 and 2 for different section properties.
Table 1. Section properties of developed ECC models
Model h (mm) b (mm) fc’ (mm) tp (mm) H (m)
ECC.00 200 100 33.4 5.0 2.0
ECC.01 200 100 33.4 5.0 4.0
ECC.02 200 100 25.0 5.0 4.0
ECC.03 200 100 27.5 5.0 4.0
ECC.04 200 100 33.4 7.0 4.0
ECC.05 200 100 33.4 9.0 4.0
h = height; b = width; tp = wall thickness;
fc’ = concrete comporessive strength; H = column length
Table 2. Section properties of developed FCC models
Model b x d fc’ (mm) ds (mm) fys (mm) H (m)
FCC.00 305x355 23.72 40.0 276 2,13
FCC.01 305x355 23.72 40.0 276 4,00
FCC.02 305x355 27.50 40.0 276 4,00
FCC.03 305x355 30.00 40.0 276 4,00
FCC.04 305x355 23.72 30.0 276 4,00
FCC.05 305x355 23.72 50.0 276 4,00
FCC.06 305x355 23.72 40.0 300 4,00
FCC.07 305x355 23.72 40.0 330 4,00
b = width; d = depth; ds = stirrup widht fys = RHS steel yield strength; H = column length
BS 203x152x11x7; fyr = 240 MPa; Dr = 12 mm; φs = 10 mm fyr = BS yield strength; Dr = bar diamater; φs = strirrupdiamater
3. Numerical Modelling
The ANSYS version 11.0 which is a general purpose finite element package is selected to carry out numerical modelling analysis (ANSYS Inc, 1999). Non-linearcomposite column model is symmetric about the centre of the section and no lateral displacement is assumed, so only one side of the plane of symmetry is modelled. The geometry of the model now represents one half of the full-scale column in the terms of area and moment of inertia, so the capacity of the connection model is only a half of the actual load capacity. The following ANSYS element types are used for only one half of an entire composite column. Plastic 3D solid elements, SOLID45, are used to model RHS and BS steel section. Concrete is modelled by 3D non-metal plasticity element, i.e. SOLID65. Steel reinforcement is modelled using 3D spar element of LINK8 elements. Pressure load was applied to simulate concentric axial compressive loading at the top of the composite column with coupling technique on applied displacement control as depicted in Figure 3 and 4.
According to steel structure design calculation of Indonesia construction code (SNI-1729-2015), obtained the maximum load capacity (∅𝑐𝑁𝑛) of composite columns
according to the following equations (ISSC, 2015):
BS section
RHS section
Figure 3. Meshed elements of FCC model
Figure 4. Meshed elements of ECC model
∅𝑐𝑁𝑛 = 0.85 * As* fmy / ω (1)
ω = 1.43
1.6−0.67�𝑟𝑚.𝜋𝐾.𝐿�𝑓𝑚𝑦𝐸𝑚� (2)
where: As is steel section area (mm2); fmy is yield stress of
composite (MPa); ωis buckling factor; K is effective length factor; L is column length (mm); rm is composite radius of gyration; and Em is equivalent modulus of elasticity (MPa).
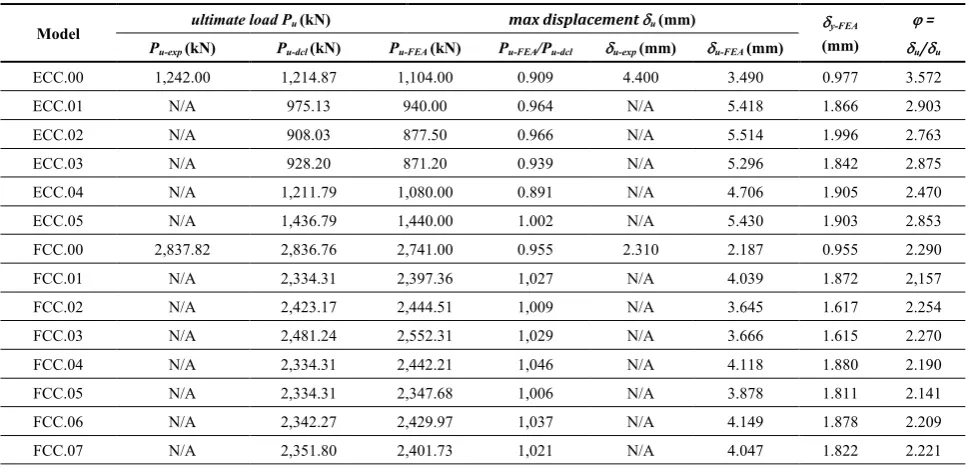
Table 3. Comparative results of ultimate load and curvature ductility
Model ultimate load Pu (kN) max displacement δu (mm) δy-FEA
(mm)
ϕ = Pu-exp (kN) Pu-dcl (kN) Pu-FEA (kN) Pu-FEA/Pu-dcl δu-exp (mm) δu-FEA (mm) δu/δu
ECC.00 1,242.00 1,214.87 1,104.00 0.909 4.400 3.490 0.977 3.572
ECC.01 N/A 975.13 940.00 0.964 N/A 5.418 1.866 2.903
ECC.02 N/A 908.03 877.50 0.966 N/A 5.514 1.996 2.763
ECC.03 N/A 928.20 871.20 0.939 N/A 5.296 1.842 2.875
ECC.04 N/A 1,211.79 1,080.00 0.891 N/A 4.706 1.905 2.470
ECC.05 N/A 1,436.79 1,440.00 1.002 N/A 5.430 1.903 2.853
FCC.00 2,837.82 2,836.76 2,741.00 0.955 2.310 2.187 0.955 2.290
FCC.01 N/A 2,334.31 2,397.36 1,027 N/A 4.039 1.872 2,157
FCC.02 N/A 2,423.17 2,444.51 1,009 N/A 3.645 1.617 2.254
FCC.03 N/A 2,481.24 2,552.31 1,029 N/A 3.666 1.615 2.270
FCC.04 N/A 2,334.31 2,442.21 1,046 N/A 4.118 1.880 2.190
FCC.05 N/A 2,334.31 2,347.68 1,006 N/A 3.878 1.811 2.141
FCC.06 N/A 2,342.27 2,429.97 1,037 N/A 4.149 1.878 2.209
FCC.07 N/A 2,351.80 2,401.73 1,021 N/A 4.047 1.822 2.221
Pu = ultimate load; δu = ultimate displacement; δy = yield displacement; ϕ = curvature ductility; 0.891 ≤ β = Pu-FEA/Pu-dcl ≤ 1.046 displacement
control degree of freedom
(DOF) couple
meshed 50 mm
Restraint
displacement
control degree of freedom (DOF) couple
Restraint meshed
The first model of composite column is validated against experimental result. Numerical modelling with finite element analysis (FEA) and design calculation results of composite column models with ultimate load, displacement and curvature ductility are shown in Table 3 (Pu against δu
and ϕ). Plotting graph of load-displacement is shown in Figures 5 and 6.
4. Discussion of Results
From Table 3, it can be observed in both types of models of composite columns, increased height is also likely to decrease the curvature ductility. On models filled composite column, ductility decrease the curvature of the reference models FCC.01 variation occurs in the quality of concrete that is precisely on the model FCC.02 and FCC.03. Changes occur concrete strength of 25.0 MPa and 27.5 MPa to 33.4 MPa from the original one. Decrease in ductility curvature significantly that tends to occur at the flange thickness variation of the steel profile on the model FCC.04 and FCC.05 changes on the flange thickness of 7 mm and 9 mm from the original 5 mm (see Figure 5).
In the model, as shown in Figure 6, encased composite column, curvature ductility increase tends to occur due to changes in the quality of the concrete on ECC.01 and ECC.02 models with reference models ECC.00. Concrete quality changed at 27.5 MPa and 30.0 MPa from the original of 23.72 MPa.
While the variety and quality of concrete cover thickness reinforcement extends only slightly increased curvature ductility.
Figure 5. Load-displacement of FCC
Figure 6. Load-displacement of ECC
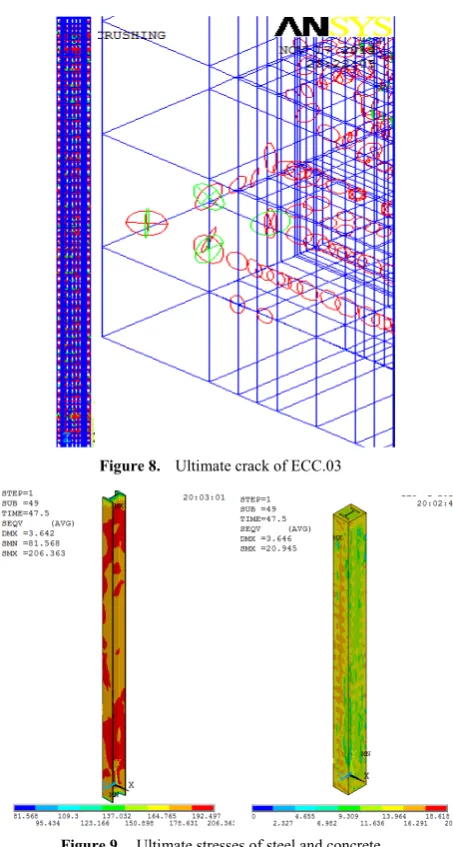
Crack patterns of composite column model based on finite element analysis using ANSYS in the ultimate crack condition are shown in Figures 7 and 8. Collapsed mechanism of encased composite column is dominated by crushing localized in the concrete edge, while the uniformed cracking is distributed along the filled concrete.
Figure 7. Ultimate crack of FCC.05
Implementation model to change the strength of concrete experiencing stress contours almost the same as the previous model ECC.01. The maximum stress on the steel profile tends to occur at the top and bottom web. While in the concrete tends to occur on the parts around the flange of a steel profile. The maximum stresses of ECC.03 are reached at 206.363 MPa of steel and 20.945 MPa of concrete. Stress contour of ECC.03 model can be seen in Figure 9.
0 200 400 600 800 1000 1200 1400 1600
0.0 0.5 1.0 1.5 2.0 2.5 3.0 3.5 4.0 4.5 5.0 5.5 6.0
Loa
d (kN
)
displacement (mm)
FCC.00 FCC.01
FCC.02 FCC.03
FCC.04 FCC.05
0.0 500.0 1000.0 1500.0 2000.0 2500.0 3000.0
0.0 0.5 1.0 1.5 2.0 2.5 3.0 3.5 4.0 4.5
Loa
d (
kN
)
displacement (mm)
ECC.00 ECC.01
EEC.02 ECC.03
ECC.04 EEC.05
Figure 8. Ultimate crack of ECC.03
Figure 9. Ultimate stresses of steel and concrete
Overall results of the study of composite columns using FEA can generally be described as follows:
1. In the filled composite column height changes into a double column resulted in a decrease of ultimate load of almost 15% from the previous ultimate load. 2. To increase the ultimate load of the most significant
changes is the flange thickness of hollow section. Extra thick flange resulted in an increased area of steel profiles which are crucial in cross-section capacity calculation.
3. The addition of thick flange steel profiles of 2 mm to 4 mm can increase the ultimate load of composite columns by 14% to 16%.
4. Increasing concrete quality by 2.5 MPa to 8.5 MPa can only increase the ultimate load of 7% to 9%.
5. On the composite encased column, change nearly twice as high as column can lower the ultimate load by nearly 12% of the previous one.
6. Additional strength of concrete at 1.5 MPa to 4.0 MPa can increase the ultimate load by 6% to 11%.
7. Changes in the thickness of concrete cover does not affect the ultimate load of composite columns.
8. Improving the quality of longitudinal reinforcement in composite columns by 24 MPa to 54 MPa of the ultimate stress does not increase significantly. Improvement occurring at less than 2% of the previous ultimate load.
5. Conclusions
The behavior that occurs on or filled composite column encased composite column shows the maximum von Mises stress concentration and the first crack tends to occur at the adhesive area between the concrete and steel profiles. Variation in the form of material properties and section properties of composite columns tend not affect general behavior but is proportional to the increase in material properties and section properties of composite columns. In the filled composite column changes the most efficient in increasing the nominal compressive strength is on the wall thickness of 9 mm steel profile. While the composite encased column changes the most efficient on the concrete grade of 30 MPa. The ultimate load of composite columns obtained from design calculation of Indonesia steel structure code is reasonable compare with the FEA model. Design calculation of Filled Composite Column with wall thickness of Rectangular Hollow Section less than 9 mm seems too conservative. The final results obtained from the study of composite column are enhancement or reduction capacity of column that has a significant influence on the strength of the column due to changes in the material properties. The compressive deformation subjected to axial load tends to be non-linear material behavior relationship.
ACKNOWLEDGMENTS
The financial support of the Research Grants of Lambung Mangkurat University Indonesia for authors’ research is greatefully appreciated.
REFERENCES
[1] de Sousa, J., Jr. and Caldas, R. (2005). Numerical Analysis of Composite Steel-Concrete Columns of Arbitrary Cross Section. Journal Structural Eng., 10.1061/(ASCE) 0733-9445 (2005) 131:11(1721), 1721-1730.
[2] Ghannam, Shehdeh, Hamid R. Al-Ani dan Orabi Al-Rawi (2010). Comparative Study of Load Carrying Capacity of Steel Tube Columns Filled with Lightweight Concrete and Normal Concrete, Jordan Journal of Civil Engineering. [3] Indonesia Standard Code Committe - ISCC (2015). Indonesia
[4] Hubert Debski (2013). Numerical Analysis of Stability of Thin Walled Composite Column with Open Cross Section, Mechanics and Mechanical Engineering, Vol. 17, No. 1 (2013) 29–35.
[5] Kim, Dong Keon (2005). A Database for Composite Columns, Thesis, Georgia Institute of Technology.
[6] Li Liang, Xin Li, Yu Chen (2010). Numerical Simulation on the Mechanical Behavior of AngleSteel-Encased Composite Column Filled with Steel Tube-Reinforced Concrete. IOP Conf. Series: Materials Science and Engineering 10, 012162, doi:10.1088/1757-899X/10/1/012162.
[7] Sun-Hee Kima, Kyong-Soo Yomb, Sung-Mo Choia (2015). Prediction of Residual Strength of Composite Columns Using FEM Analysis, International Conference in Applications of Structural Fire Engineering, 15-16 October 2015, Dubrovnik, Croatia.
[8] ANSYS Inc (1999). ANSYS Theory Reference release 5.6, Eleventh Edition, Canonsburg, PA 15317, USA.
[9] Segui, W.T. (2013). Steel Design, 5th Edition, Chengage Learning, Stanford, USA.
[10] Taufik, Syahril and Xiao, R.Y. (2007). 3D Finite Element Modelling of End Plate Connection with Hollow Section Beam, Sixth International Conference in Aluminium and Steel Structures (ICASS 07), Oxford, July 2007.
[11] Taufik, Syahril and Xiao, R.Y. (2007). Numerical Modelling of Semi-continuous Composite Connection with High Strength Steel", Eleventh International Conference on Civil, Structural and Environmental Engineering Computing, Civil Comp Press, St Julians Malta on September 18-21, 2007. [12] Yafeng Xu, Xu Yang, Xin Wang and Souyan Ba (2016).
Finite Element Analysis on Circular Steel Tube Composite Column Filled with Steel Reinforcement Concrete, Advanced Mechanics and Material, Vols. 166-169 pp 318-321, Trans Tech Publications.