Asian Journal of Pharmaceutical Education and Research
Vol -5, Issue-1, January-March 2016
SJIF Impact Factor 3.203ISSN: 2278-7496
AJPER Januray – March 2016, Vol 5, Issue 1 (60-73)
RESEARCH ARTICLE
Formulation and in-vitro Evaluation of Mefanemic acid Solid Dispersion
Vipul Jain*, Sukhwant Singh, Jitendra Banveer
Sagar Institute of Research Technology and Pharmacy, Bhopal, M.P
ABSTRACT:
The objective of the research work to enhance the solubility of mefanemic acid by formulating solid dispersion with hydrophilic polymers such as poly ethylene glycol (PEG 4000) and ethyl cellulose as carrier and solid dispersions were prepared by the method of conventional and physical mixture technique. Further formulated as tablet and capsular dosage forms and were evaluated for drug content, In-vitro dissolution studies and differential scanning calorimetry. Results showed that formulations F1-F5 varied from 58.41-96.91% of drug content, release 20-70% of drug in 60 minutes and follows Hixson crowell dissolution release kinetics. DSC Studies shows that there is no evidence of interaction between drug-excipient and as the solid dispersion exhibited no endothermic peak. During the stability study it was found that at low temperature the capsule shell breakdown and does not able to maintain its physical integrity and at high temperature and RH conditions therefore storage preferably below 300C will make stable formulations.
Keywords: Solubility enhancement, poly ethylene glycol, solid dispersions, differential scanning calorimetry, Hixsoncrowell.
INTRODUCTION:
A drug may be defined “as ‘poorly soluble’ when its dissolution rate is so slow that
dissolution takes longer than the transit time past its absorptive sites, resulting in incomplete
bioavailability”. Approximately 40% of all newly discovered drugs display limited solubility
in water and therefore poor and often greatly variable oral bioavailability. Drugs can also be
classed as poorly soluble if they exhibit solubility in water below 100μg/ml.1 Among these Article Received on
12 Dec. 2015
Revised on 25 Dec. 2015
Accepted on 28 Dec. 2015
*Correspondence for Author
Mr. Vipul Jain*
Sagar Institute of Research
Technology and Pharmacy,
Bhopal (M.P.)
AJPER Januray – March 2016, Vol 5, Issue 1 (60-73)
methods, preparation of solid dispersionhas become one of the most active areas of research
in the pharmaceutical field to improve the bioavailability of poorly water-soluble drugs. This
method involved the formation of eutectic mixtures of drugs with water-soluble carriers by
melting of their physical mixture, which resulted in solubility enhancement.2
The solid dispersion can be defined as a dispersion of one or more active ingredients in an
inert carrier or matrix in the solid state prepared by the melt, solvent or solvent-melt method.
The definition has now been extended to include certain nanoparticles, microspheres,
microcapsules and other dispersions of drugs in polymers.3
Mefenemic acid is marketed in the form of conventional tablet and capsule only; but both
oral solid dosage form has limited solubility and dissolution profile i.e. approx 25%; to
overcome this problem manufacturer incorporate high amount of disintegrant (10-80%)
which was hazardous to patient and also inflate overall cost of product. Another limitation
of the existed dosage form is that they are very porous and thus not very hard as a
consequence they cannot be broken in two or more pieces, this porous tablets tends to be
very sensitive to humidity therefore they cannot be stored for some day’s once the blister is
opened.4 The poor stability and low oral bioavailability with poor aqueous solubility
warrants the administration of large dosage of mefenemic acid to maintain desired
therapeutic concentration in blood.5-7
The main aim of the present study is to prepare an improved oral mefenemic acid
formulation for once a daily dose i.e. ‘solid dispersion’ that delivers the drug in both
solublize form and in a predictable manner which is independent of pH in gastro intestinal
tract. By preparing its solid dispersion we can reduce the amount of disintegrant in
formulation in contrast to present dosage form. Thus it reduces overall cost of the product
and prevent the patient form exposure of such a high concentration of disintegrant. By
preparing its solid dispersion we can improve its flow property and it can be either
compressed in tablet form or it can be suitably dispensed in capsule.
MATERIAL AND METHOD: Material:
AJPER Januray – March 2016, Vol 5, Issue 1 (60-73) Method:
Preparation of solid dispersions:
In order to optimize the drug is to polymer ratio, we have prepared the matrices by both i.e.
physical mixture method and solid dispersion method.
Physical mixture method: All the ingredients were weighed accurately and passed
through sieve no. 85 in order to obtain powder of fine particle size with narrow size
distribution. The physical mixture of drug with carrier Ethylcellose (EC) was
prepared in different concentration by slightly grinding the drug and carrier in mortar for 2
min. The drug: EC ratio which was taken as 1:1, 1:2, and 1:3 respectively. Then the resultant
powder was passed through sieve no 60 and was stored in desiccator for 2-6 hrs to
carry out further analysis. The prepared physical mixture was subjected to dissolution
study.8
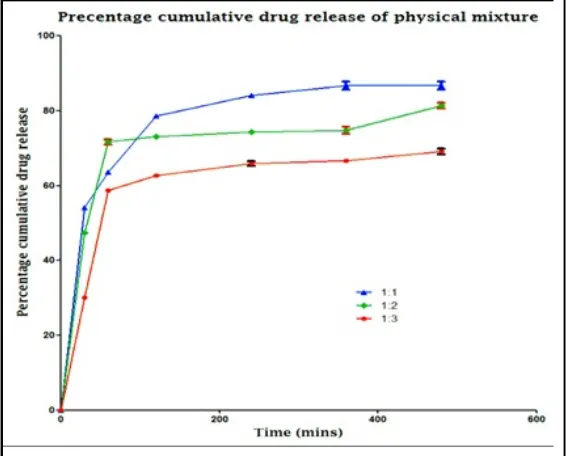
Table 1: Percentage cumulative drug release of physical mixture
S. No.
Time interval
(mins)
Percentage cumulative drug release of physical mixture *
1:1 1:2 1:3
1) 0 0 0 0
2) 30 54.15 ± 0.11 47.46 ± 0.28 30.12 ± 0.18
3) 60 63.64 ± 0.19 71.64 ± 0.74 58.67 ± 0.33
4) 120 78.56 ± 0.34 73.12 ± 0.19 62.72 ± 0.45
5) 240 84.14 ± 0.42 74.34 ± 0.45 65.87 ± 0.61
6) 360 86.66 ± 1.08 74.76 ± 0.89 66.62 ± 0.59
AJPER Januray – March 2016, Vol 5, Issue 1 (60-73) Fig. 1: Percentage cumulative drug release of physical mixture
On the basis of percentage cumulative drug release study it was concluded that solid
dispersion is better option in spite of physical mixture. The study revealed that physical
mixture shows a sudden bursting effect and erratic pattern in their release mechanism
therefore the solid dispersion was best alternate. In solid dispersion it was found that in 1:1
and 1:2 ratio there was also a bursting effect and at higher polymer ratio i.e. at 1:3 the
drug release was truly delayed which can further optimized to get better results.
Therefore 1:3 ratios were found to be superior and were used for further evaluation purpose.
Preparation of solid dispersion of mefanamic acid
For the preparation of a mefanamic acid -PEG 4000 solid dispersion by conventional
method, PEG 4000 was weighed and melted at 58 °C (± 1 °C) and a measured amount of
mefanamic acid was added and stirred. After solidification at room temperature, sample was
pulverized with use of a pestle and mortar and sieved through a 400-mm mesh. 60 mg of
MEF-PEG 4000 powder (containing 15 mg of mefanamic acid and 45 mg of PEG 4000) was
filled into a hard gelatin capsule (size no 2) for further investigations.
Preparation of physical mixture
For the preparation of a MEF-PEG 4000 physical mixture, MEF and PEG 4000 were
weighed and mixed for 5 min with use of a pestle and mortar and sieved through a 400- mm
mesh. 60 mg of MEF - PEG 4000 powder mixture (containing 15 mg of MEF and 45 mg of
AJPER Januray – March 2016, Vol 5, Issue 1 (60-73) Tablet-making
MEF - PEG 4000 tablets were prepared with a Korsch EKO eccentric tablet machine (Emil
Korsch Maschinenfabrik, Berlin, Germany). The compression tools were single, flat punches
10 mm in diameter, furnished with strain gauges. The physical mixture of MEF - PEG 4000
was compressed at a pressure of 10 ± 1 kN at an air temperature of 24 °C and an air relative
humidity of 45%. The crushing strength of the tablets was investigated with a Heberlein
apparatus (Flisa, Le Locle, Switzerland). The geometrical parameters were measured with a
screw micrometer (Mitutoyo, Japan). The weight of the tablets was calibrated to 60 mg. Each
tablet contained 15 mg of MEF and 45 mg of PEG 4000.
Evaluation:
Percentage drug content:
For the determination of MEF content, dispersion granules equivalent to 120 mg of MEF,
were weighed and extracted with 10 ml of methanol by mechanical mixing for 5
min followed by centrifugation at 10,000 rpm for 5 min on a centrifuge. The supernant
was filtered through 0.45µ membrane filter, and the filtered solutions were suitably diluted
and analyzed for MEF at 245 nm using a validated UV spectrophotometric method.9
In vitro dissolution studies
Samples of conventional, direct capsule filling and dropping method containing Mefanamic
acid were prepared for dissolution studies. Samples were filled into hard gelatin
capsules (size no. 2). Each capsule contained 15 mg of Mefanamic acid and 45 mg of PEG
4000. Dissolution tests were performed with a Pharmatest (Hainburg, Germany) dissolution
tester, set with a paddle speed of 100 rpm. Artificial enteric juice (900 ml) with a pH of 7.5
(± 0.1) at 37 °C (± 0.5 °C) was used. Samples were withdrawn at 5, 10, 30 20, 30 and 60
minutes, and were assayed spectrophotometrically at 280 nm (Helios a, Spectronic Unicam,
Cambridge, UK) after filtering. Dissolution studies for samples containing MEF were carried
out as follow: Samples of tablets, physical mixture, pure MEF and round particles were
prepared for dissolution studies. The physical mixture, round particles and pure MEF as
reference sample were filled into hard gelatin capsules (size no. 2). Each capsule contained
15 mg of MEF and 45 mg of PEG 4000. Dissolution tests were performed with a Pharmatest
(Hainburg, Germany) dissolution tester, set with a paddle speed of 100 rpm. Artificial enteric
AJPER Januray – March 2016, Vol 5, Issue 1 (60-73)
withdrawn at 5, 10, 20, 30, 60 and 90 min, and were assayed spectrophotometrically at 245
nm (Helios a, Spectronic Unicam, Cambridge, UK) after filtering.10,11
Differential scanning calorimetry (DSC)
Thermal analysis was carried out with a DSC instrument (Mettler-Toledo GmbH,
Switzerland). Sample was weighed into a non-hermetically sealed aluminum pan. The
samples were heated from 25 to 400 °C at a heating rate of 5 °C/min for Mefanamic acid. In
case of MEF the samples were heated from 25 to 300 °C at a heating rate of 5 °C/min and 30
°C/min. The instrument was calibrated by using indium.12
Result and discussion
:Percentage drug content
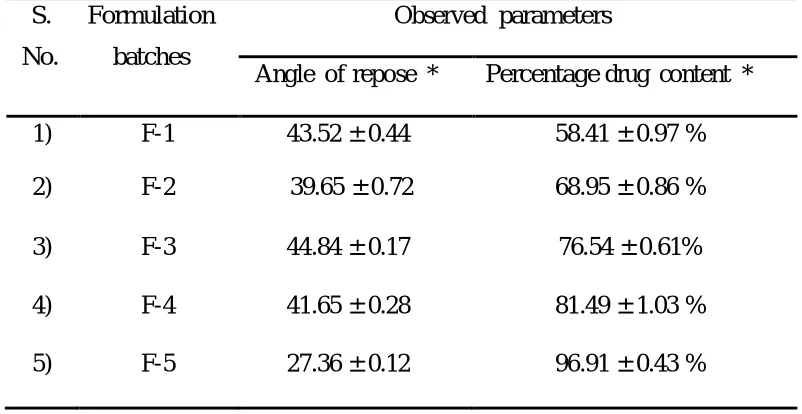
Table 2 : Result of five batches produced by central composite design
S.
No.
Formulation
batches
Observed parameters
Angle of repose * Percentage drug content *
1) F-1 43.52 ± 0.44 58.41 ± 0.97 %
2) F-2 39.65 ± 0.72 68.95 ± 0.86 %
3) F-3 44.84 ± 0.17 76.54 ± 0.61%
4) F-4 41.65 ± 0.28 81.49 ± 1.03 %
5) F-5 27.36 ± 0.12 96.91 ± 0.43 %
Drug content and % drug content was found to be within the limit which shows that the drug
was uniformly distributed throughout the product and it also indicate that both impeller speed
AJPER Januray – March 2016, Vol 5, Issue 1 (60-73) Fig. 2. In vitro dissolution studies
To further analyze the in-vitro release rate it was further evaluated for the specific
release mechanism with the help of ‘Kinetic- DS 0.3 rev. 2010 version software by
comparing their respective ‘regression coefficient’.
AJPER Januray – March 2016, Vol 5, Issue 1 (60-73)
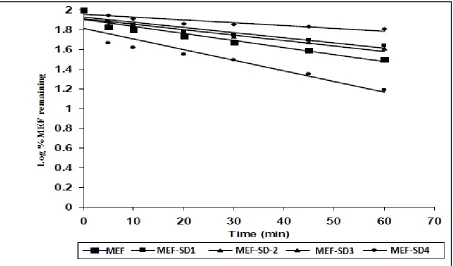
Fig.4: Hixsoncrowell dissolution plots of Mefenamic acid and its solid dispersions
In-vitro release shows that it follows delayed Hixson Crowell with lag period in release
drug kinetics with the regression coefficient value up to 0.9929 and able to maintain release
rate for a longer period of time (> 8 hrs).
Differential scanning calorimetry (DSC)
Thermal analysis was carried out with a DSC instrument (Mettler-Toledo GmbH,
Switzerland). Sample was weighed into a non-hermetically sealed aluminum pan. The
samples were heated from 25 to 400 °C at a heating rate of 5 °C/min for Mefanamic acid. In
case of MEF the samples were heated from 25 to 300 °C at a heating rate of 5 °C/min and 30
°C/min. The instrument was calibrated by using indium.
AJPER Januray – March 2016, Vol 5, Issue 1 (60-73)
On the basis of experimental design method it was concluded that in spite of physical mixture
the solid dispersion was superior in terms of dissolution profile; they are capable of
maintaining the drug release rate for a longer period of time. On the basis of same study it was
found that drug: carrier ratio 1:3 is most suitable for the formation of delayed release
solid dispersion.
In order to maintain the product quality, content uniformity, homogeneity and
desirable flow property of SD, MEF-SD4 formulation was selected for further formulation
and characterization purpose.
The optimized batch was subjected for micrometric tests which reveal that it was white
amorphous powder with irregular shaped crystals. The bulk density and tapped density was
found to be 0.656 ± 0.066 g/cm3and 0.969 ± 0.098 g/cm3 respectively. The H.R, % C.I, and
angle of repose suggest that it posses fair flow property with a significant cohesiveness which
can be improved with the help of proper addition of lubricant and glidants.
In-vitro release shows that it follows delayed Hixson crowell with lag period in release
drug kinetics with the regression coefficient value upto 0.9929 and able to maintain release rate
for a longer period of time (> 8 hrs).
DSC Studies shows that there is no evidence of interaction between drug-excipient and as the
solid dispersion exhibited no endothermic peak corresponding to the melting point of MEF
indicating that the drug is dispersed amorphously in ethyl cellulose matrix.13
CAPSULAR DOSAGE FORM
As both the solid dispersions were prepared and optimized, they cannot be administered as
such they have to be given in suitable dosage form. The propose dosage form for the
optimized granules was capsule.
Capsule can be simply defined as the ‘single unit oral dosage form’. It is one of the most
popular dosage forms. It is most suitable for the dispensing of the drugs which have
noxious and unpleasant odour and taste. The composition of proposed capsular dosage
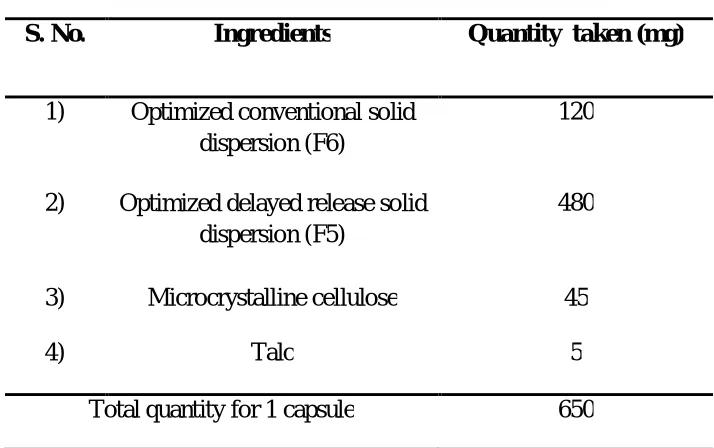
AJPER Januray – March 2016, Vol 5, Issue 1 (60-73) Table 3 : Proposed capsular dosage form
S. No. Ingredients Quantity taken (mg)
1) Optimized conventional solid dispersion (F6)
120
2) Optimized delayed release solid dispersion (F5)
480
3) Microcrystalline cellulose 45
4) Talc 5
Total quantity for 1 capsule 650
Characterization of Capsule Dosage Form:-
General physical characterization: The general physical characteristics which are taken with prime considerations are color, shape, surface texture etc. These
characteristics can be suitably determined in laboratory by visual inspection only. The
procedures which are used to determine the above parameter can be briefly summarized
as follows:- It is usually determined with the help of visual inspection. In this dosage
form is subjected to suitable bright illuminating source and colour, shape and surface
texture was observed, the value was given in the Table 4.
Weight variation: The process consists of weighing 20 intact capsules, determining the average weight / capsule and finding out weight variation of each capsule. Weight of each
capsule should fall within 90-110% of the average weight, thus a ± 10% weight
variation was permitted. As per IP not more than 2 capsules should differ by more than ±
25%. In routine procedure, the intact capsule was weighed and then opens the capsule
without losing any part of the shell and the content was removed. Then empty shell was
weighed, the actual weight of content was the difference of weight of intact capsule and
empty shell. The whole procedure was repeated for 19 capsules and its average weight
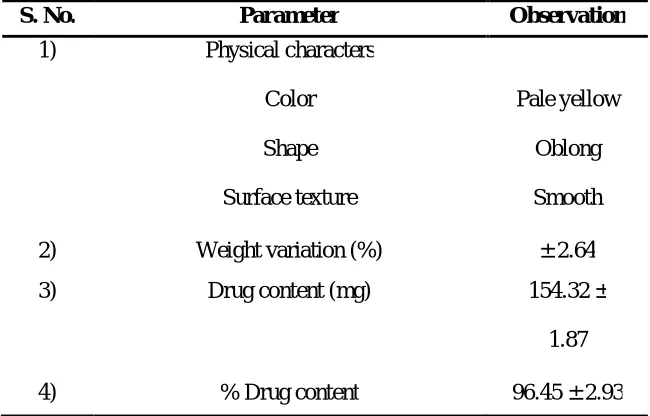
AJPER Januray – March 2016, Vol 5, Issue 1 (60-73) Table 4 : Showing observed characteristics of proposed capsule
S. No. Parameter Observation
1) Physical characters
Color
Shape
Surface texture
Pale yellow
Oblong
Smooth
2) Weight variation (%) ± 2.64
3) Drug content (mg) 154.32 ±
1.87
4) % Drug content 96.45 ± 2.93
Drug content and percentage drug content determination
This test was performed to ensure uniform distribution of medicament. The test was
performed by selecting a number of capsules and followed by an assay procedure as per
monograph. According to IP 20 capsules were taken; out of which 10 was assayed
individually. The average drug content and percentage drug content result of 10 capsules
was determined and it was reported in Table 8.2. The result of assay of 10 capsules was
found to fall within the limit of 85-115%, which shows that it complies with standard.
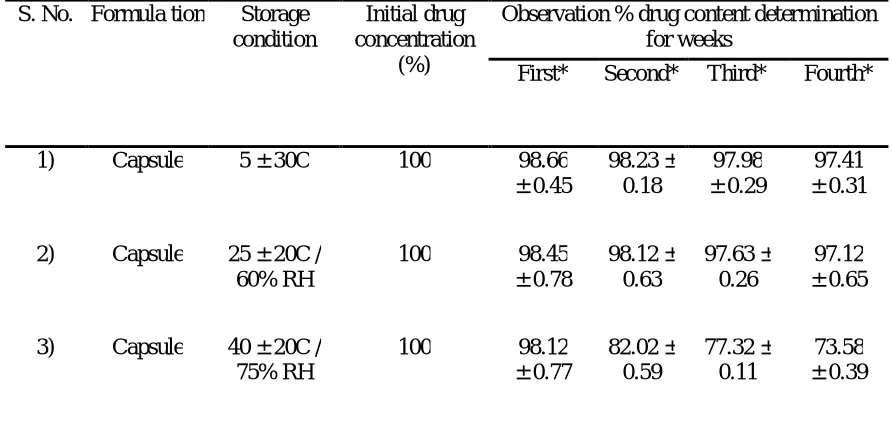
Stability study of capsule dosage form
In order to determine the stability of prepared capsules, it was subjected to stability
studies. In our stability study; all capsules was sealed in aluminium foils and then those
packs was subject to three different conditions i.e. 5 ± 30C; 25 ± 20C / 60 ± 5% RH; 40 ±
20C / 75 ± 5 % RH for 4 weeks. The stability study initially was determined with the
help of drug content determination weekly. The result was shown in Table 5 and
AJPER Januray – March 2016, Vol 5, Issue 1 (60-73) Table 5 : Stability study of capsule
S. No. Formula tion Storage condition
Initial drug concentration
(%)
Observation % drug content determination for weeks
First* Second* Third* Fourth*
1) Capsule 5 ± 30C 100 98.66
± 0.45 98.23 ± 0.18 97.98 ± 0.29 97.41 ± 0.31
2) Capsule 25 ± 20C / 60% RH
100 98.45
± 0.78 98.12 ± 0.63 97.63 ± 0.26 97.12 ± 0.65
3) Capsule 40 ± 20C / 75% RH
100 98.12
± 0.77 82.02 ± 0.59 77.32 ± 0.11 73.58 ± 0.39
* All values are mean ± Std. dev.; where n=3
Fig 6: Stability study of capsule
Conclusion:
The proposed capsular dosage form was evaluated for following test: On basis of physical
characterization it was concluded that the dosage form was up to the mark and can be
used to dispense the optimum dose of drug as it poses a smooth surface texture it was
AJPER Januray – March 2016, Vol 5, Issue 1 (60-73)
and stable dosage form. The weight variation was found to be ± 2.64% which shows that the
result was obtained within the specified limit as prescribed in I.P and it shows minimum
loss during filling procedure and minimum chances of leakage (or) hygroscopic character
of capsule. The result of assay of 10 capsules was found to fall within the limit of 85-115%,
which shows that it complies with standard. It shows that the dosage forms maintain its
homogeneity.
During the stability study it was found that at low temperature the capsule shell
breakdown and does not able to maintain its physical integrity and at high temperature
and RH conditions they are found to loss it plasticity and get melt down; therefore in
both the above stated cases there are possible chances of drug deterioration and leakage.
Therefore one should store the capsule at room temperature preferably below 300C.
Reference:
1. Abd A, El-Bary A, Geneidi A, Amin S, AEl-Ainan A. Preparation and
pharmacokinetic evaluation of carbamazepine controlled release solid dispersion
granules. J Drug Res Egypt. 1998;22:15–31.
2. Aungst B, Nguyen N, Rogers N, Rowe S, Hussain M, White S, Shum L.
Ampiphilic vehicles improve the oral bioavailability of a poorly soluble HIV
protease inhibitor at high doses. Int J Pharm.1977; 156: 79–88.
3. Rao M, Suneetha R, Reddy P, Ravi T. Preparation and evaluation of solid
dispersion of naproxen. Indian J Pharm Sci. 2005; 67 (1): 26-29.
4. Lipincott, Williams and Wilkins. Remingtonõs, 2006. The Science and Practice of
Pharmacy 21 edition, st pp: 538.
5. British Pharmacopoeia volume 1 and 2. 2009. Medicinal and Pharmaceutical
Substances Mefenamic Acid. Crown Copyright, pp: 3743-3744.
6. Murray MD, Haag KM, Black PK, Hall SD, Brater DC. Variable furosemide
absorption and poor predictability of response in elderly patient. Pharmacotherapy
1997; 17: 98 – 106.
7. Boles Ponto LL, Schoenwald RD. Furosemide: a pharmacokinetic, pharmacodynamic
AJPER Januray – March 2016, Vol 5, Issue 1 (60-73)
8. Chaudhary D, Kumar S. Enhancement of solubility and dissolution of glipizide by
solid dispersion (kneading) technique. Asian journal of pharmaceutics, 2009:
245-251.
9. Patel M, Patel D. Fast dissolving valdecoxib tablets containing solid dispersion
of valdecoxib. Indian J Pharm Sci.2006:222-226.
10.Serajuddin AT, J. Pharm, Sci, 88, 1999, 1058–1066.
11.Serajuddin ATM, Sheen PC and Augustine MA J. Pharm. Sci. 1990; 79: 463-464.
12.Makiko F, Hideko O, Yu suke S, Honami T, Masuo K, Yoshiteru W. Preparation,
characterization, and tableting of a solid dispersion of indomethacin with
crospovidone. Int. J. Pharm 2005; 293: 145–153.
13.Desai J, Alexander K, Riga A. Characterization of polymeric dispersion in ethyl