This is an open access journal, and articles are distributed under the terms of the Creative Commons Attribution-Non Commercial-ShareAlike 4.0 License, which allows others to remix, tweak, and build upon the work non-commercially, as long as appropriate credit is given and the new creations are licensed under the identical terms.
© 2019 Journal of Advanced Pharmacy Education & Research | Published by SPER Publication
62
Study of social and Epidemiological Indicators of tuberculosis
in the European region
Iuliia V. Korzh
1, Tatyana A. Romanko
1, Irina V. Zhirova
1*, Maryna V. Podgaina
2, Lubov V.
Tereschenko
1, Svetlana G. Kalaycheva
11 Department of Social pharmacy, National Pharmaceutical University, Kharkov, Ukraine. 2 Department of Organization and Economics of Pharmacy, Faculty of pharmacy,
National University of Pharmacy, Kharkov, Ukraine.
Correspondence:Irina V. Zhirova, Department of Social pharmacy, National University of Pharmacy, Kharkov, Ukraine, Valentinovskaya Street 4, Kharkiv, 61168. Email: irina.v.zhirova @ gmail.com.
ABSTRACT
The paper analyzes the social and epidemiological indicators of morbidity and mortality from tuberculosis (TB) in the countries of the European Region of the World Health Organization (WHO). It has been established that among European countries the highest morbidity and mortality rates are inherent in the countries of the Commonwealth of Independent States (CIS), 70.6 and 11.2 cases per 100,000 populations respectively. The growth rates of the reduction in morbidity and mortality rates are not intensive enough - 95.42% and 92.17%, respectively. The mortality rate relative to the highest incidence of -15.86%, also belongs to the group of CIS countries. The main factors affecting the high mortality rate of TB in the CIS countries have been highlighted in the article. A study of groups of countries of the CIS according to the WHO graduation indicates that the treatment success rate (mortality rate) does not depend on the incidence rate indicator. It has been established that the rate of decline in morbidity and mortality in the CIS countries does not correspond to the WHO concept of TB control.
Keywords:tuberculosis, epidemiology, morbidity, mortality, European Region, health technology assessment.
Introduction
It is a well-known fact that cardiovascular disease is the leading cause of death and inability in the world (more than 17 million deaths per year) [1-3]. At the same time, the WHO states that the
fight against the epidemic of socially dangerous diseases is recognized as one of the main priorities of public health and social policy. The spread of socially dangerous diseases among the population poses a threat to the national security of the country and is one of the main causes of disability, loss of health and mortality [4-7]. The problem of increasing rates of morbidity,
prevalence and mortality is a consequence of socio-economic processes in society, namely poverty, social inequality and the need for a constant increase in expenditures from the state
budget [8-13]. According to the experience of socially oriented
health care systems in the countries of the European Union (EU), introduction and functioning of the compulsory medical insurance model will allow the introduction of rational models of the organization of provision of medical and pharmaceutical assistance to the patients regardless of their financial status in society. [14, 15]
In 1993, by a WHO decision, tuberculosis was recognized as a global emergency public health problem. In 2015, the United Nations (UN) adopted the UN Sustainable Development Goals program for 2016–2030, which included 17 points [16]. As part
of goal number 3, the task to “Put an end to: the epidemics of AIDS, tuberculosis, malaria, neglected tropical diseases, strengthen the fight against waterborne hepatitis, and other infectious diseases” has been set. Thus, up to 2030, it is necessary to reduce the number of deaths from TB by 90%, and the incidence rates of TB by 80%. At the same time, by 2020 and 2025, control target indicators of reduction (compared to 2015) of the number of deaths from TB are set at 35 and 75%, respectively, and incidence rates - by 20 and 50%, respectively (less than 55 and 10 cases of tuberculosis per 100 thousand population). WHO’s “EndTB Strategy”, endorsed by the 67th World Assembly of the WHO, which Ukraine has joined, calls to achieve a decrease for 2035 in comparison with 2015: the
Access this article online
Website: www.japer.in E-ISSN: 2249-3379
How to cite this article: Iuliia V. Korzh, Tatyana A. Romanko, Irina V. Zhirova, Maryna V. Podgaina, Lubov V. Tereschenko, Svetlana G. Kalaycheva. Study of social and Epidemiological Indicators of tuberculosis in the European region. J Adv Pharm Edu Res 2019;9(3):62-67.
Journal of Advanced Pharmacy Education & Research | Jul-Sep 2019 | Vol 9 | Issue3 63
number of deaths from TB by 95%, the incidence of TB per 100 thousand population - by 90%, and also to ensure that no one family with TB patients incurs disastrous expenses as a result of this [17].
Among international approaches to ensuring the availability of diagnostics and therapy, WHO also identify the priorities of the evaluation of medical technologies (Health technology assessment, HTA), which include the most effective economically feasible methods of diagnostics and pharmacotherapy of TB. Understanding the importance of Health Intervention and Technology Assessment (HTA) in support of universal health coverage, a resolution (WHA67.23) was approved during the 67th World Health Assembly [18].
The aim of the work is to analyze the social and epidemiological indicators of morbidity and mortality from TB in the countries of the European Region (ER).
To achieve this goal, it was necessary to solve the following tasks: to analyze the incidence and mortality rates from the TB groups of the ER countries on the basis of calculations of the average characteristics of the dynamic rows; to analyze the indicators of mortality rate in relation to the incidence of TB; to identify regions that require the development and
implementation of additional measures to improve the level of medical and pharmaceutical care for patients with TB in the ER; to analyze mortality rates in relation to the morbidity individually for each of the CIS countries.
Materials and Methods
The information base of the research was made up of officially published data on incidence and mortality from TB for the period 2013–2017 submitted by WHO [19, 20]. When
conducting research, retrospective, mathematical statistical, logical, graphical, and system-analytical methods of analysis have been used. According to the years of research, preliminary preparation of statistical data for processing and analysis was carried out using the Microsoft Office Excel 2016 spreadsheet processor and standard methods of variation statistics [21].
Analytical statistical databases of the WHO Europe Regional Office classify the region into separate groups of countries according to the territorial and temporary principle of joining the ER, which are presented in (Fig. 1).
Figure 1. Classification of ER countries according to WHO
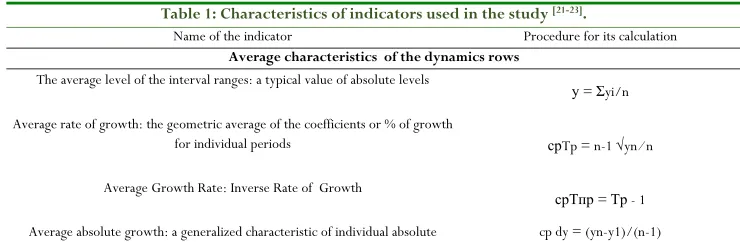
To analyze the dynamics of socio-epidemiological indicators of tuberculosis in the European region, we calculated the indicators, which are presented in Table 1.
Table 1: Characteristics of indicators used in the study [21-23].
Name of the indicator Procedure for its calculation
Average characteristics of the dynamics rows
The average level of the interval ranges: a typical value of absolute levels
у = Σyi/n
Average rate ofgrowth: the geometric average of the coefficients or % of growth
for individual periods срTp = n-1 √yn ⁄ n
Average Growth Rate: Inverse Rate of Growth
срТпр = Тр - 1
Average absolute growth: a generalized characteristic of individual absolute cp dy = (yn-y1)/(n-1)
Austria Albania Azerbaijan Аndorra Denmark
Belgium Bosnia Armenia Estonia Island
Great Britain Bolgary Belarus Luxemburg Norvey
Germany Hungary Georgia Маltа Finland
Greece Lintuania Kazakhstan Мonaco Sweden
Israel Latvia Kyrgystan San marino
Ireland Poland Moldova Montenegro
Spain Romania Russia
Italy Macedonia Tajikistan
Netherlands Serbia Turkmenistan
Portugal Slovakia Uzbekistan
Turkey Slovenia Ukaraine
France Croatia
Switzerland Czech
64 Journal of Advanced Pharmacy Education & Research | Jul-Sep 2019 | Vol 9 | Issue3 growths of dynamics rows
Intensive indicator Intensive indicators: comparison, comparing the dynamics of the frequency of the
phenomenon under study over time, or comparing the frequency of the same phenomenon in the same time interval
І = absolute number of phenomenon absolute number of medium *100,0
Results and Discussion
At the first stage of the study, we determined the incidence and mortality rates for TB in groups of ER countries based on
calculations of the average characteristics of the dynamics rows. The summarized results of the study are presented in Table. 2.
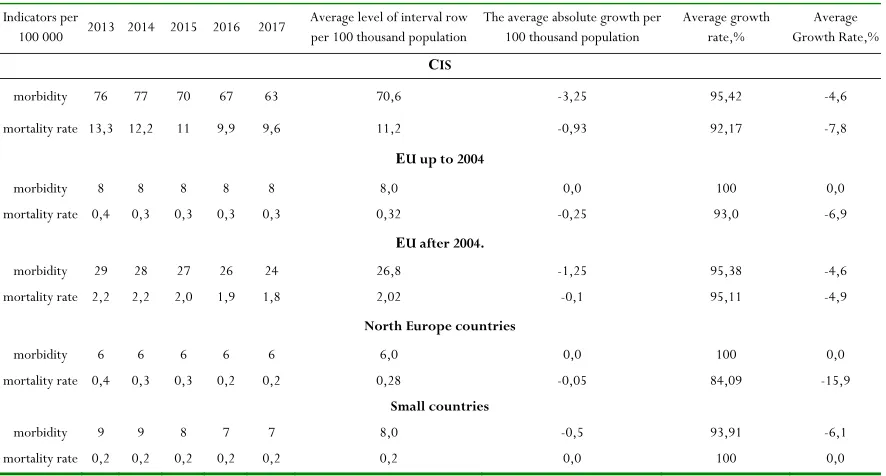
Table 2: The results of the study of indicators of the dynamics of TB morbidity and mortality levels in the ER countries for the period 2013–2017
Indicators per
100 000 2013 2014 2015 2016 2017
Average level of interval row per 100 thousand population
The average absolute growth per 100 thousand population
Average growth rate,%
Average Growth Rate,%
СIS
morbidity 76 77 70 67 63 70,6 -3,25 95,42 -4,6
mortality rate 13,3 12,2 11 9,9 9,6 11,2 -0,93 92,17 -7,8
ЕU up to 2004
morbidity 8 8 8 8 8 8,0 0,0 100 0,0
mortality rate 0,4 0,3 0,3 0,3 0,3 0,32 -0,25 93,0 -6,9
ЕU after 2004.
morbidity 29 28 27 26 24 26,8 -1,25 95,38 -4,6
mortality rate 2,2 2,2 2,0 1,9 1,8 2,02 -0,1 95,11 -4,9
North Europe countries
morbidity 6 6 6 6 6 6,0 0,0 100 0,0
mortality rate 0,4 0,3 0,3 0,2 0,2 0,28 -0,05 84,09 -15,9
Small countries
morbidity 9 9 8 7 7 8,0 -0,5 93,91 -6,1
mortality rate 0,2 0,2 0,2 0,2 0,2 0,2 0,0 100 0,0
It has been established that the incidence rate (morbidity) of tuberculosis in the CIS countries is extremely high; the average incidence rate per 100,000 population has value of 70.6. A positive trend can be considered that during the analyzed period, the average rate of increase in the incidence rate decreased by 4.6%. An annual decrease in incidence of 3.25 per 100 thousand populations has been established. It should be noted that the data on the incidence rate of TB in the ER countries until 2004 indicate a stable incidence rate. Thus, the average interval figure for five years has not been changed and has a value of 8.0 per 100,000 populations, which, in turn, confirms the lack of growth. The incidence rate of TB in the ER countries after 2004 for the analyzed period is represented by the value 26.8 per 100,000 population and a decrease in the number of cases by 4.6 % or by an annual reduction of 1.25 per 100,000 population. The countries of the Northern region of Europe are presented with an indicator 6.0 per 100 thousand of the population, which is the lowest indicator in the ER. Also, this group of countries has no growth dynamics. The average incidence of TB in small ER countries is 8.0 per 100,000 population, the average rate of increase in incidence was -6.1%, and the
average absolute increase per 100,000 population decreased annually by 0.5.
One of the indicators of the effectiveness of medical and pharmaceutical care is the data of the mortality dynamics rows. Thus, the study shows that the average interval rows for TB mortality in the CIS countries is 11.2 per 100,000 population, the average growth rate has decreased by 7.8 % or 0.93 per 100,000 population annually. Until 2004, the EU countries showed a value 0.32 per 100,000 population, the average rate of increase in mortality from TB decreased by 6.9 %, which is an annual decrease of 0.25 per 100 000 population. The death rate from TB in the EU countries after 2004 has a value of 2.02 per 100,000 population, the average growth rate decreased by 4.9 %, which annually was 0.1 per 100,000 population. The countries of the northern region of Europe are represented by indicators 0.28 per 100 thousand populations, the overall reduction in the number of deaths from TB was a record for the countries of the European Region of WHO, 15.9 %. Mortality rate from TB in Small countries of the ER showed a uniform dynamics of the mortality rate 0.2 per 100,000 population with zero growth rates.
Journal of Advanced Pharmacy Education & Research | Jul-Sep 2019 | Vol 9 | Issue3 65
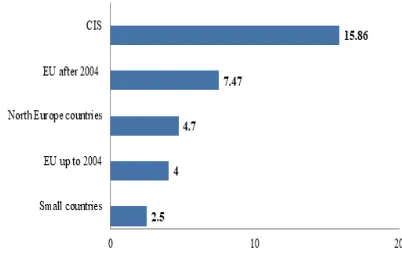
2013-2017, and did not correspond the set goals for reducing TB morbidity and mortality. However, it is fair to notify that the general criteria for TB burden in North Europe, small countries and EU countries until 2004 are practically absent. Critical for Europe is the situation in the CIS countries. The next stage of the study was the calculation of intensive indicators of the mortality rate relative to the incidence of TB. The results of the study are presented in (Fig. 2).
Figure 2. Intensive indicators of the mortality rate relative to
the incidence of TB, %.
It was established that the number of deaths in relation to the incidence of TB in the CIS countries is 15.86 %, which is more than twice increase in the intensive indicators of all analyzed groups of ER countries. This indicator indicates that the degree of medical and pharmaceutical care for TB patients in the CIS countries is less effective than in other ER countries. Thus, the relative deviation between max (15.86) and min (2.5) indicators was +13.61 %.
Taking into account that the indicators of the CIS countries are threatening for the ER on morbidity and mortality from tuberculosis, an analysis of intensive mortality rates has been carried out further with relation to morbidity individually for each of the CIS countries. The average incidence and mortality per 100,000 population for the period 2013-2017 was used for the study. The calculated interval step for the intensive indicator was 4.76. Country rankings revealed three grouping criteria. The first group was formed by countries for which there was a fluctuation in the range of 10.7–15.46%, the second - from 15.47 to 20.3%, and the third - 20.04– 25.0%. Taking into account the results of the ranking, countries formed the risk groups for the mortality rate for TB incidence: relatively moderate, high and threatening risk (Table 3).
Table 3: Intensive mortality rates with relation to TB incidence for the CIS countries
Rank of death rate
from TB incidence
CIS countries of ER
Incidence, per 100 thousand
population
Mortality, per 100 thousand population
Intensive indicator,
%
moderate
Kazakhstan 89,47 9,70 10,70
Kyrgyzstan 111,77 13,20 11,7 Georgia 80,27 8,90 11
The Republic
of Moldova 109,27 13,32 12
Azerbaijan 58,27 8,64 14,7 Tajikistan 70,27 10,40 14,8
high
Uzbekistan 56,27 9,86 17,4
Armenia 38,47 7,74 20
threatening
Russian
Federation 68,87 14,56 21
Belarus 41,07 9,12 22,1 Ukraine 73,07 16,32 22,3
Turkmenistan 50,07 12,54 25
It was established that the group with a moderate degree of risk included six countries, the second group was represented by two countries, and the group with a threatening mortality rate for people with TB included four countries. The best intensive indicator among the CIS countries belongs to Kazakhstan (10.7), the worst situation with the number of deaths from TB in Turkmenistan (25.0) and the relative deviation of data between these countries is +14.3.
It should be noted that the group with a relatively moderate mortality rate for morbidity included the countries with the highest incidence rates of TB, namely Kyrgyzstan (111.77) and Moldova (109.27). However, the mortality rate of TB cases in these countries is significantly lower than in countries with a moderate incidence in the CIS. This fact proves that the results of medical and pharmaceutical care are determined by the degree of recovered patients, and not by the incidence rate.
The main factors affecting the high mortality rate for TB in the CIS countries are:
an increase in cases of multi-resistance to first-line anti-TB drugs, which greatly complicates the effectiveness of treatment;
lack of high-quality laboratory diagnostics, high-speed tests of drug sensitivity, high-quality selection of individual treatment regimens with the possibility of varying drugs, an effective system of TB services.
In our opinion, the main cause of the low rates of growth in the reduction of morbidity and mortality in the CIS countries is a significant economic burden on inpatient and outpatient treatment. With absolute certainty, it can be argued that without comprehensive European support, such countries will not be able, in the near future, to correspond ER standards in the fight against TB.
Conclusion
66 Journal of Advanced Pharmacy Education & Research | Jul-Sep 2019 | Vol 9 | Issue3
mathematical and expert estimates of indicators, data recorded by national surveillance systems and the results of special epidemiological studies; the published information allows to held retrospective analysis and assessment of the current state of the problem, compare regions and countries with each other, and plan activities aimed at improving the effectiveness of national TB control programs.
The five-year interval study period showed that the most critical situation in the fight against TB in the WHO ER is the situation in the CIS countries. According to the analysis criteria in this group of countries, the highest indicators of the effectiveness reducing the number of cases of TB have been found. However, in spite of the success of the main indicators, the level of both morbidity and mortality remains critically high. With the current level of morbidity in the CIS countries, the growth rates of the reduction in morbidity and mortality need to be increased threefold in order to reach the average level of other groups of the ER countries. The indicator of the level of the frequency of fatal outcome among the patients in the CIS countries is more than two times higher than the same indicator of other countries of ЕR. The study proves that the provision of medical and pharmaceutical assistance in the CIS countries does not correspond European standards and requires constant monitoring by WHO.
Tuberculosis incidence is either stagnant or declining more slowly than mortality in many tuberculosis-endemic countries, suggesting delays in diagnosis and treatment [24].
Strengthening of national surveillance systems to capture all tuberculosis cases is an important public health goal for all countries. Until this goal is achieved, statistical data triangulation methods will be needed to make use of the available data for tracking of the tuberculosis burden. Despite general progress in reduction of tuberculosis mortality, the disease is still an enormous burden globally. Strengthening of health systems for early case detection and improvement of the quality of tuberculosis care, including prompt and accurate diagnostics, early initiation of treatment, and routine follow-up, are priorities [25, 26]. Countries where the tuberculosis burden is
higher than expected based on sociodemographic development should investigate the reasons for lagging behind and address them as appropriate.
References
1. Alla A. Kotvitska, Alina V. Cherkashyna, Alina V. Volkova, Inna V. Kubarieva Analysis of the current state and the dynamics of lipid-lowering drugs in the pharmaceutical market of Ukraine. Asian Journal of Pharmaceutical and Clinical Research. 2018; 11 (6): 358-362.
2. WHO. Cardiovascular Diseases (CVDs). Media Center, Fact Sheet. Geneva: World Health Organization. Available from: http://www.who. int/mediacentre/factsheets/fs317/en. [Last updated on
2017 2015 Jan 13; Last cited on 2017 Jul 21].
3. Andhuvan G, Ayyappan P, Sahana C, Poovizhi S, Sivasakthi K. Knowledge of modifiable risk factors of heart disease among patients with cardiovascular risk. Asian J Pharm Clin Res 2017;10:99-102
4. Hershkovitz I, Donoghue HD, Minnikin DE, May H, Lee OY, Feldman M, et al. Tuberculosis origin: the Neolithic scenario. Tuberculosis (Edinb). 2015;95 (1):122–6
5. World Health Organization. Regional Office for Europe. (2019). Tuberculosis surveillance and monitoring in Europe 2019: 2017 data. World Health Organization. Regional Office for Europe. Available from:
https://apps.who.int/iris/handle/10665/311349 6. World Health Organization. Global tuberculosis report
2018. Geneva, Switzerland: World Health Organization; 2018. Available from: https://www.who.int/tb/publications/global_report/ en/
7. Gupta RK, Lucas SB, Fielding KL, Lawn SD. Prevalence of tuberculosis in post-mortem studies of HIV-infected adults and children in resource-limited settings: a systematic review and metaanalysis. AIDS 2015;29:1987–2002.
8. MacNeil A, Glaziou P, Sismanidis C, Maloney S, Floyd K. Global Epidemiology of Tuberculosis and Progress Toward Achieving Global Targets - 2017. MMWR Morb Mortal Wkly Rep. 2019 Mar 22;68(11):263-266. 9. World Health Organization. Assessing tuberculosis
under-reporting through inventory studies. Geneva, Switzerland: World Health Organization; 2012.
Available from: https://apps.who.int/iris/bitstream/handle/10665/7
8073/9789241504942_eng.pdf
10. Badje A, Moh R, Gabillard D, et al.; Temprano ANRS 12136 Study Group. Effect of isoniazid preventive therapy on risk of death in west African, HIV-infected adults with high CD4 cell counts: long-term follow-up of the Temprano ANRS 12136 trial. Lancet Glob Health 2017;5:1080–9.
11. Floyd K, Glaziou P, Zumla A, Raviglione M.The global tuberculosis epidemic and progress in care, prevention, and research: an overview in year 3 of the End TB era. Lancet Respir Med. 2018 Apr;6(4):299-314.
12. World Health Organization. Latent TB infection: updated and consolidated guidelines for programmatic management. Geneva, Switzerland: World Health Organization; 2018. Available from: https://www.who.int/tb/publications/2018/executiv esummary_consolidated_guidelines_ltbi.pdf?ua=1 13. Houben RM, Dodd PJ. The global burden of latent
Journal of Advanced Pharmacy Education & Research | Jul-Sep 2019 | Vol 9 | Issue3 67
14. Hanna Panfilova, Liliia Hala, Yu. L. Zaytzeva. Analysis of problems and prospects of development of voluntary medical insurance in Ukraine. J Adv Pharm Edu Res 2019;9(1):17-26
15. Nechiporuk LV. Theory and Practice of Health Insurance in Ukraine. Global and national problems of the economy. 2015;6 (24): 56-60
16. UN General Assembly Resolution of September 25,
2015. Available from: https://www.un.org/en/development/desa/populati
on/migration/generalassembly/docs/globalcompact/A _RES_70_1_E.pdf
17. Implementing The End TB Strategy: the essentials. Geneva: World Health Organization; 2015 (WHO/HTM/TB/ 2015.31; Available from: https://www.who.int/tb/publications/2015/end_tb_ essential.pdf)
18. Available from:
https://www.who.int/medical_devices/assessment/si gned_mou_htai.pdf?ua=1
19. Available from: https://www.who.int/ru
20. Available from: http://www.euro.who.int/ru/home 21. The course of socio-economic statistics: Textbook for
universities / Ed. prof. M.G. Nazarov. - M .: Finstatinform, UNITY-DANA, 2000 .: 771 p.
22. Statistics: pіdruchnik. S. S. Gerasimenko [ta іn.]; ed. S. S. Gerasimenko; Kyiv National Economic University. - 2. view., Pererob. and add. - K.: KNEU, 2000 . 467 p. 23. Zubov N.N. Mathematical methods and models in
pharmaceutical science and practice: a guide for pharmacists and managers of pharmaceutical enterprises (organizations) / N.N. Zubov, S.Z. Umarov, S.A. Bunin.- SPb .: Publishing house Polytechnic. University, 2009: 249 р.
24. Floyd K, Glaziou P, Houben RMGJ, Sumner T, White RG, Raviglione M. Global tuberculosis targets and milestones set for 2016-2035: definition and rationale. Int J Tuberc Lung Dis. 2018 Jul 1;22 (7):723-730. 25. Sreeramareddy CT, Qin ZZ, Satyanarayana S,
Subbaraman R, Pai M. Delays in diagnosis and treatment of pulmonary tuberculosis in India: a systematic review. Int J Tuberc Lung Dis.2014;18:255– 266