A
LICJAK
ĘDZIA1, R
YSZARDA
NDRZEJAK2, K
RZYSZTOFD
UDEK3, J
ACEKS
TANKOWSKI4Analysis of Human Scapula Morphometry
in the Fetal Period*
Morfometria łopatki człowieka w okresie prenatalnym
1, 4Department of Normal Anatomy, Wroclaw Medical University, Poland
2Department of Internal Diseases, Occupational Diseases, and Hypertension, Wroclaw Medical University, Poland
3Institute of Machine Design and Operation, Technical University of Wrocław, Poland Adv Clin Exp Med 2009, 18, 3, 197–204
ISSN 1230−025X
EDITORIAL
© Copyright by Wroclaw Medical University
Abstract
Background.This paper presents a correlation analysis of results for 22 linear measurements describing scapular geometry in the human fetal period. The analysis aimed at selecting sizes correlating most with fetal age. The math− ematical model appears suitable for assessing fetal age on the basis of only two scapular sizes and can be applied in forensic medicine or archaeology. During life, scapular measurements can constitute a fetal age assessment para− meter of hypotrophy.
Objectives. The goal of the study was to analyze the metrology and anatomy of the human scapula in the fetal period.
Material and Methods.The material consisted of 63 fetuses (28 males, 35 females) aged 4–7 months of fetal life with a crown−rump length of 85–235 mm. The distances between characteristic points of the scapula were mea− sured using the Gimp 2.0 and Scion for Windows computer programs on the basis of previously prepared scapu− lae photographs. Statistical analysis of the results excluded sexual dimorphism and left−right asymmetry. The analysis was followed up by the Shapiro−Wilk test for normality, Wilcoxon’s signed−rank test for two related sam− ples, the Mann−Whitney Utest for independent samples, as well as nonlinear and multiple regression. The coeffi− cient R2was determined to evaluate the goodness of fit of nonlinear mathematical models.
Results. The majority of the analyzed sizes strongly correlated with one another and with fetal age. Irregular increases in particular sizes were detected. The decreased rate in scapular development between the 17thand 25th weeks suggests the use of nonlinear models in its description in the prenatal period. The most considerable increase was noted in the lateral margin of the scapula. A correlation matrix was incorporated in all measurements and all features proved to correlate with age. The distance between glenoid labrum and coracoid process did not reveal any statistical correlation with age and was the only exception to the above observation. In the first weeks (14th–17th), the rate of scapular spine growth was greater than that of the distance between the superior angle and osseous mar− gin, thus making the height−length index D1/L2 correlate negatively with age. Starting from the 19thweek the pro− portions become stable.
Conclusions. Faster growth of the length of the spine crest than the distance between the superior angle and the osseous margin in the 14th–17thweeks of fetal life makes height−length index W
1 correlate positively with age,
which means that scapular bone width increases faster than its length. The linear sizes helped to determine the bone and cartilage areas. The largest increase in osseous surface was observed in the 28thweek of fetal life. In the ana− lyzed period of fetal life, the increase in bone surface area ABis sigmoid (rapid growth at the initial and final
stages), whereas the increase in cartilage surface area ACis characterized by a sharp rate only in the first stage
(14th–17thweek) (Adv Clin Exp Med 2009, 18, 3, 197–204).
Key words: human scapula morphometry, prenatal period.
Streszczenie
Wprowadzenie. W pracy przedstawiono wyniki analizy współzależności 22 wymiarów liniowych opisujących ge− ometrię łopatki w okresie płodowym człowieka, mającą na celu wybór wymiarów najsilniej korelujących z wie− kiem płodu. Zaproponowano model matematyczny umożliwiający oszacowanie wieku płodu na podstawie jedynie
Human scapula development during the fetal period is hardly presented in the majority of hand− books or anatomical papers. The papers usually discuss either the embryonic or post−partum peri− ods [8]. Most surveys concerning fetal periods were performed using ultrasound [6]. Only single developmental studies of the scapula presented in the available literature were based on a a very large amount of material [5, 18]. Also, surveys focusing on this anatomical region prove very poor as they usually concentrate on one particular part of the scapula or changes in only one dimension [2–4, 9, 10, 12, 16, 21]. Only some anatomical and ultra− sound−based papers discuss the scapula as a whole. According to Mal [17], the first centers of scapular ossification appear on the 55thday. On the 58thday,
their cross−sectional diameter amounts to 2.5 mm and on the 85th9 mm [6, 7]. Fawcett [9] developed
a scapular bone model in a 19−mm embryo. He described the acromion, scapular spine, and sub− and suprapectinate areas. Dijkstra [5] studied human scapular development based on material including 18 fetuses with CR length of 16–120 mm. He discussed the moment of scapular spine crest as well as suprapectinate surface formation in fetuses with a CR length of over 40 mm. In a 16−mm−long embryo he detected the presence of fovea, foramen, and superior angle and the supra− pectinate foramen was noted in a 25−mm−long embryo. Dijkstra confirmed the formation of the
scapula in fetuses with a CR length of 16 mm. Gardner and Gray [11], based on material with CR length of 12–28 mm, observed scapula formation beginning at a CR length of 12 mm, scapular spine crest formation at 20 mm, and shoulder joint mar− gin area ossification at 28 mm. In his description of upper limb development, Andersen [2] examined 49 human fetuses with CR length of 11–34 mm and discovered that the most mature cartilage was located in the very center of the scapula. He con− firmed the observations of other authors [11] who had detected scapula presence even at a CR length of 12 mm. Drexler [7] examined 51 scapulas of both fetuses and neonates. He compared the dimen− sions and sizes of the scapula at three stages of human life, fetal, infantile, and adult, taking into account its location and shape. He measured the length and width of the scapula as well as glenoid fossa measurements and angles found in this organ. The authors of ultrasound−based papers [6] dealt only with scapular bone length measurement. Ultrasound was performed in 343 women. The fetuses' ages varied from 16 to 41 weeks. Biparietal measurements were made as well as scapular length, abdominal circumference, and femoral length. The most considerable growth was observed in the 28thweek of fetal life. Correlation
between age and scapular size increase was noted and scapular length was suggested as one of the possible parameters of fetal growth.
dwóch wymiarów łopatki. Model ten może być wykorzystany w medycynie sądowej lub archeologii. Przyżycio− wo pomiary łopatki mogą być jednym z parametrów oceny wieku płodu w hipotrofii.
Cel pracy.Analiza metrologii i anatomii ludzkiej łopatki w okresie płodowym.
Materiał i metody. Materiał składał się z 63 płodów (28 męskich i 35 żeńskich w wieku 4–7 miesięcy, wymiar v−tub wynosił 85–235 mm. Odległości między charakterystycznymi punktami łopatki mierzono, wykorzystując program komputerowy Gimp 2.0 oraz Scion for Windows na podstawie fotografii wcześniej wypreparowanych ło− patek. Analiza statystyczna wyników pomiarów wykluczyła na poziomie p < 0,05 występowanie dymorfizmu płciowego i asymetrii między stroną lewą i prawą. W analizie korzystano z testu normalności Shapiro−Wilka, te− stu Wilcoxona dla zmiennych zależnych, testu UManna−Whitneya dla zmiennych niezależnych regresję nielinio− wą i regresję wieloraką. Do oceny dokładności dopasowania nieliniowych modeli matematycznych do wyników pomiarów wykorzystano współczynnik determinacji R2.
Wyniki. W badanym okresie większość z analizowanych wymiarów silnie korelowało między sobą oraz z wiekiem płodu. Stwierdzono nierównomierne tempo wzrastania poszczególnych wymiarów. Wolniejsze tempo między 17. i 25. tygodniem sugeruje, że do opisu rozwoju łopatki w okresie prenatalnym są przydatne modele nieliniowe. Największy przyrost występował w obrębie brzegu bocznego łopatki. Dla wszystkich pomiarów wyznaczono ma− cierz korelacji – wszystkie cechy korelowały z wiekiem. Wyjątkiem była odległość między obrąbkiem stawowym a wyrostkiem kruczym, która nie wykazała istotnego statystycznie związku z wiekiem. W pierwszych tygodniach (14.–17.) tempo wzrostu długości grzebienia łopatki było większe od tempa wzrostu odległości między kątem gór− nym a końcem kostnym łopatki, co powodowało, że wskaźnik wysokościowo−długościowy D1/L2 koreluje ujem− nie z wiekiem. Od 19. tygodnia proporcje łopatki ustalają się.
Wnioski. Szybsze tempo wzrostu wymiaru długości grzebienia łopatki od odległości między kątem górnym a koń− cem kostnym łopatki w pierwszych tygodniach (14.–17.) powoduje, że wskaźnik wysokościowo−długościowy W1
koreluje ujemnie z wiekiem, tzn. szerokość łopatki rośnie szybciej niż jej długość. Wymiary liniowe posłużyły do wyznaczenia pola powierzchni kości i chrząstki. Największe tempo wzrostu powierzchni kostnej zaobserwowano w 28. tygodniu życia płodowego. W analizowanym okresie życia płodowego wzrost pola powierzchni kości ABma
charakter sigmoidalny (szybki wzrost w początkowym okresie i końcowym, wzrost pola powierzchni chrząstki AC
natomiast charakteryzuje się szybszym tempem jedynie w pierwszym okresie (14.–17. tygodniu) (Adv Clin Exp Med 2009, 18, 3, 197–204).
The goal of the present study was a more thor− ough analysis of scapular metrology and anatomy in the fetal period. The mathematical model appeared suitable to assess fetal age on the basis of two scapular sizes only. This model can be applied in forensic medicine or archaeology. During life, scapular measurements can constitute a fetal age assessment parameter of hypotrophy.
Material and Methods
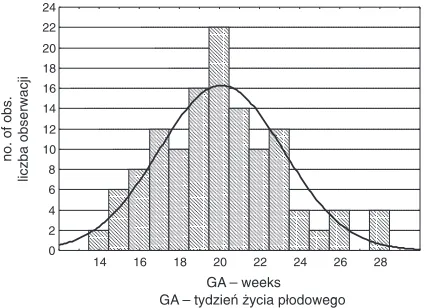
The material consisted of 63 human fetuses of both sexes (28 male, 35 female) aged 14–28 weeks of fetal life with crown−rump (C−R) length of 85–235 mm (Fig. 1). The fetuses were examined bilaterally with special concern for symmetry and sexual dimorphism of the scapula or lack of these features. Morphological age was assessed with the use of an anthropological method based on CR length size and Scammon−Calkins tables [20]. One hundred twenty−six bones were prepared and exculpated of soft tissues. Digital photographs of the scapulae were taken on both sides perpendicu− lar to the osseous surfaces. They were preliminar− ily processed with the Gimp 2.0 program. Image digital activation enabled repeated measurements without the danger of excessive devastation of the fetal material. The program Scion for Windows helped to determine the distances between charac− teristic points describing the scapular bone and cartilage geometry.
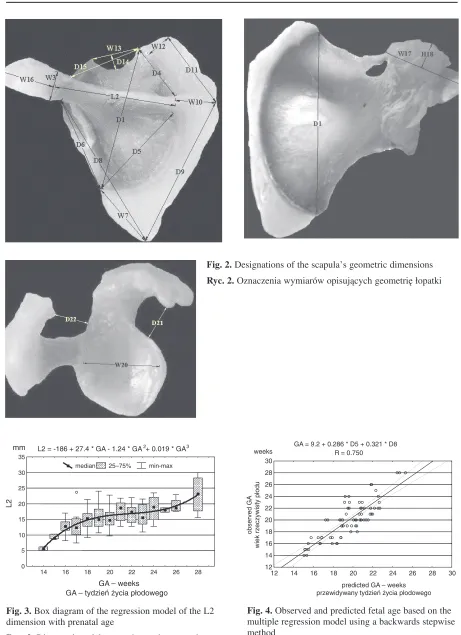
For each specimen, 22 linear measurements were established (Table 1, Fig. 2). The results were statistically analyzed. The significance of differ− ences between male and female fetal features was verified with the Mann−Whitney U test. The sig− nificance of the difference between scapular para−
meters on the left and right side was assessed with the Wilcoxon test for ranked pairs. As (at the level of p < 0.05) no dimorphism or asymmetry of the examined dimensions was found, the regression coefficient was determined on the basis of the 126 scapulae results (male and female fetuses, left and right sides). Dispersion graphs of the parame− ters as functions of age were analyzed. Nonlinear dependencies were considered when describing the relationships of fetal age and linear and super− ficial scapular sizes. In curvilinear regression models, exponential and polynomial functions were taken into account. The relation between ana− lyzed size pairs was established with Spearman's rank correlation coefficient. In all tests, p = 0.05 was accepted as the level of statistical signifi− cance. Multiple regression analysis was used to form the model predicting fetal age on the basis of the measurements. A backwards stepwise method of multiple regression enabled building a model in which the number of independent variables was reduced from 22 to 2.
Results
The following features were analyzed: sex dimorphism, symmetry, growth rate, linear increases in features and surfaces in particular weeks, and the length−width index.
The results of 2772 measurements of dimen− sions defining scapular geometry were statistically analyzed (Fig. 2). The analysis aimed at assessing sex dimorphism, dimensional symmetry on the right and left sides, and growth rate analysis (Tab. 1). The correspondence of the dimensions’ empirical distributions and a theoretical normal distribution was analyzed with the Shapiro−Wilk test with
p= 0.05 as the critical level. In the particular age groups, the measurement distributions were close to normal. The ttest for paired dependent samples was used to verify the significance of differences in measurements on the left and right sides and no statistically significant differences (at the p < 0.05 level) were noted in the analyzed dimensions. Sex dimorphism was verified with the t test for inde− pendent samples and none of the 22 dimensions revealed any statistically significant difference with respect to fetal sex (p> 0.05). Due to the lack of sex dimorphism and the presence of symmetry, the growth rate analysis incorporated the results of right and left scapula measurements in male and female fetuses jointly. Some dimensions were used in bone and cartilage area evaluation and in length−width index determination.
The increases in the majority of the dimen− sions were unstable. The increased rate in the first
14 16 18 20 22 24 26 28
GA–weeks GA – tydzień życia płodowego
0 2 4 6 8 10 12 14 16 18 20 22 24
no. of obs.
liczba obserwacji
Fig. 1. Bar chart of the fetuses’ ages with a superim− posed normal distribution
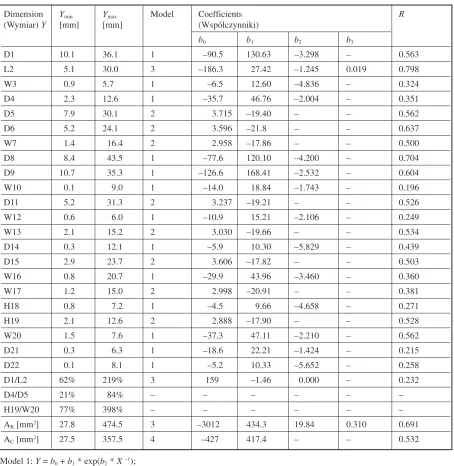
weeks (Fig. 3) suggests the application of a non− linear model to describe scapular development in the prenatal period. Dispersion graph analysis showed that the majority of the linear size growth rates were smaller in the 18th and 26th weeks of
fetal life than in the other analyzed periods. The coefficients of the values for nonlinear regression are significantly higher than the correlation coeffi− cients for classical linear regressions. This proves that nonlinear models match measurements results better. Snedecor’sFtest results (p< 0.05) proved this observation as well.
Table 2 presents the distribution of the math− ematical coefficients which enable assessment of the analyzed dimensions, indices, and bone and cartilage areas in the period from 14th to 28th
weeks. The best match of the model and mea− surement results was acquired in the case of the dimension D8 (the distance between the scapu− la’s lateral angle on the bone and the cartilage superior angle, R= 0.704) and D6 (the distance between the scapula’s lateral angle on the bone and the superior angle of the scapular spine,
R= 0.637). Knowledge of these dimensions pro−
Table 1.Scapular quantitative features and the adopted designations
Tabela 1.Parametry ilościowe łopatki i ich oznaczenia Symbol Scapula dimension – mm
(Wymiar łopatki – mm)
D1 distance between scapula superior angle and osseous margin odległość między kątem górnym a końcem kostnym łopatki L2 scapular spine length
długość grzebienia łopatki W3 crest width on its osseous part
szerokość grzebienia na jego części kostnej
D4 distance between scapula superior angle on the bone and the beginning of scapular spine odległość między kątem górnym łopatki na kości a początkiem grzebienia łopatki D5 distance between scapula inferior angle on the bone and the beginning of scapular spine
odległość między kątem dolnym łopatki na kości a początkiem grzebienia łopatki D6 distance between lateral angle on the bone and inferior angle of scapular spine
odległość między kątem bocznym łopatki na kości a kątem dolnym grzebienia łopatki W7 cartilage width at the height of the inferior angle
szerokość chrząstki na wysokości kąta dolnego
D8 distance between scapula lateral angle on the bone and inferior angle on the cartilage odległość między kątem bocznym łopatki na kości a kątem dolnym łopatki na chrząstce
D9 distance between scapular inferior angle on the cartilage and the beginning of the spine on the cartilage odległość między kątem dolnym łopatki na chrząstce a początkiem grzebienia na chrząstce
W10 cartilage width at the scapular spine level
szerokość chrząstki na wysokości grzebienia łopatki
D11 distance between scapular superior level on the cartilage and the beginning of the scapular spine in the cartilage odległość między kątem górnym łopatki na chrząstce a początkiem grzebienia łopatki na chrząstce
W12 cartilage width at the height of the superior angle szerokość chrząstki na wysokości kąta górnego W13 scapular incisure width
szerokość wcięcia łopatki D14 scapular incisure maximum depth
największa głębokość wcięcia łopatki
D15 distance between scapular superior angle on the bone and scapular lateral angle odległość między kątem górnym łopatki na kości a kątem bocznym łopatki W16 scapular spine cartilage width
szerokość chrząstki grzebienia łopatki W17 coracoid process width
szerokość wyrostka kruczego H18 coracoid process height
wysokość wyrostka kruczego H19 glenoid fossa height
wysokość jamy stawowej W20 glenoid fossa width
szerokość jamy stawowej
D21 minimum distance between glenoid labrum and coracoid process
najmniejsza odległość między obrąbkiem stawowym a wyrostkiem kruczym D22 minimum distance between glenoid labrum and acromion
Fig. 2.Designations of the scapula’s geometric dimensions
Ryc. 2.Oznaczenia wymiarów opisujących geometrię łopatki
L2 = −186 + 27.4 * GA − 1.24 * GA2+ 0.019 * GA3
14 16 18 20 22 24 26 28
GA–weeks GA – tydzień życia płodowego
0 5 10 15 20 25 30 35
median 25–75% min−max
L2
mm
Fig. 3.Box diagram of the regression model of the L2 dimension with prenatal age
Ryc. 3.Diagram i model regresyjny zmiany wymiaru L2 w funkcji wieku płodu
GA = 9.2 + 0.286 * D5 + 0.321 * D8 R = 0.750
12 14 16 18 20 22 24 26 28 30
predicted GA – weeks przewidywany tydzień życia płodowego 12
14 16 18 20 22 24 26 28 30
observed GA
wiek rzeczywisty płodu
weeks
Fig. 4. Observed and predicted fetal age based on the multiple regression model using a backwards stepwise method
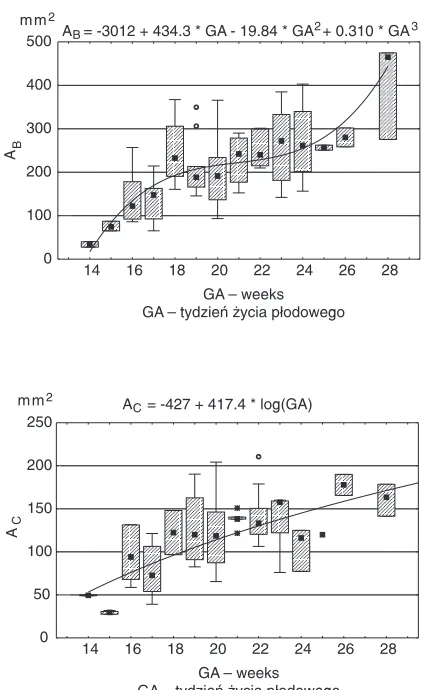
vides the basis for defining fetal age with a very small error (Fig. 4). In the analyzed period of fetal life, the increase in bone area (AB) is of sig−
moid character (rapid at the initial and final stages), whereas the increase in cartilage area (AC) has a more intensive rate at the initial stage
only (from 14th to 17th week), hence the conclu−
sion that the cartilage area portion of the whole scapula area decreases nonlinearly with age. Regression in the analyzed period is poor, but statistically significant (p < 0.05, Fig. 5). The
more considerable growth rate of the L2 dimen− sion (the scapular spine length) than that of the D1 dimension (the distance between the superior angle and osseous end) in the first weeks (14th–17th) causes a negative correlation of the
height−length index D1/L2 with age (Fig. 6). This means that scapular width increases faster than scapular length. Other analyzed indexes, scapular diameter, as well as the articular cavity remain at constant levels (D4/D5 = 52% and H19/W20 = 195%).
Table 2.Extreme values of scapular dimensions, surface area, and mathematical model coefficients
Tabela 2. Zakres zmienności wymiarów i powierzchni łopatki oraz współczynniki modeli matematycznych
Dimension Ymin Ymax Model Coefficients R
(Wymiar) Y [mm] [mm] (Współczynniki)
b0 b1 b2 b3
D1 10.1 36.1 1 –90.5 130.63 –3.298 – 0.563
L2 5.1 30.0 3 –186.3 27.42 –1.245 0.019 0.798
W3 0.9 5.7 1 –6.5 12.60 –4.836 – 0.324
D4 2.3 12.6 1 –35.7 46.76 –2.004 – 0.351
D5 7.9 30.1 2 3.715 –19.40 – – 0.562
D6 5.2 24.1 2 3.596 –21.8 – – 0.637
W7 1.4 16.4 2 2.958 –17.86 – – 0.500
D8 8.4 43.5 1 –77.6 120.10 –4.200 – 0.704
D9 10.7 35.3 1 –126.6 168.41 –2.532 – 0.604
W10 0.1 9.0 1 –14.0 18.84 –1.743 – 0.196
D11 5.2 31.3 2 3.237 –19.21 – – 0.526
W12 0.6 6.0 1 –10.9 15.21 –2.106 – 0.249
W13 2.1 15.2 2 3.030 –19.66 – – 0.534
D14 0.3 12.1 1 –5.9 10.30 –5.829 – 0.439
D15 2.9 23.7 2 3.606 –17.82 – – 0.503
W16 0.8 20.7 1 –29.9 43.96 –3.460 – 0.360
W17 1.2 15.0 2 2.998 –20.91 – – 0.381
H18 0.8 7.2 1 –4.5 9.66 –4.658 – 0.271
H19 2.1 12.6 2 2.888 –17.90 – – 0.528
W20 1.5 7.6 1 –37.3 47.11 –2.210 – 0.562
D21 0.3 6.3 1 –18.6 22.21 –1.424 – 0.215
D22 0.1 8.1 1 –5.2 10.33 –5.652 – 0.258
D1/L2 62% 219% 3 159 –1.46 0.000 – 0.232
D4/D5 21% 84% – – – – – –
H19/W20 77% 398% – – – – – –
AB[mm2] 27.8 474.5 3 –3012 434.3 19.84 0.310 0.691
AC[mm2] 27.5 357.5 4 –427 417.4 – – 0.532
Model 1: Y= b0+ b1* exp(b2* X–1); Model 2: Y= exp(b0+ b1* X–1);
Model 3: Y= b0+ b1* X+ b2* X2+ b3* X3; Model 4: Y= b0+ b1* exp(X);
The proportion of cartilage surface of the scapula’s total surface decreases from 140% in the 14th to 60% in the 19th week and remains at the
same level until the 28thweek (Fig. 7).
Discussion
Papers by Alverdes [1], Hertwig [13], and Rauber [19] largely contributed to understanding scapular development and they stressed the stabil− ity of scapular geometry for the whole human life. The present survey showed that scapular propor− tions undergo changes. The height−length coeffi− cient D1/L2 decreases from 190% in the 14thweek
to 140% in the 18thweek and remains stable until
the 28thweek. In the third month of fetal life, ossi−
fication begins in the area of the scapular lateral angle (shoulder joint area). Dijkstra [5] found the scapula in a 16−mm fetus which was similar in form to that observed in adults as it had a fossa and a superior angle present. On the basis of a study of
the cartilaginous skeleton of an embryo with a C−R length of 17 mm, Hagen [12] stated that as early as at this developmental stage, except for an almost absolutely undeveloped scapular spine, all scapular parts corresponded with an adult scapula as far as their shape was concerned. Lewis [16] concentrated on the development of the upper limbs in 9 fetuses with C−R length of 3.5–20 mm and in an 11−mm embryo the acromion and cora− coid process were found. Available literature does not include any studies incorporating the Scion for Windows program. This option enables precise measurement exact to 0.01 millimeter and repeata− bility of results. The elicited results concerning the
AB= −3012 + 434.3 * GA − 19.84 * GA2+ 0.310 * GA3
14 16 18 20 22 24 26 28 GA weeks
GA – tydzień życia płodowego – 0 100 200 300 400 500 AB
AC= −427 + 417.4 * log(GA)
14 16 18 20 22 24 26 28 GA weeks
GA – tydzień życia płodowego – 0 50 100 150 200 250 AC
m m2
m m2
Fig. 5.Correlation box diagrams and osseous surface increase models (AB– bone, AC – cartilage areas)
Ryc. 5.Diagramy korelacyjne powierzchni i modele wzrostu (AB– kość, AC– chrząstka)
0% 50% 100% 150% 200% 250%
12 14 16 18 20 22 24 26 28 30
GA – weeks GA – tydzień życia płodowego
D1
/L
2
D1 0.91 GA L2 GA – 5.95
×
=
Fig. 6.Correlation diagram and change model of the scapular height−length coefficient with fetal age
Ryc. 6.Diagram korelacyjny i model współczynnika wysokościowo−długościowego łopatki z wiekiem płodu 0 20 40 60 80 100 120 140 160 180 200
12 14 16 18 20 22 24 26 28 30
GA – weeks GA – tydzień życia płodowego AC /( AB +A C ) A A + A
C B C
0.262 GA GA – 10.94
× ; R = 0.547 =
Fig. 7.Change in the proportion of cartilage area (AC) in total scapular area (AB+AC) with fetal age and the regression model.
Ryc. 7.Zmiana udziału pola powierzchni chrząstki (AC) w całkowitej powierzchni łopatki (AB+ AC)
invariability of scapular geometry during the whole life correspond with the papers by Alveders, Hertwig, and Rauber. On the basis of their material the authors observed that the scapu− la’s most intensive growth begins in the 28th week
of fetal life. Dilmen et al. [6] concentrated mainly on scapular length measurement with the use of ultrasound examination of 343 fetuses and they observed correlation between age and scapular size increase.
The authors concluded that in scapular bone morphometry, no difference connected with sex was found and symmetry as well as particular fea− tures of unstable growth rate were detected. The growth rate of the scapula’s linear sizes between the 17thand 25thweek is slower than in other ana−
lyzed periods of fetal life. The proportion of carti− lage surface in the scapula’s total surface decreas− es from 140% in the 14thto 60% in the 19thweek
and stays the same till the 28thweek.
References
[1] Alverdes K:Grundlagen der Anatomie. Thieme, Leipzig 1959.
[2] Andersen H:Histochemistry and development of the human shoulder and acromioclavicular joints with particu− lar reference to the early development of the clavicle. Acta Anat 1963, 55, 124–165.
[3] Ciardi−Dupre G:Modification in form of human scapula during ontogenesis. Boll Soc Ital Biol Sper 1942, 17, 348–349.
[4] Ciardi−Dupre G:Sullo sviluppo della scapola dell’uomo con riferimento alle modalita della inserzione laterale del m. omoioideo. Arch Ital Anat Embriol 1942, 47, 499–553.
[5] Dijkstra O:De ontwikkeling van het schouderblad bij den mensch.Verslag van de gewone vergaderingen der wis− en natuurkundige afdeeling. Kon Akad Wetensch Amsterdam 1923, 32, 321–332.
[6] Dilmen G, Öztürk T, Toppare MF, Seckin N, Öztürk M, Göksin E:Scapula length measurement for assess− ment of fetal growth and development. Ultrasound Med Biol 1995, 21, 2, 139–142.
[7] Drexler L:Über das Schulterblatt von Fetus und Neugeborenem. Acta Anat 1958, 33, 131–145.
[8] Elminger P:Die Frühentwicklung der Scapula beim Menschen. Acta Anat 1966, 65, 58–137.
[9] Fawcet E:A model of a shoulder girdle of 19mm embryo. J Anat Lond 1910, 44, 204–205.
[10] Frey H: Zur Entwicklung der menschlichen Unterzungenbeinmuskeln udn der ihnen verbundenen Skeletteile (Scapula, Thorax, Kehlkopf). Morph Jb 1919, 50, 501–516.
[11] Gardner E, Gray D:Prenatal development of human shoulder and acromioclavicular joints. Amer J Anat 1953, 92, 219–276.
[12] Hagen W:Die Bildung des Knorpelskelets beim menschlichen Embryo. Arch Anat Physiol Anat Abt 1900, 1–40.
[13] Hertwig O:Lehrbuch der Entwicklungsgeschichte des Menschen und der Wirbeltiere. Fischer, Jena 1906.
[14] http://www.scioncorp.com.
[15] http://www.gimp.org.
[16] Lewis W:The development of the arm in man. Amer J Anat 1901, 1, 144–184.
[17] Mal FP: On ossification centers in human embryos less than one hundred days old. Am J Anat 1906, 32, 433–458.
[18] Olivier G: Formation du squelette des membres. Vigot, Paris 1962.
[19] Rauber A:Lehrbuch der Anatomie des Menschen. Thieme, Leipzig 1902.
[20] Scammon RE, Calkins LA:The development and growth of external dimensions of the human body in the fetal period. The University of Minnesota Press, 1929, 367.
[21] Subkowitsch E:Zur Frage der Morphologie des Schulterguertels; I. Entwicklung und Morphologie des Processus coracoides bei Mensch und Fledermaus. Morph Jb 1931, 65, 517–538.
[22] Watała C:Biostatistics – the use of statistical methods in the biomedical sciences surveys. α−medica press, 2002.
Address for correspondence:
Alicja Kędzia
Department of Normal Anatomy Wroclaw Medical University Chałubińskiego 6a
50−368 Wrocław Poland
Tel.: +48 71 784 00 80
E−mail: [email protected]
Conflict of interest: None declared