IJPAR |Vol.6 | Issue 1 | Jan - Mar -2017 Journal Home page: www.ijpar.com
Research article Open Access
Development and validation of RP-HPLC method for the determination
of diphenamid in its formulations
R. Swathi
1, B. Ramachandra
2, M. Hanuman Nayak
1& N.Venkatasubba Naidu
1*
1
Department of Chemistry, S.V.University, Tirupati -517502, A.P, India.
2
Department of Chemistry Annamacharya Institute of Technology and Sciences, Tirupati-517520.A.P.,
India
*Corresponding Author: R. Swathi
Email: [email protected]
ABSTRACT
A simple, selective, precise and accurate High Performance Liquid Chromatographic method for the analysis of Diphenamid in its formulations was developed and validated in the present study. The mobile phase consist a mixture of 20mM Ammonium Phosphate (adjusted pH 3.0 with OPA) and Methanol in the proportion 60: 40 (v/v). This was found to give sharp peak of Diphenamid at a run time of 10 min. HPLC analysis of Diphenamid was carried out at a wave length of 250 nm with a flow rate of 1.0mL/ min. The linear regression analysis data for the calibration curve showed a good linear relationship with a regression coefficient 0.999 in the concentration range of 50% to 150%. The linear regression equation was y = 2159.x - 136.1. The developed method was employed with a high degree of precision and accuracy for the analysis of Diphenamid. The method was validated for accuracy, precision, robustness, ruggedness and specificity. The Precision, accuracy, sensitivity, short retention time and composition of the mobile phase indicated that this method is useful for the quantification of Diphenamid.
Keywords:
Diphenamid, HPLC Method Development and Validation.INTRODUCTION
Diphenamid is also known as N, N-Dimethyl-2, 2-diphenylacetamide, N,
N-Dimethyl-alpha-phenylbenzeneacetamide, and N,
N-Dimethyldiphenylacetamide [1]. Diphenamid is an amide type of herbicide used for the control of annual grasses and broadleaf weeds in peanuts, tobacco seedbeds, field tobacco, tomatoes and peppers, okra, irish potatoes, sweet potatoes,
cotton, soybeans, strawberries, blackberry and raspberry (nonbearing), apple and peach trees, orange, lime and cherry trees (nonbearing), pine seedbeds, dichondra, iceplant, bermudagrass lawns and other ornamental plants [2]. Diphenamid is used in the combination with DNBP [3] (4, 6-Dinitro-o-sec-butyl phenol) for usage on peanuts, potatoes and Soybeans [4] with very low toxicity if used at recommended concentrations [5]. Poisoning
ause’s anorexia, weight loss and posterior paresis [6]. Diphenamid is a pre-emergence surface-applied herbicide. Light rainfall or sprinkler irrigation following diphenamid application will improve its control of weeds. Under conditions of dry weather following application of Diphenamid, soil incorporation may increase the efficacy of the herbicide. Diphenamid may be applied immediately after seeding the crop or over top of transplant crops any time after transplanting but prior to weed emergence [7]. Diphenamid is used to control various Grass weeds such as Annual bluegrass, Goosegrass(Crowfootgrass), Annualsedge, Johnsongrass(fromseed),
Barnyardgrass(watercress), Ryegrass, Cheat, Sandbur(Sandspur), Crabgrass, Stinkgrass, Fall panicum (Panic grass), Wild Oat, Foxtail, Witchgrass (Ticklegrass), and Broadleaf Weeds such as Carpetweed, Mouseear chickweed, Corn spurry, Red sorrel, Sandwort, Spiny amaranth (Stickerweed), Knotgrass (German moss), Pigweed (Careless weed),etc.,.[8] Trade names of Diphenamid are DIF 4 , Difenamid, Dimid , Fenam, Diphenamide , Enide Dinitro EC-TUCO, Dymid [9].
Diphenamid is selective, systemic; absorbed through roots and Inhibits very long chain fatty acid (VLCFA) is a fatty acid with 22 or more carbons (inhibition of cell division). [10] The applicators of the herbicide and farm workers are the most likely people for exposure to diphenamid by inhalation and dermal routes. [11]
Gas chromatograph with a flame ionization cell and colorimetric procedure, [3] Determination of
Pesticides in Sediment Using Gas
Chromatography/Mass
Spectrometry,[12]Development of a Fast and Cost-Effective Multi-Residue Method to Determine Pesticides in Tobacco by LC/MS/MS, [13] Multiresidue Methods for Determination of Currently Used Pesticides in Fruits and Vegetables Using QuEChERS Technique, [14] Analysis of 118 Pesticides in Tobacco after Extraction With the Modified QuEChRS Method by LC –MS-MS, [15] and Multiresidue Method for Agricultural Chemicals by GC/MS, LC/MS(Agricultural Products) [16-18] was developed for the analysis of Diphenamid.
However, these methods require a great deal of trouble and most of these methods are complicated, tedious, used large amounts of solvent and time-consuming and costly. HPLC method of validation for Diphenamid has not been reported so far therefore, there is a need for better methods of analysis and hence this article describes the novel application of a modified QuEChERS method for Diphenamid determination in its formulations. The HPLC method described here is simple, sensitive, and reproducible for determination in formulations with low background interference. An attempt has been made to develop and validate to ensure their accuracy, precision and other analytical method validation parameters as mentioned in various gradients. For pesticide formulation the proposed method is suitable for their analysis with virtually no interference of the usual additives presented in pesticide formulations.
Structure
Diphenamid
Chemical name
N, N-Dimethyl-2, 2-diphenylacetamid
Molecular formula
Molecular Weight
239.318 g/mol
Instruments required
High performance liquid chromatography, with UV / PDA detector, HPLC Analytical column of RP - C18, 25mm x 4.6mm x 5µ , Analytical weighing balance - Mettler Toledo B204S
Millipore Nylon 0.2µm
Chemicals required
Diphenamid working Standard, Enide®50w,
Ammonium Phosphate, Orthophosphoric Acid Methanol – AR
Chromatographic conditions
The quantitative determination is carried out by HPLC system equipped with UV/VIS detector.
Column : RP - C18, 25mm x 4.6mm x 5µ
Mobile Phase : For isocratic system, prepare a mixture of 20mM Ammonium Phosphate (adjusted pH 3.0 with OPA) and Methanol in the proportion 60: 40 respectively. Mix well. Filter through 0.2 µ Nylon membrane filter paper and degas prior to use.
Wavelength : 250 nm
Flow Rate : 1.0 ml / minute
Injection volume: 20 μl
Run time : 10 minutes
Blank solution : Use Methanol as blank
Diluent : Use Methanol as diluent
Preparation of Diphenamid Standard Solution
Weigh accurately about 50mg of Diphenamid working Standard and transfer to a 50ml volumetric flask. Add 10 ml of diluent and sonicate to dissolve. Dilute to volume with diluent and mix. Transfer 1.0 ml of solution into a 10 ml of volumetric flask and dilute to volume with the diluent and mix.
Preparation of Test Solution
Weigh accurately about 100 mg of sample and transfer to a 50 ml volumetric flask. Add 10 ml of diluent and sonicate to dissolve. Dilute to volume with diluent and mix. Transfer 1.0 ml of solution into a 10 ml of volumetric flask and dilute to volume with the diluent and mix.
System Suitability Solution
Use Diphenamid Standard working solution as system suitability solution.
Procedure
Separately inject equal volumes of blank, five replicate injections of system suitability solution (Diphenamid Standard working solution). Then inject two injections of test solution and record the chromatograms. Disregard any peak due to blank in the test solution. Calculate % RSD of five replicate injections of system suitability solution (DiphenamidStandard working solution).
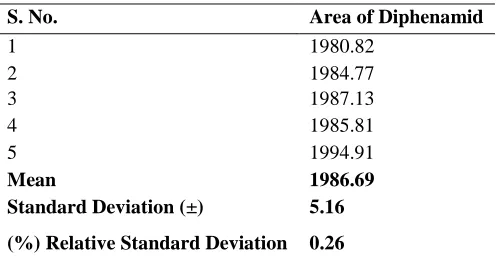
Table - 1: System suitability - Selectivity
S. No. Area of Diphenamid
1 1980.82
2 1984.77
3 1987.13
4 1985.81
5 1994.91
Mean 1986.69
Standard Deviation (±) 5.16
(%) Relative Standard Deviation 0.26
Tailing factor and theoretical plates of the peak in the chromatogram obtained with 5th injection of system suitability solution (Diphenamid Standard working solution).
The limits are as below,
1. Theoretical plates should be not less than 3000. 2. Tailing factor should be less than 2.0.
3. % RSD should be not more than 2.0%.
VALIDATION PARAMETERS
Specificity / Selectivity
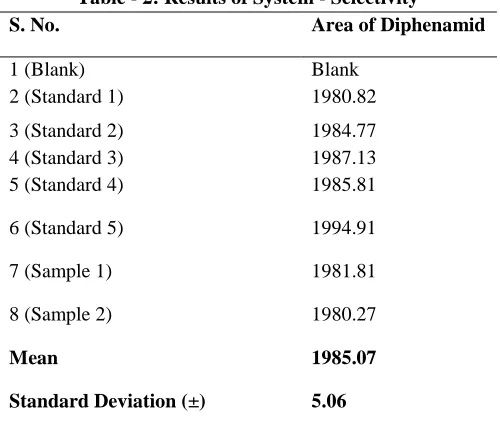
Table - 2: Results of System - Selectivity
S. No. Area of Diphenamid
1 (Blank) Blank
2 (Standard 1) 1980.82
3 (Standard 2) 1984.77
4 (Standard 3) 1987.13
5 (Standard 4) 1985.81
6 (Standard 5) 1994.91
7 (Sample 1) 1981.81
8 (Sample 2) 1980.27
Mean 1985.07
Standard Deviation (±) 5.06
(%) Relative Standard Deviation 0.25
Acceptance Criteria
The Diphenamid peak should be well resolved from any other peak and from each other. The diluent blank solution; excipient blend solution should not show any peak at the retention time of the Diphenamid.
Forced degradation
The forced degradation studies are performed to establish the stability indicating nature of the assay
Method and to observe any degraded compounds. Diphenamid working standard and Samples (Enide®50w) are subjected to stress with 5N HCl, 5N NaOH, Thermal degradation and UV degradation. The stress conditions are followed for degradation mentioned in table-3.
Table – 3: Conditions – Forced Degradation
Sample stress condition Description of stress condition
Acid degradation 5N HCl heated at about 60C for 10 min on a water bath.
Alkali degradation 5N NaOH heated at about 60C for 10 min on a water bath. Thermal degradation 105ºC for 12 hours in Hot-Air oven
UV degradation expose to UV-radiation for 7 days
All the above solutions are chromatographed and recorded the chromatograms and results recorded in tables 4 & 5.
Table – 4: System suitability – Forced Degradation
S. No. Area of Diphenamid
1 2384.11
2 2392.02
3 2397.68
4 2394.50
5 2386.31
Mean 2390.92
Standard Deviation (±) 5.64
Table - 5: Results - Forced Degradation
Acid Stress % Degradation
Standard 0.016
Sample 0.085
Alkali Stress % Degradation
Standard 0.090
Sample 0.031
Thermal Stress % Degradation
Standard 0.060
Sample 0.016
UV Stress % Degradation
Standard 0.006
Sample 0.008
Linearity
Linearity and Range for standard
For the linearity study five standard solutions of Diphenamid were prepared from the range starting from 50% to 150% of the theoretical concentration of assay preparation. The system suitability
solution and the linearity solutions were injected. The linearity graph of concentration against peak response was plotted and the correlation coefficient was determined. The system suitability linearity standard solutions were injected and results are mentioned in table - 6.
Table - 6: System suitability - Linearity of standard
S. No. Area of Diphenamid
1 2002.24
2 2016.80
3 2010.89
4 2004.19
5 2001.70
Mean 2007.16
Standard Deviation (±) 6.51
(%) Relative Standard Deviation 0.32
The average peak area of Diphenamid peak at each concentration level was determined and the linearity graph was plotted against the sample
concentration in percentage. The results of linearity study are as given in Table - 7.
Table - 7: Results of linearity of standard Linearity Level Sample
Concentration (in %)
Sample Concentration (in ppm)
Peak Area Correlation Coefficient
Level – 1 50 50 929.82 0.999
Level – 2 75 75 1504.03
Level – 3 100 100 2022.65
Linearity Level Sample Concentration (in %)
Sample Concentration (in ppm)
Peak Area Correlation Coefficient
Level – 1 50 50 929.82 0.999
Level – 5 150 150 3102.77
The linearity plot of peak area of Diphenamid Vs. standard concentration in percentage is presented in figure-1 and the correlation coefficient
was determined here correlation coefficient should be greater than or equal to 0.999.
Figure 1: Linearity graph of Diphenamid standard
Precision
System Precision
Procedure
The system precision was performed by injecting 10 replicate injections of system
suitability solution and the chromatograms are reviewed for the system suitability criteria and results are recorded in table – 8.
Table - 8: System precision
S. No. Area of Diphenamid
1 2068.58
2 2050.26
3 2033.83
4 2030.94
5 2064.59
6 2059.64
7 2051.78
8 2059.91
9 2143.72
929.82
1504.03
2022.65
2556.07
3102.77 y = 2159.2x - 136.11
R² = 0.9998
0 1000 2000 3000 4000
0% 20% 40% 60% 80% 100% 120% 140% 160%
10 2065.77
Mean 2062.90
Standard Deviation (±) 31.17
(%) Relative Standard Deviation
1.51
Acceptance Criteria
% RSD of peak areas of ten replicate injections of system suitability solution should not be more than 2.0% and system suitability criteria should pass as per analytical method.
Method Precision
Six test solutions of Diphenamid in Enide®50w and were prepared as per the analytical method. The % RSD of % assay of six test solutions was calculated. The results of assay obtained from six test solutions preparations are presented in Tables - 9 & 10.
Table - 9: System suitability - Method precision
Analyst – 1 HPLC No.: EH/R&D/HPLC-024
S. No. Area of Diphenamid
1 2155.11
2 2143.95
3 2152.79
4 2140.79
5 2160.57
Mean 2150.64
Standard Deviation (±) 8.14
(%) Relative Standard Deviation 0.38
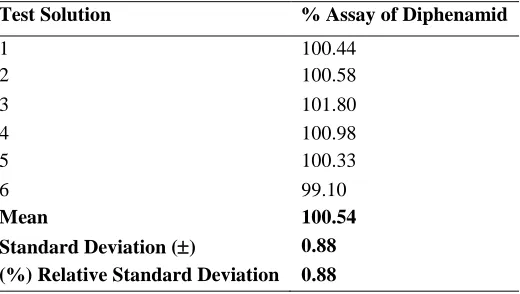
Table - 10: Results of Method precision
Test Solution % Assay of Diphenamid
1 100.44
2 100.58
3 101.80
4 100.98
5 100.33
6 99.10
Mean 100.54
Standard Deviation () 0.88
(%) Relative Standard Deviation 0.88
Intermediate Precision
Six test solutions of Enide®50w were prepared as per the analytical method on different day. These test solutions were analyzed by a different analyst using different HPLC column of same make but
Table - 11: System suitability - Intermediate precision
Analyst – 2 HPLC No.: EH/R&D/HPLC-023
S. No. Area of Diphenamid
1 2094.76
2 2103.52
3 2118.09
4 2116.57
5 2125.93
Mean 2111.77
Standard Deviation (±) 12.46
(%) Relative Standard Deviation
0.59
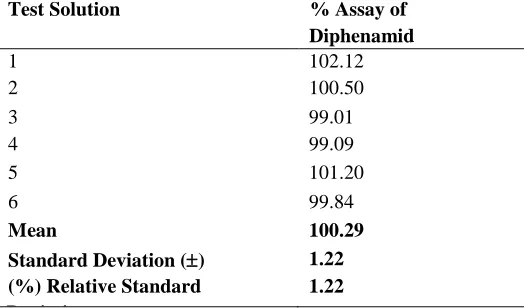
Table - 12: Results of Intermediate precision
Test Solution % Assay of
Diphenamid
1 102.12
2 100.50
3 99.01
4 99.09
5 101.20
6 99.84
Mean 100.29
Standard Deviation () 1.22
(%) Relative Standard Deviation
1.22
Table - 13: Results of twelve test solutions of Diphenamid in Enide®50w (six of Method precision & six of intermediate precision)
Analysis performed during Method precision study By Analyst 1 on system 1 and on column 1 on day 1
Same column % Assay of Diphenamid
1 100.44
2 100.58
3 101.80
4 100.98
5 100.33
6 99.10
Analysis performed during intermediate precision study By Analyst 2 on system 2 and on column 2 on day 2
Column S. No. 015337030136 01
Test Solution % Assay of Diphenamid
8 100.50
9 99.01
10 99.09
11 101.20
12 99.84
Mean of twelve samples 100.42
Standard Deviation () 1.03
(%) Relative Standard Deviation 1.02
Robustness
Prepare two test solutions of the same lot of Diphenamid in Enide®50was per analytical Method. Inject this solution along with diluent blank solution and system suitability solution along different chromatographic conditions as shown below:
Change in column lot (same make, different serial no.)
Change in flow rate ( 0.2 ml/minute)
Change in wavelength (± 2 nm)
Change in composition of mobile phase (± 20ml)
Change in Column Lot
Normal Experimental Condition: RP - C18,
25mm x 4.6mm x 5µ)
The system suitability criteria were found to meet the pre-established acceptance criteria as per the analytical method. Results recorded in Table - 14 for system suitability.
Table - 14: System suitability - Robustness with Change in Column Lot
S. No. Area of Diphenamid
Same column
Diff column
1 2168.52 2028.26
2 2164.87 2056.21
Mean 2166.70 2042.24
Standard Deviation (±) 2.58 19.76
(%) Relative Standard Deviation
0.12 0.97
The assay results obtained with different flow rate conditions are as given in Table - 15.
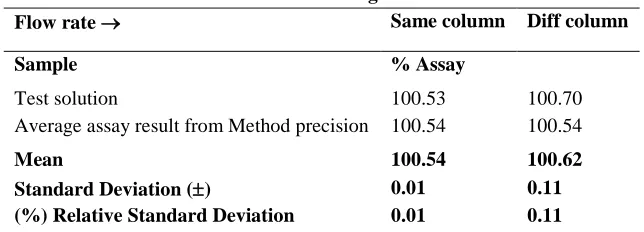
Table - 15: Results for Change in Column Lot
Flow rate Same column Diff column
Sample % Assay
Test solution 100.53 100.70
Average assay result from Method precision 100.54 100.54
Mean 100.54 100.62
Standard Deviation () 0.01 0.11
Change in Flow Rate (
0.2 mL/minute)
(Normal
Experimental
Condition:
1.0ml/minute)
The system suitability criteria were found to meet the pre-established acceptance criteria as per the analytical method. Results are recorded in table - 16 for system suitability.
Table - 16: System suitability - Robustness with change in flow rate
S. No. Area of Diphenamid
0.8mL/minute 1.2 mL/minute
1 2050.26 2230.74
2 2035.16 2234.09
Mean 2042.71 2232.42
Standard Deviation (±) 10.68 2.37
(%) Relative Standard Deviation 0.52 0.11
The assay results obtained with different flow rate conditions are as given in Table- 17.
Table - 17: Results for change in flow rate
Flow rate 0.8mL/minute 1.2 mL/minute
Sample % Assay
Test solution 99.13 98.50
Average assay result from Method precision 100.54 100.54
Mean 99.84 99.52
Standard Deviation () 1.00 1.44
(%) Relative Standard Deviation 1.00 1.45
Change in Wavelength (± 2 nm)
Normal Experimental Condition: 250nm. The system suitability criteria were found to meet the
pre-established acceptance criteria as per the analytical method. Refer to Table - 18 for system suitability results.
Table - 18: System suitability - Robustness with change in wavelength
S. No. Area of Diphenamid
248 nm 252 nm
1 2076.90 2035.16
2 2084.37 2045.82
Mean 2080.64 2040.49
Standard Deviation () 5.28 7.54
(%) Relative Standard Deviation 0.25 0.37
Table - 19: Results for change in wavelength
Wavelength 248 nm 252 nm
Sample % Assay
Test solution 99.33 101.02
Average assay result from Method precision 100.54 100.54
Mean 99.94 100.78
Standard Deviation () 0.86 0.34
(%) Relative Standard Deviation 0.86 0.34
Change in composition of Mobile Phase (±
20ml)
Normal Experimental Condition: Buffer; Methanol = 60:40. The system suitability criteria
were found to meet the pre-established acceptance criteria as per the analytical method. Results recorded in table-20 for system suitability.
Table - 20: System suitability - Robustness with change in composition of mobile phase
S. No. Area of Diphenamid
58B:42M 62B:38M
1 2306.35 2369.49
2 2315.42 2368.20
Mean 2310.89 2368.85
Standard Deviation () 6.41 0.91
(%) Relative Standard Deviation 0.28 0.04
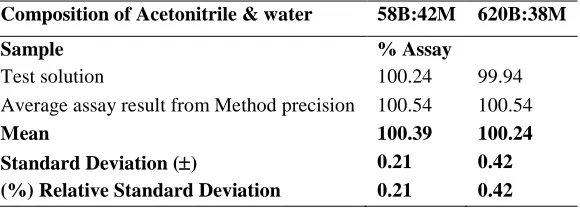
The assay results obtained with change in composition of mobile phase are as given in table-21.
Table - 21: Results for change in composition of mobile phase
Composition of Acetonitrile & water 58B:42M 620B:38M
Sample % Assay
Test solution 100.24 99.94
Average assay result from Method precision 100.54 100.54
Mean 100.39 100.24
Standard Deviation () 0.21 0.42
(%) Relative Standard Deviation 0.21 0.42
Stability of Analytical Solution
System suitability solution and test solution of Diphenamid Enide®50w were prepared on 0th, 12th, 24th, 36th and 48th hour of experiment and stored these solutions at room temperature for every time interval up to 48 hrs and analyzed these solutions
on 48 hrs with freshly prepared test solution. The system suitability solution was prepared freshly at the time of analysis. The assay of Enide®50w in the sample was calculated.
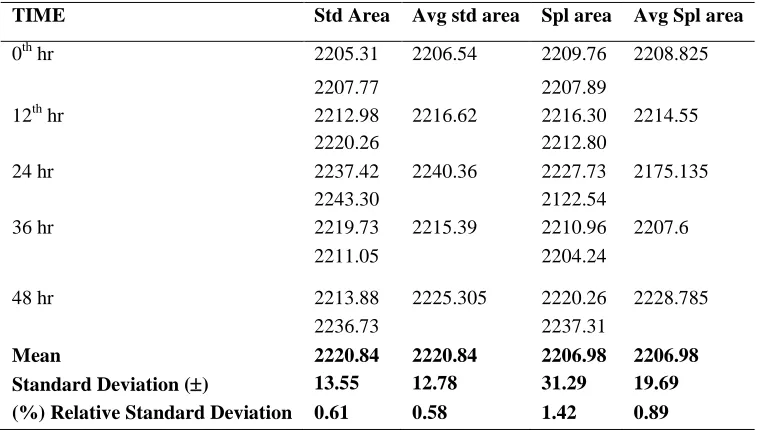
Table - 22: Results of Analytical solution Stability
TIME Std Area Avg std area Spl area Avg Spl area
0th hr 2205.31 2206.54 2209.76 2208.825
2207.77 2207.89
12th hr 2212.98 2216.62 2216.30 2214.55
2220.26 2212.80
24 hr 2237.42 2240.36 2227.73 2175.135
2243.30 2122.54
36 hr 2219.73 2215.39 2210.96 2207.6
2211.05 2204.24
48 hr 2213.88 2225.305 2220.26 2228.785
2236.73 2237.31
Mean 2220.84 2220.84 2206.98 2206.98
Standard Deviation () 13.55 12.78 31.29 19.69
(%) Relative Standard Deviation 0.61 0.58 1.42 0.89
Table - 23: Results for solution stability
% Assay results calculated against the freshly prepared system suitability standard
Sample % Assay of Diphenamid
0th hr 100.40
12th hr 100.20
24 hr 97.37
36 hr 99.94
48 hr 100.45
Mean 99.67
Standard Deviation () 1.30
(%) Relative Standard Deviation 1.31
RESULTS AND DISCUSSION
System selectivity
All the injections were processed at the wavelength provided in the Method. There was no interference observed from diluents blank solution, excipients blend solution with Diphenamid peak. The system suitability criteria were found to meet the pre-established acceptance criteria as per the analytical Method. Hence this Method is selective.
Forced degradation
There is no interference between the peaks obtained for the chromatograms of degradation preparations. The degradation peaks under forced degradation are well separated from each other. The peak purity for Diphenamid peak is passing. Hence, the Method is very precise, selective and
specific to the estimation of Assay of Diphenamid in Enide®50w by HPLC and the same Method is stability indicating, as the degraded products are well separated from Diphenamid and as well from each adjacent peaks.
Linearity
Linearity graph of the average area at each level against the concentration in v/v% is plotted and is found to be a straight line graph. The correlation coefficient is found to be more than 0.999.Hence it is concluded that the Method is found to be linear in the range of 50% to 150% of the working concentration.
Precision
different analysts using two different equipment’s within the same laboratory using two different columns of the same make but having different serial numbers on two different days. The % RSD of the twelve assay results which six of method precision and six from intermediate precision is found to be less than 2.0%. Thus, the method is found to be rugged and precise.
System precision=% RSD= 1.51
Method precision=% RSD=0.88
Intermediate precision=% RSD=1.22
Robustness
The analysis of the same lot of Enide®50w was carried out at different conditions of column lot, flow rate, wavelength, and change in composition of mobile phase. The % RSD between results obtained with changed condition and average result of method precision is not more than 2.0%.The analytical method meets the pre-established acceptance criteria for robustness study. Thus, the method is robust.
Stability of Analytical solution
The % RSD between assay results obtained for freshly prepared test solution and the stored test
solutions is less than 2.0%. There is no significant change in assay level observed up to 48 hours for test solution at room temperature. The system suitability was found to meet the pre-established criteria and it can be concluded that the solution is stable up to 48 hours at room temperature.
SUMMARY AND CONCLUSION
The above summary and the validation data summarized in this paper shows that the analytical method of assay of Diphenamid in Enide®50w by HPLC is found to be suitable, selective, specific, precise, linear, accurate and robust. The analytical solution is found to be stable up to 48 hours at room temperature.
Hence, it is concluded that the analytical method is validated and can be used for routine analysis and for stability study.
Acknowledgements
The author thanks to Analog labs Hyderabad, India and Department of Chemistry,Sri Venkateswara University, Tirupati, India for providing laboratory facilities.
REFERENCE
[1]. http//:scorecard.goodguide.com/chemical-profiles/pesticides.tcl?edf_substance_id=957-51-7
[2]. Farm Chemicals Handbook, 70th ed. 1984. R. T. Meister, G. L.Berg, C. Sine, S. Meister, and J. Poplyk, eds. Meister Publishing Co., Willoughby, OH.
[3]. Analytical methods for Pesticides, Plant growth regulators, and Food additives. Edited by Gunter Zweig. Life Sciences Division, Syracuse University Research Corporation, Syracuse, New York.
[4]. Thomson, W.T. 1981. Agricultural chemicals - book 2: herbicides. Revised ed. Thomson Publications, Fresno, CA. 274 pp.
[5]. http://medical-dictionary.thefreedictionary.com/diphenamid [6]. http://medical-dictionary.thefreedictionary.com/diphenamid
[7]. Weed Science Society of America, Herbicide Handbook Committee.1983. Herbicide handbook of the weed science society of America, 5th ed. Weed Science Society of America, Champaign, IL. 515 pp.
[8]. http://pmep.cce.cornell.edu/profiles/herb-growthreg/dalaponethephon/diphenamid/herb-prof-diphenamid.html [9]. http://www.pesticideinfo.org/Detail_Chemical.jsp?Rec_Id=PC33314
[10].http://sitem.herts.ac.uk/aeru/iupac/Reports/255.htm [11].http://www.speclab.com/compound/c957517.htm
[12].Michelle L. Hladik and Megan M. McWayne. Methods of Analysis-Determination of Pesticides in Sediment Using Gas Chromatography/Mass Spectrometry. U.S. Geological Survey, Reston, Virginia: 2012, https://pubs.usgs.gov/tm/tm5c3/pdf/tm5-C3.pdf
[14].Marek Biziuk and Jolanta Stocka. Multiresidue Methods for Determination of Currently Used Pesticides in Fruits and Vegetables Using QuEChERS Technique. International Journal of Environmental Science and Development, 6(1), 2015.
[15].Fei Yang1, Zhaoyang Bian1,2*, Xiaoshui Chen1, Sansan Liu1, Yang Liu1 and Gangling Tang1.Analysis of 118 Pesticides in Tobacco after Extraction With the Modified QuEChRS Method by LC –MS-MS. Journal of Chromatographic Science Advance Access published 25, 2013.
[16].http://www.mhlw.go.jp/english/topics/foodsafety/positivelist060228/dl/060526-1a.pdf [17].Mitsunori Murayama et al., J. Food Hyg. Soc. Japan, 32, 1991, 155-160.
[18].Food Hygiene Inspection Guidelines (for Veterinary Drugs and Feed Additives), edited by the Ministry of Health, Labour and Welfare, 2003, 26-43, Japan Food Hygiene Association.