UHF and X Band Electro-Magnetic Shielding of
Advanced Devices by Some Polymer–Composites
K R SAHU
1and UDAyAn DE
2*
1Physics Department, Egra S. S. B. College, Egra, Purba Medinipur, West Bengal 721429, India. 2Calcutta Institute of Engineering & Management, 24/1A Chandi Ghosh Road, Tollygunge,
Kolkata 700040, India. http://dx.doi.org/10.13005/msri/130204
(Received: December 14, 2016; Accepted: December 17, 2016)
ABStRACt
Electro-magnetic interference (EMI) affects delicate electronic devices and living beings. Composites of a polymeric binder with fine metallic turnings (copper and brass), powders of conducting inorganic compounds (suitably fired cadmium oxide), ferroelectric powders (BaTiO3
and orthorhombic PbNb2O6), and with their combinations have been prepared as cloth-like sheets, and characterized in a Vector Network Analyzer (VNA) with respect to EMI shielding and reflection capabilities. Input power (Pin) for the EMI shield (above-mentioned test materials), the reflected power
(Prefl) and the transmitted power (Pout) have been measured by the VNA as a function of EM wave frequency in two technically important frequency bands - in 700 MHz to 3 GHz part of the ultra-high frequency (UHF) band and in the X-band, covering 8 to 12 GHz. From the measured data, Shielding Effectiveness in dB unit = 10 log (Pout / Pin) and Reflection Effectiveness in dB = 10 log (Prefl / Pin) have been calculated and studied for all the samples, with the results presented and discussed. In particular, our substitution of expensive metal powders by fine metallic turnings, available as waste from mechanical workshops, reduces the cost of polymer-metal composites substantially, retaining high shielding i.e. low transmission (down to -33dB in 08 to 12 GHz range).
Keywords: EMI Shielding, Polymeric composites, intelligent materials, UHF waves, X-band.
IntRoDUCtIon
In recent years, an explosive growth in use of electrical and electronic devices in industrial, commercial, R & D and home applications has resulted in many-fold increase of generation of electromagnetic waves and, hence, of unwanted electromagnetic interference (EMI) to other devices. Strong EMI certainly has a negative effect, also, on human brain and health1-5 . So, shielding is needed,
firstly to prevent unwanted emission of EM waves from some equipment. Secondly, one needs to shield sensitive instruments from EMI so that their performance and life are not compromised. EMI shielding by reflection from metals or materials that
possess conducting electrons, is a widely known phenomenon. Metal sheets are the original or 1st
generation materials for shielding EMI. But gap-free EMI shielding can be done better and much more readily with a polymer-based flexible EMI shield, the 2nd generation shielding material. Metallic shields are
stiffer and heavier than a possible cloth-like shield made from a polymeric composite6-13. Present trend
while practical EMI shielding must extend to GHz frequency bands. So, shielding of EMI by magnetic materials will not be considered further in this work.
International Telecommunications Union (ITU) defined ITU Radio Bands like ultra-high frequency (UHF) band covering electromagnetic waves (EM) between 300 MHz and 3 GHz frequency range that corresponds to a wavelength range from 100 mm to 1 meter. UHF waves propagate mainly by line of sight, being blocked by hills and large buildings but penetrating building walls to allow indoor reception. UHF EM waves are used for television broadcasting, cordless phones, walkie-talkies, satellite communication, and many other applications. EM or Radio waves in 3 GHz to 30 GHz frequency range fall into the super-high frequency (SHF) range or microwave frequency range. Waves in SHF range are conveniently referred to by their IEEE radar band designations: S, C, X, Ku, K, or Ka bands, or by similar designations. These are widely used in civil and military radar communications (like weather monitoring, air traffic control, maritime traffic control, defence tracking and speed detection for cars, satellite communications, deep space telecommunications, amateur radio, motion detectors etc). Preset EMI Shielding work is for UHF band and X band EM waves.
Electronic conducting polymers have often been rightly used in polymeric EMI shielding materials. However, these conducting polymers are almost always solids and without any binding capability. Since the other additives that can be used either for enhancing reflection or for inducing absorption, are also solids, one must further add a binder or glue to cast the shielding composite into a sheet. So, it was decided to try composites of a polymeric binder (PB) with either newer absorbing agents (ferroelectric or paraelectric14,15 materials)
or newer reflecting agents (oxides16,17 or metallic
systems) or their mixtures. As detailed in next section, Transmittance = T = Pout / Pin= |S12|2 and
Reflectance = R = Prefl / Pin= |S11|2 for electromagnetic
waves have been measured by a vector network analyzer (VNA) as a function of EM wave frequency in UHF and X band for the above-mentioned polymer composites, developed for this work.
MAtERIAlS AnD MEtHoDS
Materials Selection
Following solids have been selected to form polymer-solid composites for shielding:
Absorbing agents
(a) BaTiO3 powder (a ferroelectric material with e= 2500 to 3000 & dielectric loss, tan d, < 0.01518
and exhibiting Tc (Curie Temperature) ~ 132°C with good piezoelectric properties e.g. piezoelectric constant, d33= 788 pC/N 19, 20), and (b) orthorhombic
PbNb2O6 (the ferroelectric phase, with e= 115 to 150 and tand = 0.00845 to 0.1127 and exhibiting Tc > 570°C piezoelectric properties 15, 21).
Reflecting agents
(a) fine brass and copper turnings (fibers), found as waste in machining workshops, and (b) CdO_800 and CdO_270, cadmium oxide turned fairly conducting by innovative firing 16, 17 at 800°C
and 270°C, as well as CdO_RT (dried cadmium oxide without any high temperature firing) as reference. Mixed materials
Kaynak et al 22 achieved maximum shielding
efficiency of 40 dB at 1 GHz using composites of polypyrrole, a conducting polymer. It appears that EMI shielding has not been studied earlier with our composites. Our choice of barium titanate and or lead metaniobate as the shielding partner in the present work is based on the expectation that inorganic materials like these dielectric and piezoelectric substances can absorb incident EM waves efficiently to cut down transmission. Our observation of low electrical resistance in 800°C fired16,17 cadmium oxide, making it conducting, has
Material Preparations and Characterization Batio3
Single phase barium titanate, BaTiO3 (to be abbreviated as BT) samples have been prepared from BaCO3 and TiO2 powders using solid state reaction, by few firings at ~ 1300°C for a total time of 12 hours. It has been characterized by X-ray diffraction (XRD) as a tetragonal phase with structural parameters, a = 3.9943 Å, b = 3.9943 Å, c = 4.0307 Å, a = b = g = 90°C. Transmission electron microscope (TEM), measured d = 3.9947 Å for (100) plane (in Figure 1a and 1b), matching d = 3.9949 Å, calculated by Rietveld XRD analysis (Figure 1d). Differential Scanning Calorimetry (DSC), gave ferroelectric to paraelectric phase transition temperature (Tc) at 124.3°C, agreeing with 120°C< Tc<130 °C for different grain sizes in different experiments23. All the results have been shown in
Figure 1, our positron lifetime spectroscopy being recorded in14.
Pbnb2o6
Lead Metaniobate, PbNb2O6, samples have been prepared from PbO and Nb2O5 powders
Fig. 1: DSC signal of Batio3 sample shows ferroelectric to para-electric transition at 124.3°C. Insets (a) and (b) are HRtEM view of its microstructure, while (c) is the electron
diffraction pattern for (100) planes, shown in (b). XRD for this Batio3 sample is shown in
(d). XRD value of d = 3.9949 Å for the (100) planes, giving peak at 22.048°C) in Figure 1(d), matches well with d = 3.9947Å from tEM
diffraction pattern.
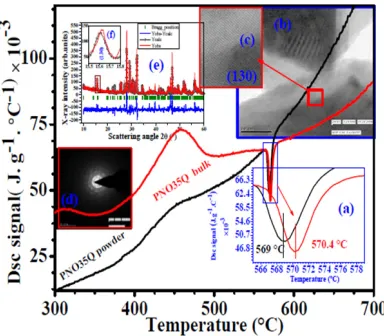
Figure 2 DSC signal of Pn35Q sample, in Figure 2(a), shows ferroelectric to ferroelectric
transition at 569°C (for the powdered sample, indicated by continuous black line) and at 570.4°C (for the bulk sample, indicated by continuous red line). Insets (b), (c) and (d) are
HRtEM results for one of the observed sets of planes - (130) planes to be specific. XRD pattern is shown insets (e) and (f). Here,
d = 5.663 Å, measured from XRD for the (130) planes that gave the x-ray peak at 15.636°C and d = 5.637 Å, measured from tEM
diffraction pattern, match fairly well using solid state reaction, by firing at three stages: 1050°C for 3.5 hours, 1290°C for 1 hour and 1270°C for 5 hours in a box furnace with PID (Proportional-Integral-Derivative) temperature controller. After the last firing, the sample has been quenched from 1270°C to room temperature within a few minutes to get the orthorhombic lead metaniobate (to be abbreviated as PN). The structure has been orthorhombic with structural parameters a = 17.6705 Å, b = 17.9841 Å, c = 3.8764 Å, a = b = g = 90°C, identified using XRD (in Figure 2e). TEM techniques, measured d = 5.637 Å for (130) planes (Figure 2b and 2c), matching d = 5.663 Å, calculated by Rietveld analysis (Figure 2e and 2f) of our XRD data. Figure 2 shows ferroelectric properties as found by DSC15, 24-25, giving ferroelectric to paraelectric
Fired Cdo
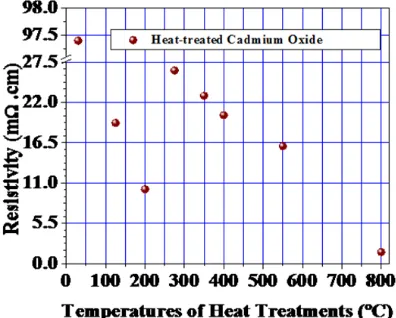
As-supplied cadmium oxide (E Merch, India) has been heat treated in air in a Carbolite furnace for 36 hours at 270°C followed by cooling set at 800°C/h rate, resulting in, CdO_270. CdO_800 samples have been similarly prepared by 800°C firing. The as-supplied sample, to be called CdO_RT, has been dried at ~ 75°C and used. 4-probe electrical measurement shows (Figure 3) large improvement of electrical conductivity on firing as-supplied cadmium oxide at high temperatures presumably due to oxygen loss17.
Brass and Copper turnings composites
The fine brass and copper turnings were cleaned and sieved, in order to select only those which pass through 1mm x 1mm area. The polymeric binder for the composites is a sealant, commercially available as a thick liquid inside its tube. Overnight curing in air of the binder or the binder-powder composite resulted in rubber-like sheets of controllable thicknesses and sizes. In this way, composites were prepared from the above ingredients mixed in various proportions. Each composition was mixed homogeneously and allowed to cure overnight into flexible sheets. Each sheet was cut into a rectangular shape or into an annular ring of such sizes as to meet the rectangular wave guide (for X-band) or coaxial holder (for UHF-band) requirements of the vector network analyzer. Coaxial
Fig. 3: Variation of room temperature electrical resistivity of heat treated cadmium oxide with firing temperature. low resistivity of 800°C
fired “Cdo” may be noted
Fig. 4: Figure 4(i) shows our Annular Samples for 700MHz to 3GHz EMI shielding
measurements with the Vector Analyzer. Figure 4(ii) shows variation of shielding effectiveness of the pure polymeric binder (a),
and of polymeric composites: (b) with 800°C fired Cdo, one layer (Cdo_800 33I sample), (c) with Batio3 (Bt31 sample), (d) with Cdo & Batio3 (Cdo_800 Bt 34 sample), (e) with Cdo_800, 2 layers (Cdo_800 33II sample), (f) with Cdo_800, 3 layers (Cdo_800 33III sample),
in the frequency range 700MHz to 3GHz. More detailed sample description has been given in
the text and table 1
holder samples have been photographed and shown in Figure 4(i) before presenting the results in Figure 4(ii).
Electromagnetic Shielding Measurement Input power (Pin) for an EMI shield (the test material), the reflected power (Prefl) and the transmitted power (Pout) can be measured by a vector network analyzer (VNA) as a function of EM wave frequency. The 2-port network parameters S12 = S21 (for transmission) and S11 (for reflection) are related to transmittance and reflectance:
T = Transmittance = Pout / Pin = |S12|2 and
R = Reflectance = Prefl / Pin = |S11|2. If R = reflected
shielding. Since Shielding Effectiveness, as defined above, is a negative quantity, many authors18, 26-27
define: Shielding Efficiency = - 10 log (Pout / Pin) in dB = 10 log (Pin/Pout) in dB, which has higher positive value (larger Pin/Pout) for materials that shield more. Similarly, 10 log (Prefl / Pin) in dB = Reflection Effectiveness = RE, is a negative quantity, with - 10
log (Prefl / Pin) in dB = Shielding Efficiency arising from reflection only. However, the terminology in certain treatise is often different from what we present here. One must take note of such differences to avoid confusion. Absorbed power = Pin - Pout - Prefl can be estimated easily. A coat of a Radar absorbing Material or RAM on a military aircraft must absorb most or almost all of any searching radar beam incident on an aircraft, if the aircraft wants to evade radar detection.
As already indicated, EMI shielding can be due to either reflection of EM waves or absorption or both, ignoring the minor effect of internal reflections. Total SE or Shielding Effectiveness can be expressed as a sum:
SE = SEtotal = SEreflection + SEabsorption
Fig. 5: Variation, in the range 0.7 to 3GHz, of EMI shielding effectiveness in transmittance mode of polymeric composite with Batio3 (Bt
31 sample), with 800°C fired Cdo (Cdo_800 33 sample) and with a mixture of the two (Cdo_800 Bt 34 sample), adapted from22.
Fig. 6: Variation with frequency, over the range 0.7 to 3GHz, of shielding effectiveness (linked to S12 and shown by broken line joining
half-filled symbols) and reflection effectiveness (linked to S11 and shown by continuous line joining fully-filled symbols) of different polymer-Pn samples. Compositions (PB:Pn) of differently named polymer-Pn samples are
indicated in table 1
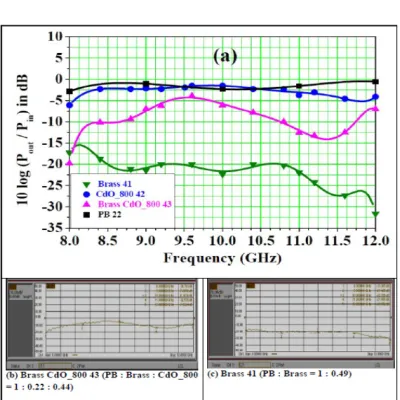
Fig. 7: (a) Shielding effectiveness in 8 to 12 GHz range for pure Polymeric Binder (square
symbol & graph), its composite with brass (down triangle & graph), its composite with
Cdo_800 (circle symbol & graph) and its composite with brass & Cdo_800 (up triangle
symbol & graph). the data points (different symbols) indicate values directly printed by
the Vector network Analyser. VnA machine gives results also as graphs, (b) and (c). our continuous graphs are from polynomial fits to representative points read from the graphs (b)
Fig. 8: Reflection effectiveness, 10 log (Prefl / Pin), in 8 to 12 GHz frequency range, of polymer composites with brass turnings
(Brass 41), with brass turnings & Cdo_800 (Brass Cdo_800 43), and with Cdo_800 only (Cdo_800 42). All solid symbols are machine data collected from VnA instrument and the matching solid lines indicate the polynomial fits to the data sets. Moreover, linear fits to these polynomials are given by corresponding
open symbols
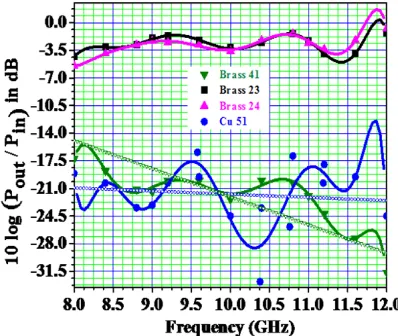
Fig. 9: Shielding effectiveness in 8 to 12 GHz range of X-band for three polymer-brass composites and one copper composite, with
table 2 giving composition and thickness against sample name. Experimentally measured data points have been shown by
solid symbols and the polynomials fits by continuous lines of same colors. Moreover,
average value of shielding effectiveness is found for Brass 41 and Cu 51 samples by the straight line fits to the corresponding polynomials and indicated in the figure by hollow triangles (in olive color) and hollow
circles (in blue color) All shielding measurements were done
using a Vector Network Analyser E8364B supplied by Agilent Technologies mainly over 8 to 12 GHz (X-band) and also at a lower frequency range of 700 MHz to 3 GHz (part of ultra high frequency (UHF) band). Rectangular wave guide system is used in the 8 to 12 GHz (X-band) run, while the 700 MHz to 3 GHz measurement is based on coaxial holder. Presently used VNA gives the variations of 10 log (Pout / Pin), related to S12, and 10 log (Prefl / Pin), related to S11, with frequency graphically, with digital data for selected representative points only. So, polynomial fit to these data points and additional points read from the graph has been done to get a digital representation of the machine output over the full range of frequency. In later figures showing shielding and reflection results, solid line graphs of the fitted polynomials together with machine supplied plus read data points have been presented. A straight line approximation of the polynomial fit is presented in some cases.
RESUltS AnD DISCUSSIon
Six representative graphical result sheets of the Vector Network Analyser have been presented in Figure 4, Figure 4(ii) to be precise. Each sheet shows, in different colors, 10 log (Pout / Pin) in dB = Shielding Effectiveness arising from transmission and depending upon reflection and absorption, and 10 log (Prefl / Pin) in dB = Reflection Effectiveness. Figure 5 (adapted from27) shows Shielding Effectiveness,
Fig. 10: Shielding effectiveness, 10 log (Pout/ Pin), in 8 to 12 GHz X-band range for polymer-Bt composite in 1:0.314 composition samples
of different thicknesses, 6.0 mm (for Bt 26), 4.5 mm (for Bt 27A) & 2.5 mm (Bt 27) as detailed in table 3. Experimentally measured data has been shown by solid symbols. Solid line indicates polynomial fit to the data and the dashed straight lines (- -) are the average value of shielding effectiveness (as obtained
by linear fits to the polynomials).
Fig. 11: Reflection effectiveness in X-band of three polymer-Bt samples, Bt 26, Bt 27, Bt 27A as detailed in table 3. Experimentally
measured data have been shown by solid symbols. Solid lines are polynomial fits to the data and dashed lines (- -) indicate the average
value line (as obtained by a linier fit).
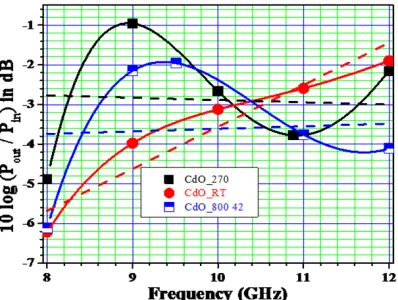
Fig. 12: Experimentally measured shielding effectiveness (SEt) of three samples, Cdo_270,
Cdo_Rt, and Cdo_800 42 in the X-band frequency range are shown by solid rectangles
in black color, solid circles in red color and half solid rectangles in blue color, respectively.
Solid lines indicate the polynomial fits to the data and dashed lines (- -) indicate the average
value lines (linier fits) of SEt values.
Fig. 13: Experimentally measured reflection effectiveness in X-band of three samples,
Cdo_270, Cdo_Rt, and Cdo_800 42 as detailed in table 2, indicates by solid rectangles in black color, solid circles in red color and half solid rectangles in blue color respectively. Solid line indicates the polynomials fit data and dashes line (- -) indicates the average value line (linier fit), separated into two sectors. 1st sector is 8 to 10.4032 GHz and 2nd sector is 10.4032 to
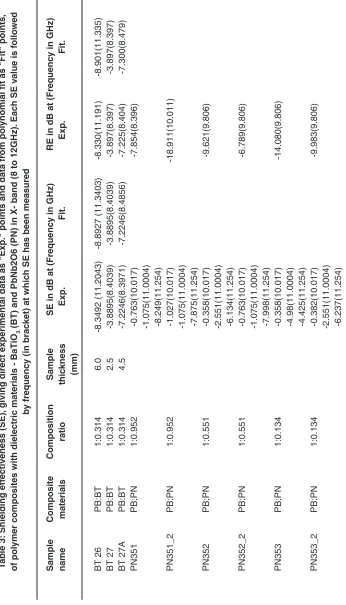
Shielding Effectiveness, 10 log (Pout / Pin), arising from reflection and absorption, and Reflection Effectiveness, 10 log (Prefl / Pin), have been shown in Figure 6, as a function of frequency in the range 700 MHz to 3 GHz for composite samples of PB and PN with different wt. ratio and different thickness
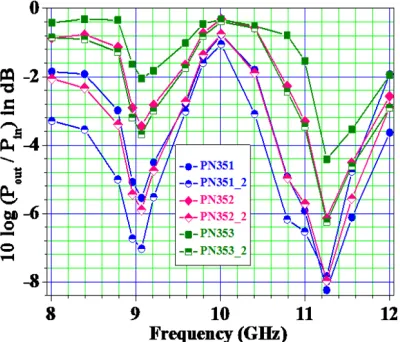
Fig. 14: Experimental data for reflection effectiveness (SER) of polymer-Pbnb2o6 composites of different compositions and thickness (as detailed in table 3) in 8 to 12 GHz
X-band range. Points of a graph have been joined by straight line segments as a guide to
the eye.
Fig. 15: EMI shielding effectiveness, 10 log (Pout/ Pin), in 8 to 12 GHz X-band range, of polymer- Pbnb2o6 composites of different compositions and thickness as detailed in table 3. Points of a graph have been joined by
straight line segments as a guide to the eye.
Fig. 16: Shielding effectiveness in X-band of polymer-Cdo_800 composite with 1:1.447
composition in sample Cdo_800 42 and polymer-(Cdo_800+Bt) composites with 1:0.207:0.205 = 1:0.2:0.2 composition in sample Cdo_800 Bt 32 & 1:0.371:0.185 = 1:0.4:0.2 composition in sample Cdo_800 Bt
34. Experimentally measured data has been shown by solid symbols identified by sample names. Solid lines indicate the polynomial fit
to the data.
Fig. 17: Reflection effectiveness in X band of polymer-Cdo_800 composite with 1:1.447
composition in sample Cdo_800 42 and polymer-(Cdo_800+Bt) composites with 1:0.207:0.205 = 1:0.2:0.2 composition in sample Cdo_800 Bt 32 & 1:0.371:0.185 = 1:0.4:0.2 composition in sample Cdo_800 Bt 34. Experimentally measured data have been shown by symbols mentioning sample names.
Solid lines are polynomial fits to the data. Adding 19 wt.% of CdO_800 to the polymeric binder, shifts the reflection minimum to a lower frequency of 1.28 GHz and creates a second reflection minimum at 2.20 GHz. In PB-BT composite with 43.4 wt.% BT (say BT 31 sample), however,
the reflection minimum shifts to a lower frequency of 1.16 GHz. So, the two additives, CdO_800 and BT, affect EMI shielding oppositely. Result for the composite PB +CdO_800+BT (1:0.37:0.185 by wt., say CdO_800 BT 34 sample), sample (d), is shown in Figure 4, while in PB+BT+CdO_800 (1:0.207:0.205 by wt., called CdO_800 BT 32 sample), not shown in the figure, the reflection minimum is at ~1.40 GHz. Thickness dependence of EM reflection has been studied here by EMI shielding measurement on stacks of 2 and 3 layers of the sample pieces (each with ~ 2.5 mm thickness), and the dependence is similar in all samples. It is shown in Figure 4 for PB+19.4 wt.% of CdO_800 material (CdO_800 33 II sample, for example) for 2-layered sample (e) and 3-layered sample (f). There is more reflection in samples (e) and (f) than in the single-layered sample (b).
Measurement of EMI shielding over 8 to 12 GHz range for the metallic composite, PB:metal (brass) = 1:0.4854 (say Brass 41 sample), shows very low transmission (Figure 7) i.e. high EMI shielding, and rather large reflection (Figure 8). Shielding effectiveness values can be seen from the figures. So, this polymeric composite of fine brass turnings imitate the efficient shielding property of metal (brass) sheet quite well. However, the cadmium oxide composite PB:CdO_800 = 1:1.447 (say CdO_800 42) does not reflect (Tables 2-4) the
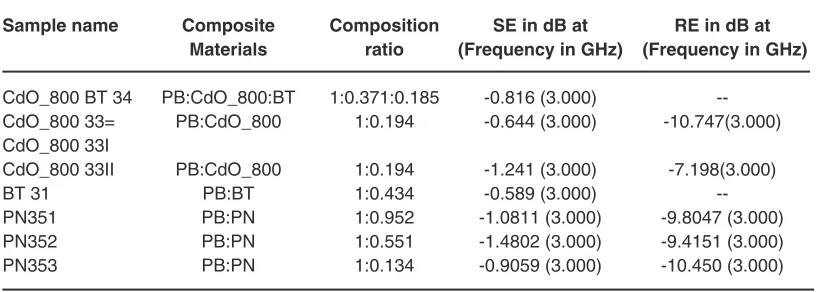
table 1: SE = Shielding effectiveness = 10 log (Pout / Pin), related to S12, and RE = Reflection Effectiveness = 10 log (Prefl / Pin), related to S11, in the UHF band (0.7 to 3GHz), of some polymer composites involving cadmium oxide (Cdo), barium titanate (Batio3 = Bt) and lead metaniobate (Pbnb2o6 = Pn). these data are directly printed by the Vector network Analyzer,
and designated here as “Experimental” result.
Sample name Composite Composition SE in dB at RE in dB at
Materials ratio (Frequency in GHz) (Frequency in GHz)
CdO_800 BT 34 PB:CdO_800:BT 1:0.371:0.185 -0.816 (3.000) --CdO_800 33= PB:CdO_800 1:0.194 -0.644 (3.000) -10.747(3.000) CdO_800 33I
CdO_800 33II PB:CdO_800 1:0.194 -1.241 (3.000) -7.198(3.000)
BT 31 PB:BT 1:0.434 -0.589 (3.000)
--PN351 PB:PN 1:0.952 -1.0811 (3.000) -9.8047 (3.000)
PN352 PB:PN 1:0.551 -1.4802 (3.000) -9.4151 (3.000)
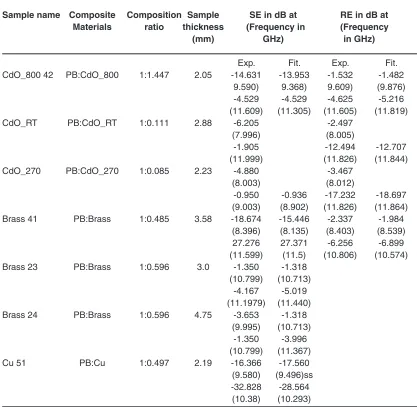
table 2. Shielding effectiveness (SE), giving direct experimental data as “Exp.” points and data from polynomial fit as “Fit” points, of polymer composites with conducting materials - fired cadmium oxide (Cdo_firng temperature), Brass and Copper (Cu) in X band (8 to 12GHz). Each SE
value is followed by frequency (in bracket) at which SE has been measured.
Sample name Composite Composition Sample SE in dB at RE in dB at
Materials ratio thickness (Frequency in (Frequency
(mm) GHz) in GHz)
Exp. Fit. Exp. Fit.
CdO_800 42 PB:CdO_800 1:1.447 2.05 -14.631 -13.953 -1.532 -1.482 9.590) 9.368) 9.609) (9.876) -4.529 -4.529 -4.625 -5.216 (11.609) (11.305) (11.605) (11.819)
CdO_RT PB:CdO_RT 1:0.111 2.88 -6.205 -2.497
(7.996) (8.005)
-1.905 -12.494 -12.707 (11.999) (11.826) (11.844)
CdO_270 PB:CdO_270 1:0.085 2.23 -4.880 -3.467
(8.003) (8.012)
-0.950 -0.936 -17.232 -18.697 (9.003) (8.902) (11.826) (11.864) Brass 41 PB:Brass 1:0.485 3.58 -18.674 -15.446 -2.337 -1.984
(8.396) (8.135) (8.403) (8.539) 27.276 27.371 -6.256 -6.899 (11.599) (11.5) (10.806) (10.574) Brass 23 PB:Brass 1:0.596 3.0 -1.350 -1.318
(10.799) (10.713) -4.167 -5.019 (11.1979) (11.440) Brass 24 PB:Brass 1:0.596 4.75 -3.653 -1.318
(9.995) (10.713) -1.350 -3.996 (10.799) (11.367) Cu 51 PB:Cu 1:0.497 2.19 -16.366 -17.560 (9.580) (9.496)ss -32.828 -28.564
(10.38) (10.293)
EM waves significantly (Figure 8) in spite of the high electrical conductivity (Figure 3) of CdO_800. Figure 7 shows the variation of Shielding Effectiveness for different composites samples (Brass 41, CdO_800 42, Brass CdO_800 43 and PB22). Pure brass composite sample offers better EMI shielding in X band than other samples like pure CdO_800 composite or brass with CdO_800 composites. Brass 41 samples let only 1.78 to 0.056% EM wave transmissions where as Brass CdO_800 43 sample
gives 1.0 to 31.6% and CdO_800 42 sample 56.2% EM wave have been transmitted of the incident EM waves in X-band regions.
tab
le 3:
Shielding eff
ectiveness (SE),
giving direct e
xperimental data as "Exp." points and data fr
om pol
ynomial fit as "Fit" points,
of pol
ymer composites with dielectric materials - Ba
t
io3
(B
t
) and Pb
n
b2
o
6 (P
n
) in X- band (8 to 12GHz).
Eac
h SE v
alue is f
ollo
wed
by frequenc
y (in brac
ket) at whic
h SE has been measured
Sample
Composite
Composition
Sample
SE in dB at (Frequenc
y in GHz)
RE in dB at (Frequenc
y in GHz)
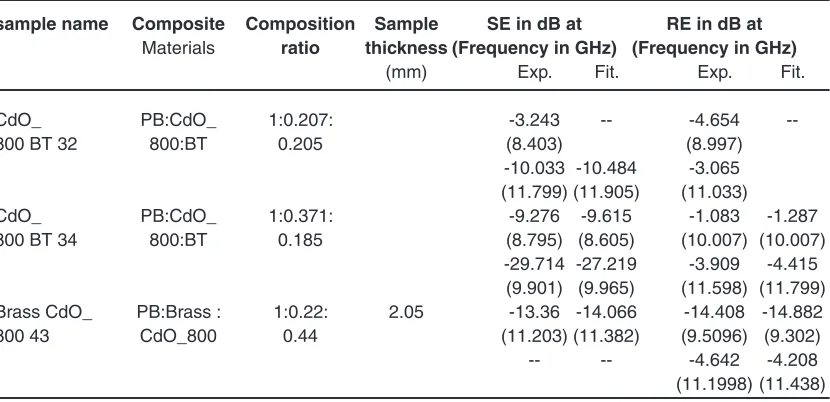
table 4: Shielding effectiveness in the X band frequency range, giving direct experimental data as “Exp.” points and data from polynomial fit as “Fit” points,
of a few composites of the polymeric binder and two additives.
sample name Composite Composition Sample SE in dB at RE in dB at Materials ratio thickness(Frequency in GHz) (Frequency in GHz)
(mm) Exp. Fit. Exp. Fit.
CdO_ PB:CdO_ 1:0.207: -3.243 -- -4.654
--800 BT 32 800:BT 0.205 (8.403) (8.997)
-10.033 -10.484 -3.065 (11.799) (11.905) (11.033)
CdO_ PB:CdO_ 1:0.371: -9.276 -9.615 -1.083 -1.287
800 BT 34 800:BT 0.185 (8.795) (8.605) (10.007) (10.007)
-29.714 -27.219 -3.909 -4.415 (9.901) (9.965) (11.598) (11.799) Brass CdO_ PB:Brass : 1:0.22: 2.05 -13.36 -14.066 -14.408 -14.882
800 43 CdO_800 0.44 (11.203) (11.382) (9.5096) (9.302)
-- -- -4.642 -4.208 (11.1998) (11.438) GHz) in X-band. When we added conducting powder
(CdO_800 (44% wt. ratio) for example), to the brass (22%) composite sample, it reflected ~ 34% of EM wave energy on average (~ 54% at 8 GHz to ~ 23.9% at 12 GHz). But pure CdO_800 (44.7%) composite reflected only ~ 12.8% of the EM wave energy on average (~ 5.5% at 8 GHz to ~ 33% at 12 GHz). Addition of CdO_800 powder with brass composite polymer, Brass CdO_800 43 sample, gives deep reflection peak, less wide than Brass 41 sample and shifting the position towards lower frequency (~ 10.5737GHz (~ 20.4%) to ~ 9.600 GHz (~ 9.9%)). For pure CdO_800 polymer composite this peak shows more width than Brass CdO_800 43 sample and shifted towards lower frequency at ~ 9.2984 GHz (~ 3.2%). The shielding effectiveness (SE) of two types of polymeric composites, one set with brass and another set with copper (Cu) will now be presented for different composition ratios (by wt.) and for different thicknesses. For example, we have Brass 41 (~ 48.5% brass with thickness = ~ 3.58 mm), Brass 23 (~ 59.6% brass with thickness = ~ 3.00 mm), Brass 24 (~ 59.6% brass with thickness = ~ 4.75 mm). The Cu-polymer composite Cu 51 has ~ 49.7% Cu with thickness = ~ 2.19 mm, studied in X band range in Figure 9. Brass 23, Brass 24 and Brass 41 samples are formed by same composite materials but with different composition ratio. Brass 41 sample transmitted only ~ 0.19% of EM wave
BT 27A (~ 31.4% BaTiO3 with thickness = ~ 4.5 mm, giving average reflection of ~ 29%, in X band range, as shown in Figure 11. Here, we observe that the reflected energy decreased with increasing the thickness of samples. i.e., absorption power increased with increasing the thickness of samples.
The Reflection Effectiveness (RE) of CdO composite polymers with different thickness, different composition ratio, and different firing temperature, are presented in three sheets: for example, CdO_800 42 (~ 144.7% CdO_800 with thickness = ~ 2.05 mm), CdO_270 (~ 8.5% CdO_270 with thickness = ~ 2.23 mm), CdO_RT (~ 11.1% CdO_RT with thickness = ~ 2.88 mm), as shown in Figure 12. Here we observe that CdO_RT sample shields the incident wave better than other two samples (CdO_800 42, CdO_270) only in the frequency ranges “8 to ~ 9.76 GHz”, and in “~11 to 12 GHz” range CdO_800 42 sample prevents better transmission through the sample of the incident EM waves, due to its high conductivity. The RE of three CdO composite polymers, CdO_800 42, CdO_270, and CdO_RT in the X band range, has been shown in Figure 13. The frequency range has been change into two sectors on the basis of RE property of the measured samples. We observe that in the lower frequency sector (8 to ~10.4 GHz) CdO_RT sample reflected better (on average ~ 33.6%) the incident EM waves than other two samples (CdO_270 with average RE = 19.8% and CdO_800 42 with average RE = 8.7%). But in the 2nd sector (~10.4 to 11.8 GHz) CdO_800 42 sample
reflected better (on average ~ 21% ) the incident EM waves than other two samples (CdO_RT with average RE = 16.6% and CdO_270 with average RE = 5.2%).
The RE (in X band range) of six PN composite samples, PN351 (~ 95.2% PN and single layer), PN351_2 (double layers of PN351 sample), PN352 (~ 55.1% PN and single layer), PN352_2 (double layers of PN352 sample), PN353 (~ 13.4% PN and single layer) and PN353_2 (double layers of PN353 sample) has been shown in Figure 14. Here, we observe that the reflected fraction of EM wave energy increases with the increase of the thickness of the sample. For examples, PN351 sample reflects ~ 44.5% of the incident EM waves, whereas PN351_2
sample reflects ~59.6%. Similarly, PN352 sample reflects ~ 20.2% of the incident EM waves, whereas PN351_2 sample reflects ~ 49.1%. Also, PN353 sample reflects ~ 4.5% of the incident EM waves, whereas PN353_2 sample reflects ~ 21.9% at ~ 8.8 GHz. It is also observed that the reflection increases as the fraction of the active component is increased. SE in X band range of the six PN composite samples, PN351, PN351_2, PN352, PN352_2, PN353 and PN353_2 has been shown in Figure 15. We observe that the transmitted fraction decreases with increase of the fraction of active component and the thickness of the sample. For examples, PN351 sample transmits ~ 15% of the incident EM waves, whereas PN351_2 sample transmits ~16.4%. Also PN352 sample transmits ~ 24.3% of the incident EM waves, whereas PN352_2 sample transmits ~15.9%. Similarly, PN353 sample transmits ~ 36.4%, whereas PN353_2 sample transmits ~23.7%, at ~ 11.2629 GHz. In lower frequency range (at ~ 9.07 GHz, PN351 sample transmits~ 27.9% of the incident EM waves, whereas PN351_2 sample transmits ~19.8%. PN352 sample transmits ~ 45.3% of the incident EM waves, whereas PN352_2 sample transmits ~25.7%. Finally, we note that PN353 sample transmits ~ 62.3% of the incident EM waves, whereas PN353_2 sample transmits ~ 42.9%.
SE in X band range of three samples, one with only CdO_800 (CdO_800 42 sample with 144.7% CdO_800) and another two mixed composites (conducting powder, CdO_800, and dielectric powder, BaTiO3 (BT), mixed with polymeric binder in different ratios) - CdO_800 BT 32 (20.7% CdO_800 and 20.5% BT), and CdO_800 BT 34 (37.1%, CdO_800 and 18.5%, BT) - has been shown in Figure 16. It shows that the CdO_800 BT 32 sample shields the EM waves better than other two samples in the range 8 to 11GHz. But 11 to 12 GHz range finds CdO_800 42 sample shielding the EM waves better than other two samples (CdO_800 BT 34 and CdO_800 BT 32). The RE in X the band range of three samples, one with only CdO_800, and two mixed composite samples - CdO_800 BT 32 and CdO_800 BT 34 - has been shown in Figure 17.
to 12 GHz range finds CdO_800 42 sample reflecting the EM waves better than other two samples. At 9.9046 GHz frequency CdO_800 34 sample reflects only 0.11% of the incident wave energy and transmitted ~ 74.4% (from Figure 16). Same figure shows that CdO_800 42 sample and CdO_800 32 sample reflect ~ 5.7% (transmitted ~71%, Figure 16) and ~ 32.5% (transmitting ~ 48.5%, Figure 16), respectively. CdO_800 34 sample (absorbing 25.5%) has better absorption power than CdO_800 42 (23.3% absorbed) and CdO_800 32 (19.1% absorbed).
Even without optimization, some metal turnings composites show negligibly low transmission (~ -16 to ~ -34dB in 08 to 12 GHz range) 7. A
polymeric composite of a conducting oxide shows a deep reflection minimum of about -30 dB (at 9.71 GHz) 7, important for Radar Absorption Materials
or RAM. The width of this minimum (9 to 10.5 GHz) could be increased by adding a third component.
ConClUSIonS
EMI shielding effectiveness and efficiency of some composite polymers, prepared using the conducting oxide power, CdO_800, non-conducting oxide powers, CdO_270 and CdO_RT, high dielectric constant (HDC) ferroelectric powder BaTiO3, medium (value) dielectric constant, MDC, ferroelectric powder PbNb2O6, metallic turnings of brass and copper from workshop waste, have been measured in UHF and X-band. In UHF band, BT (HDC), PN (MDC) and CdO_800 (conducting) based polymeric composites with single or multiple active materials, totaling seven samples, absorption and reflection power is very low - implying low shielding. Out of these seven poor shielding samples, PN352 shields best (transmitting ~ 71.1% at 3 GHz, compared to ~ 87.32% transmission for BT31. For conductive composites (CdO_800), reflection part increases (~ 10.64%) and absorption part remains practically unchanged (only ~ 0.43% change), on increasing thickness (CdO_800 33 sample, single to double layer change), to show reflection to be the dominating mechanism. For dielectric composites (PN35), on the other hand, reflection part changes little (~ 2.42% change only) and absorption part
increases significantly (~ 7.46%), on increasing dielectric powder (PN) wt.% from 13.4 to 55.1. Transmission is much less in X- band than in UHF band implying better EMI shielding. For example, PN352 sample transmits 24.4% for single layer and ~ 15.7% for double layer at 11.256 GHz (X-band), whereas it has ~ 71.1% transmission at 3 GHz (UHF band). Also, absorption increases from ~ 17.5% (at 3 GHz, UHF) to ~ 26.2% (at 11.256 GHz, X-band). PN samples shield better than BT or BT_CdO samples in low frequency range (700 MHz to 3 GHz). Copper composite polymer samples act as better shielding materials (~ 0.05% transmitted at 10.3822 GHz) than brass composite polymer sample (1.01% transmitted at 10.3822 GHz), in 8 to ~ 10.83 GHz range. But, brass composite polymer sample shows better shielding (0.18% transmission at 11.600 GHz) performance than Cu composite polymer sample (1.12% at 11.600 GHz) above ~ 10.83 GHz - up to the highest frequency studied here (12 GHz). Low transmission i.e. good EMI shielding by these workshop waste materials (copper and brass turnings) has been possible by our fabrication of cloth-like polymeric composites with these materials, opening up a lower cost substitute for the widely used metal sheets and wire-meshes. The fabrication needs to be further perfected for optimum EMI shielding. Since the shielding mechanism for such composites is complex and not fully known, one has to depend more on experimentally found shielding data than on theoretical estimates, and also improve theory from extensive experimental data. Present EMI shielding measurements is a step in this direction.
EM emission is higher in high energy density devices so that above considerations of electromagnetic interference and shielding are more important for high energy materials. Applications involving intelligent materials are sensitive devices that are likely to be significantly affected by EM waves coming from the environment, needing protection by EM shielding.
ACKnowlEDGMEntS
REFEREnCES
1. Akbaba M. and Gokdeniz M., Turkish Journal of Occupational /Environmental Medicine and Safety, 1, 1 (2015).
2. Lewicka M., Henrykowska G. A., Pacholski K., Szczêsny A. Buczyñska M. D., and Buczyñski A., Advances in Clinical and Experimental Medicine, 24, 31 (2015).
3. Ajiboye Y., Farai P., Ayinmode B. O., and Alao O. A., IOSR Journal of Applied Physics, 6, 40 (2014).
4. Rifai A. B., and Hakami M. A., Journal of Biosciences and Medicines, 2, 1 (2014). 5. Dhami A. K., International Journal of
Environmental Research, 9, 977 (2015). 6. Joo J., and Epstein A. J., Applied Physics
Letters, 65, 2278 (1994).
7. Datta Gupta N., Sahu K. R., and De U.,: Flexible EMI shielding-preparation and testing. 150th Birth Anniversary of Achararya
J.C. Bose, International Symposium on Micrometer and Millimeter waves: Basics and Technology, January-2009, Bose Institute, Kolkata-700009, India, http://bic.boseinst. ernet.in/seminar/workshop/isomm2008. 8. Kumar K. K. S., Geetha S., and Trivedi D. C.,
Current Applied Physics, 5, 603 (2005). 9. Abbas S. M., Dixit A. K., Chatterjee R., and
Goel T.C., Materials Science and Engineering: B, 123, 167 (2005).
10. Hakansson E., Amiet A., and Kaynaka A., Synthetic Metals, 156, 917 (2006).
11. Hakansson E., Amiet A., Nahavandi S., and Kaynak A., European Polymer Journal, 43, 205 (2007).
12. De U., Sahu K. R., and Dutta Gupta N.,: Coating and Flexible Materials for Radar Absorption and EMI Shield. The 8th Int. Conf.
on Advanced Polymers via Macromolecular Engineering 2009, Dresden, Germany, http://
www.ipfdd.de/APME-2009.
13. Liang J., Wang Y., Huang Y., Ma Y., Liu Z., Cai J., Zhang C., Gao H., and Chen Y., carbon, 47, 922 (2009).
14. De U., Chaudhuri S. K., Sahu K. R., Das D., Dutta Gupta N.,and Chakraborty K. R., Physica Status Solidi C, 6, 2513 (2009). 15. De U., Sahu K. R., Chakraborty K. R., and
Pratihar S. K., Integrated Ferroelectrics, 119, 96 (2010).
16. Verma K. C., and De U., Indian Journal of Physics, 79, 1975 (2005).
17. Choi J. S., Kang Y. H., and Kim K. H., Journal of Physical Chemestry, 81, 2208 (1977). 18. Celozzi S., Araneo R., and lovat G., John
Wiley & Sons, Inc., Hoboken, New Jersey, 2008.
19. Wada S., Yamato K., Pulpan P., Kumada N., Lee B. Y., Iijima T., Moriyoshi C., and Kuroiwa Y., Journal of Applied Physics, 108, 094114-1 (2010).
20. Wada S., Takeda K., Muraishi T., Kakemoto H., Tsurumi T., and Kimura T., Japanese Journal of Applied Physics, 46, 7039 (2007). 21. Sahu K. R., and De U., Journal of Materials,
2013, 1 (2013).
22. Kaynak A., Materials Research Bulletin, 31, 845 (1996).
23. Mao Y., Mao S., Ye Z. G., Xie Z., and Zheng L., Materials Chemistry and Physics, 124, 1232 (2010).
24. Sahu K. R., and De U., Thermochimica Acta, 490, 75 (2009).
25. Sahu K. R., and De U., Thermochimica Acta, 589, 25-30 (2014).
26. Dhawan S. K., Singh N., and Venkatachalam S., Synthetic Metals, 129, 261 (2002). 27. Datta Gupta N., Sahu K. R., Das I., De A., and