S. Lakshmi Prabha
et al
, International Journal of Computer Science and Mobile Applications,
Vol.3 Issue. 9, September- 2015, pg. 1-8
ISSN: 2321-8363
Performance of Classification Algorithms on
Students’ Data – A Comparative Study
S. Lakshmi Prabha1, Dr. A.R.Mohamed Shanavas2
1 Ph.D Research Scholar, Bharathidasan University & Associate professor, Department of Computer Science,
Seethalakshmi Ramaswami College,Tiruchirappalli, Tamilnadu, India, [email protected]
2
Associate professor, Department of Computer Science, Jamal Mohamed College, Tiruchirappalli, Tamilnadu,
India, [email protected]
Abstract
Educational Data Mining (EDM) is an emerging research area, in which data mining techniques are applied for exploring data in educational systems. Its goal is to better understand how students learn and identify the settings in which they learn to improve educational outcomes. This paper compares the performance of classification algorithms NaiveBayes, Multilayer perceptron, ZeroR, J48 and Random Forest. The data set used for this purpose is taken from an e-learning tool used by the students of sixth standard and presents the results achieved with WEKA tool.
Keywords
EDM, NaiveBayes, Multilayer perceptron, ZeroR, J48, Random Forest, WEKA
1.
Introduction
Data Mining is an effective tool to extract meaningful and interesting patterns from the current and historical data stored in data warehouses or data repositories which may be analyzed to predict future trends. The data mining in the field of educational research is known as Educational Data Mining (EDM). It is concerned with developing methods for exploring the unique types of data that come from educational settings, and using those methods to better understand students, and the settings which they learn in [1]. There are varieties of popular data mining tasks within the educational data mining e.g. classification, clustering, outlier detection, association rule, prediction etc. EDM methods can be used in educational system for: predicting drop-out student, relationship between the student examination results & their success, predicting student's academic performance, discovery of strongly related subjects in the school syllabi, knowledge discovery on academic achievement, classification of students' performance in all courses according to learning style.
EDM often tries to simulate a student models which may be used for the improvement of students by predicting the future trends [11]. This paper compares the methods of classification through an example data taken from an e-learning platform. This paper is organised as follows: Section 2 lists the related works in this area. Section 3 describes briefly about classification methods used. Section 4 describes about dataset and methodology used. Results and discussions are given in Section 5 and Section 6 concludes the work.
S. Lakshmi Prabha
et al
, International Journal of Computer Science and Mobile Applications,
Vol.3 Issue. 9, September- 2015, pg. 1-8
ISSN: 2321-8363
The paper [2] Dorina Kabakchieva applied classification algorithms Decision Tree, Neural Network and K-Nearest Neighbour and identified that Neural Network predicts with higher accuracy.
In paper [3] the authors identified the students with low AGPA using neuro-fuzzy inference systems and the experimented results showed 97% accuracy.
In this paper [4], students’ performance is evaluated using association rule mining algorithm.
Paper [5] presents a classification model based on decision tree approach to predict student’s academic performance.
Paper [6] used k-means clustering to analyze students’ learning behaviour. Class quizzes, final exams and assignments are considered for the study. This study helped to identify the dropout ratio and improve the performance.
The authors [7] V. Ramesh et al investigated the accuracy of Naïve Bayes Simple, Multilayer Perception, SMO, J48, REP Tree techniques for predicting student performance.
In paper [8] the authors used Bayes classification to predict the students; results on the basis of previous year database.
The author in paper [9] used association rule mining and the analysis revealed that the students’ university performance is dependent on unit test mark, assignment, attendance, and graduation percentage.
3.
Classification Methods
Classification is a data mining task that maps the data into predefined groups & classes. It is also called
as supervised learning . It consists of two steps:
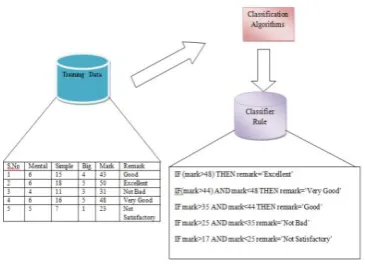
a. Model construction: It consists of set of predetermined classes. Each tuple /sample is assumed to belong to a predefined class. The set of tuple used for model construction is training set. The model is represented as
classification rules, decision trees, or mathematical formulae. This model is shown in figure 1.
Figure 1. Model Construction
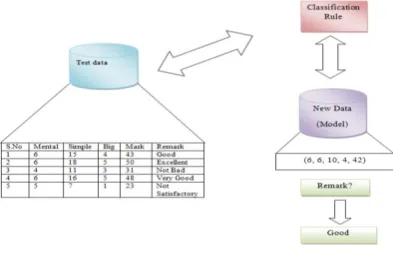
b. Model usage: This model is used for classifying future or unknown objects. The known label of test sample is compared with the classified result from the model. Accuracy rate is the percentage of test set samples that are
correctly classified by the model. Test set is independent of training set, otherwise over-fitting will occur. This
S. Lakshmi Prabha
et al
, International Journal of Computer Science and Mobile Applications,
Vol.3 Issue. 9, September- 2015, pg. 1-8
ISSN: 2321-8363
Figure 2. Model Usage (Classification)
The following paragraph briefs about five classification methods taken for this study.
3.1 NaiveBayes
The Naive Bayes algorithm is a classification algorithm based on Bayes rule, that assumes the attributes X1 ...Xn are all conditionally independent of one another, given Y. The value of this assumption is that it dramatically simplifies the representation of P(X|Y), and the problem of estimating it from the training data.
3.2 Multilayer Perceptron
A multilayer perceptron (MLP) is a feed forward artificial neural network model that maps sets of input data onto a set of appropriate output. An MLP consists of multiple layers of nodes in a directed graph, with each layer fully connected to the next one. Their current output depends only on the current input instance. It trains using back propagation [10].
3.3 ZeroR
ZeroR is the simplest classification method which relies on the target and ignores all predictors. ZeroR classifier simply predicts the majority category (class). Although there is no predictability power in ZeroR, it is useful for determining a baseline performance as a benchmark for other classification methods.
3.4 J48
The decision tree uses divide and conquer approach. An attribute is tested at each node and branches made till leaf nodes are reached. The decision tree is generated using J48 algorithm [13] which is a java version of the C4.5. J48 employs two pruning methods. The first is known as subtree replacement. Here some subtrees are selected and replaced by single leaves. The second type of pruning used in J48 is termed subtree raising. In this case, a node may be moved upwards towards the root of the tree, replacing other nodes along the way.
3.5 Random Forest
Random forests are a combination of tree predictors such that each tree depends on the values of a random vector sampled independently and with the same distribution for all trees in the forest. A random forest [14] is a classifier consisting of a collection of tree structured classifiers {h(x,Ok ), k=1, ...} where the {Ok} are independent identically distributed random vectors and each tree casts a unit vote for the most popular class at input x.
4.
Methodology
S. Lakshmi Prabha
et al
, International Journal of Computer Science and Mobile Applications,
Vol.3 Issue. 9, September- 2015, pg. 1-8
ISSN: 2321-8363
number of hints used, time spent in solving test problems, login and logout time. This makes the data big and EDM tools are required for analysis.
Here we consider the log of 120 sixth grade students from MATHSTUTOR [12] who attended the test module of lesson1 and solved 20 problems. There are 2400 (120*20) records and 16 attributes in test log. The Students are solving three kinds of problems namely Mental Problem, Simple Problem and Big Problem. According to their performance in these tests the mark is evaluated and remark attribute is assigned with Excellent/Very good/ Good/ Not bad/ Not satisfactory. The data pre-processing is carried out to convert the remark into grades A/B/C/D/E. Also added attributes example problems viewed, exercise problems solved, and hints used while solving exercise problems.
For the purposes of this study, we select WEKA (Waikato Environment for Knowledge Analysis) software that was developed at the University of Waikato in New Zealand. WEKA is open source software issued under the GNU General Public License. It contains tools for data pre-processing, classification, regression, clustering, association rules, and visualization. Process of selecting the relevant attributes are done through Chisquare and Infogain attribute evaluator methods.
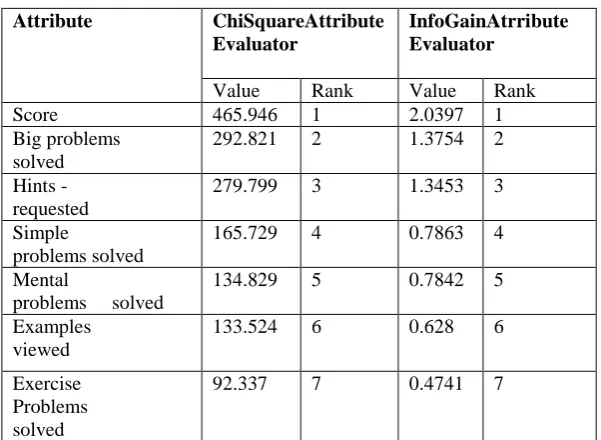
Table 1. Shows attributes ranked through ChiSquare AttributeEvaluator and InfoGain AtrributeEvaluator. Both methods ranked the important attributes in the same way. So we considered the selected attributes for classification process. Grade is the class label used for this study.
Table 1. Ranked Attributes
Attribute ChiSquareAttribute Evaluator
InfoGainAtrribute Evaluator
Value Rank Value Rank
Score 465.946 1 2.0397 1
Big problems solved
292.821 2 1.3754 2
Hints - requested
279.799 3 1.3453 3
Simple
problems solved
165.729 4 0.7863 4
Mental
problems solved
134.829 5 0.7842 5
Examples viewed
133.524 6 0.628 6
Exercise Problems solved
92.337 7 0.4741 7
5.
Results And Discussions
S. Lakshmi Prabha
et al
, International Journal of Computer Science and Mobile Applications,
Vol.3 Issue. 9, September- 2015, pg. 1-8
ISSN: 2321-8363
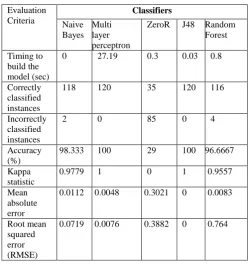
Table 2. Performance result for Classifiers
Evaluation Criteria Classifiers Naive Bayes Multi layer perceptron
ZeroR J48 Random
Forest
Timing to build the model (sec)
0 27.19 0.3 0.03 0.8
Correctly classified instances
118 120 35 120 116
Incorrectly classified instances
2 0 85 0 4
Accuracy (%)
98.333 100 29 100 96.6667
Kappa statistic
0.9779 1 0 1 0.9557
Mean absolute error
0.0112 0.0048 0.3021 0 0.0083
Root mean squared error (RMSE)
0.0719 0.0076 0.3882 0 0.764
The following table 3 defines the confusion matrix generated by each classifier. If the confusion matrix has positive non zero values only in diagonals then it is said to be that the classifier performance is 100%. The non zero values in non diagonal elements introduces error in the classification process. Here Multilayer Perceptron and J48 algorithms classified all the instances correctly so only the diagonal elements have non zero items. It shows that 30 students have got A grade, 35 got B grade, 35 got C grade. 11 got D grade and 9 classified as E grade. The row total and column total are used to find the accuracy of the classifiers defined in table 4.
Table 3: Confusion matrix
Classifier A B C D E Remark
NaiveBayes 28 2 0 0 0 A
0 35 0 0 0 B 0 0 35 0 0 C 0 0 0 11 0 D 0 0 0 0 9 E Multilayer
perceptron and J48
30 0 0 0 0 A
S. Lakshmi Prabha
et al
, International Journal of Computer Science and Mobile Applications,
Vol.3 Issue. 9, September- 2015, pg. 1-8
ISSN: 2321-8363
In table 4 weighted average of TP rate, FP rate, Precision, F-Measure and ROC area are compared among the classifiers. J48 and Multilayer Perceptron are having the equal maximum values compared with other algorithms.
TP rate (True Positive Rate) =correctly classified instances / Total Instance.
Total instance is the row total for each class in the confusion matrix. FP Rate (False Positive Rate) takes the incorrectly classified cases for calculation.
Precision = correctly classified instances/ Total predicted instances.
Here Total predicted instances takes the column total for each class.
F-measure is a measure of test accuracy and is determined as (2* TP rate* Precision)/ (TP Rate + Precision).
Test accuracy is very low in ZeroR. ROC (Receiver Operating Characteristics Area) curve is given by
the TP rate and FP rate. The area under the ROC curve (AUC) is a method of measuring the performance of the
ROC curve. If AUC is 1 then the prediction is perfect, if it is 0.5 the the prediction is said to be random. The
best prediction is shared by J48, Multilayer perceptron and NaiveBayes. ZeroR is random here. Random Forest
is 0.994 nearing the best prediction.
Table 4. Accuracy of classifiers using weighted average
Weighted Average
Classifiers Naive
Bayes
Multilayer perceptron
ZeroR J48 Random
Forest
TP Rate 0.983 1 0.292 1 0.967
FP Rate 0.007 0 0.292 0 0.014
Precision 0.984 1 0.085 1 0.968
F-Measure 0.983 1 0.132 1 0.966
ROC area 1 1 0.5 1 0.994
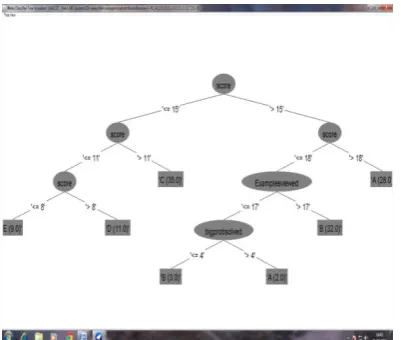
The following Figure 3 shows the rules generated by J48 classifier and viewed in tree visualizer. How J48
classifies the instances are clearly given in this tree structure.
0 9 0 0 0 D 0 11 0 0 0 E Random
Forest
30 0 0 0 0 A
S. Lakshmi Prabha
et al
, International Journal of Computer Science and Mobile Applications,
Vol.3 Issue. 9, September- 2015, pg. 1-8
ISSN: 2321-8363
Figure 3. J48 classifier rules generated by tree visualize
6.
Conclusion
This paper, studied how different EDM algorithms for classification works on student records generated from an e-learning domain.. The performance of the selected algorithms are analysed on various criteria’s. We used students' data from the database of sixth grade students of a school who worked in Mathstutor[12]. The training set contains 120 records each for a student and 10 fold cross- validations is used for classification. Though multi layer perceptron and J48 has 100% accuracy J48 takes very minimum time 0.03 seconds compared with 27.19 seconds taken by the other. The multilayer perceptron has 0.0048 MAE and 0.0076 RMSE whereas J48 has 0. Hence the classification algorithms used in this study can be ranked as :
Excellent ---- J48
Multilayer Perceptron
NaiveBayes
Random Forest
Poor ZeroR
This paper provides only limited number of screen shots applied on student data. By classifying the knowledge level of students with test marks and grouping them will make easier for the teacher to concentrate the areas for week students. Here the D and E grade students are identified as Weak in problem solving. This study provides confidence that EDM methods can be applied to educational data, particularly to improve students’ performance by classification.
For future work more granular data about student activity log having hints used and time taken for solving the problems are to be analyzed. And data mining algorithms could be embedded into e- learning system so that one using the system can be benefited from the data mining techniques.
REFERENCES
[1] C. Romero, S. Ventura, Educational data mining: a review of the state of the art. Systems, Man, and
Cybernetics, Part C: Applications and Reviews, IEEE Transactions on, Vol. 40, n. 6, pp. 601-618, 2010.
S. Lakshmi Prabha
et al
, International Journal of Computer Science and Mobile Applications,
Vol.3 Issue. 9, September- 2015, pg. 1-8
ISSN: 2321-8363
[3] A. B. E. D. Ahmed, I. S. Elaraby, Data Mining: A prediction for Student's Performance Using Classification
Method. World Journal of Computer Application and Technology, Vol. 2, n. 2, pp.43-47, 2014.
[4] ] S. Borkar, S. Rajeswari, Predicting Students Academic Performance Using Education Data Mining.
IJCSMC International Journal of Computer Science and Mobile Computing, Vol. 2, Issue. 7, July 2013, pg.273
– 279
[5] Sonia Joseph, Laya Devadas, Student’s Performance Prediction Using Weighted Modified ID3 Algorithm,
International Journal of Scientific Research Engineering & Technology, Volume 4, Issue 5, May
2015,pg.57-575.
[6] Md. Hedayetul Islam Shovon , Mahfuza Haque, Prediction of Student Academic Performance by an
Application of K-Means Clustering Algorithm, International Journal of Advanced Research in Computer
Science and Software Engineering, Volume 2, Issue 7, July 2012,pg 353-355.
[7] V.Ramesh, P.Parkavi, P.Yasodha, Performance Analysis of Data Mining Techniques for Placement Chance
Prediction ,International Journal of Scientific & Engineering Research Volume 2, Issue 8, August-2011, pg.1-6
[8] Umesh Kumar Pandey S. Pal, “Data Mining : A prediction of performer or underperformer using classification,” International Journal of Science and e and Information Technologies, Vol. 2 (2) , 2011, 686-
690.
[9]Suchita Borkar and K. Rajeswari, “Predicting Students Academic Performance Using Education Data Mining,” International Journal of Computer Science and Mobile Computing. IJCSMC, Vol. 2, Issue. 7, July
2013, pg.273 – 279
[10] A.Peña-Ayala, Educational data mining: A survey and a data mining-based analysis of recent works. Expert
Systems with Applications, Vol. 41, n. 4, pp. 1432-1462, 2014. http://dx.doi.org/10.1016/j.eswa.2013.08.042
[11] Baker, R. S. J. D., & Yacef, K. (2009). The state of educational data mining in 2009: A review and future
visions. Journal of Educational Data Mining, 1(1), 3-17.
[12]Lakshmi Prabha S. And AR. Mohamed Shanavas, Implementation of E-Learning Package for
Mensuration-A Branch of Mathematics, IEEE, ISBN: 978-1-4799-2876-7,Pg: 219 – 221, DOI: 10.1109/WCCCT.2014.37.
[13] J. R. Quinlan, “Introduction of decision tree: Machine learn”, 1: pp. 86-106, 1986.