O R I G I N A L R E S E A R C H
Open Access
No significant difference found in PET/MRI
CBF values reconstructed with
CT-atlas-based and ZTE MR attenuation correction
Hidehiko Okazawa
1*, Tetsuya Tsujikawa
1, Yoshifumi Higashino
2, Ken-Ichiro Kikuta
2, Tetsuya Mori
1,
Akira Makino
1and Yasushi Kiyono
1Abstract
Background:Accurate attenuation correction (AC) is one of the most important issues to be addressed in quantitative brain PET/MRI imaging. Atlas-based MRI AC (AB-MRAC), one of the representative MRAC methods, has been used to estimate the skull attenuation in brain scans. The zero echo time (ZTE) pulse sequence is also expected to provide a better MRAC estimation in brain PET scans. The difference in quantitative measurements of cerebral blood flow (CBF) using H215O-PET/MRI was compared between the two MRAC methods, AB and ZTE. Method:Twelve patients with cerebrovascular disease (4 males, 43.2 ± 11.7 years) underwent H215O-PET/MRI studies with a 3-min PET scan and MRI scans including the ZTE sequence. Eleven of them were also studied under the conditions of baseline and 10 min after acetazolamide administration, and 2 of them were followed up after several months interval. A total of 25 PET images were reconstructed as dynamic data using 2 sets of reconstruction parameters to obtain the image-derived input function (IDIF), the time-activity curves of the major cerebral artery extracted from images, and CBF images. The CBF images from AB- and ZTE-MRAC were then compared for global and regional differences.
Results:The mean differences of IDIF curves at each point obtained from AB- and ZTE-MRAC dynamic data were less than 5%, and the differences in time-activity curves were very small. The means of CBF from AB- and ZTE-MRAC reconstructions calculated using each IDIF showed differences of less than 5% for all cortical regions. CBF images from AB-MRAC tended to show greater values in the parietal region and smaller values in the skull base region. Conclusion:The CBF images from AB- and ZTE-MRAC reconstruction showed no significant differences in regional values, although the parietal region tended to show greater values in AB-MRAC reconstruction. Quantitative values in the skull base region were very close, and almost the same IDIFs were obtained.
Keywords:Zero-TE, MR attenuation correction, Quantitative PET/MRI, Cerebral blood flow, IDIF
Introduction
A new hybrid scanner combining positron emission tomography (PET) and MRI, the PET/MRI system, should be very beneficial in the neuropsychiatric field, especially for the precise fusion of high-grade anatomical MR images and PET molecular imaging [1]. The quanti-tative PET images are also anticipated, although several issues remain to be confirmed for global as well as
regional values. MR-based attenuation correction (MRAC) is one of the major concerns in quantitative brain PET images because the brain is covered by the skull. MR segmentation images using the Dixon method are usually applied for the reconstruction of body PET images. However, for brain PET images, MRAC using the Dixon-based method showed greater bias and under-estimation of PET values compared with CT-based at-tenuation correction methods because of inaccurate estimation of the bone attenuation [2, 3]. The single-and multi-CT atlas-based (AB) attenuation correction methods were also compared, and multi-AB-MRAC
© The Author(s). 2019Open AccessThis article is distributed under the terms of the Creative Commons Attribution 4.0 International License (http://creativecommons.org/licenses/by/4.0/), which permits unrestricted use, distribution, and reproduction in any medium, provided you give appropriate credit to the original author(s) and the source, provide a link to the Creative Commons license, and indicate if changes were made.
* Correspondence:[email protected]
showed PET quantitative values very close to those from individual CT attenuation correction (CTAC) [4]. The ultrashort echo time (UTE) and zero echo time (ZTE) pulse sequences have been applied to brain PET image reconstruction for bone identification in the MRAC method, and biases of quantitative values were reported to be reduced [5–7]. A multicenter study showed that these newer MRAC methods produced better and more reliable quantitative images than those from the simple Dixon-based method [8]. These recent studies suggested that the MRAC method has been improved in terms of quantitative PET evaluation using PET/MRI scanners.
PET measurement of cerebral blood flow (CBF) using H215O PET usually requires arterial blood sampling from individual patients to estimate the input function of the tracer. Recently, several methods to obtain the image-derived arterial input function (IDIF) have been proposed by using time-of-flight (TOF) MR angiography images to detect the location of the internal carotid ar-teries (ICA) at the skull base [9–12]. The method is ideal for the PET/MRI scanner because both image data can be acquired simultaneously. The IDIF method in H215O PET/MRI is useful and practical to estimate the arterial input function directly from the cerebral arteries [13], and the CBF values using IDIF were consistent with pre-vious 15O-PET studies [14, 15]. However, the brain counts in the skullbase were reported to be underesti-mated in previous studies [4, 6], while a recent study suggested that both AB- and ZTE-MRAC tended to overaetimate PET counts slightly in the whole brain even in the skullbase [16]. The PET counts at the skullbase may influence on the quantitative values in the IDIF method, because it usually uses arterial counts at the ICA in the skullbase area.
The present study investigated the differences of IDIF curves at the ICA area using the two different MRAC methods as well as their influence on CBF values in the whole brain. Since the ZTE approach is reported to show closer PET counts to ordinary CTAC, AB-MRAC may provide greater bias in brain PET images and IDIF counts [16].
Material and methods
Subjects
Twelve patients with cerebrovascular disease (4 males and 8 females, 43.2 ± 11.7 years) were studied using H215O PET/MRI for measurement of CBF. All patients had unilateral stenosis or occlusions in the internal ca-rotid artery (ICA) or the middle cerebral artery (MCA). Eleven of them underwent H215O PET/MRI scans before and after the acetazolamide injection to evaluate their hemodynamic status before considering further treat-ment [17]. One underwent only baseline CBF evaluation, and two were followed up to observe hemodynamic
changes after the neurosurgical treatment (carotid artery stenting). Thus, 25 H215O PET/MRI scans were per-formed in total. The study was approved by the Ethics Committee of the University of Fukui, Faculty of Med-ical Sciences, based on its guidelines (EthMed-ical Guidelines for Medical Science Research with Humans) as well as the Helsinki Declaration of 1975 (revised in 1983). Writ-ten informed consent was obtained from each patient.
PET/MRI scanner preparation
A whole-body PET/MRI scanner (Signa PET/MR, ver. 24, GE Healthcare, Milwaukee, WI, USA) was used for simultaneous PET and MRI data acquisition [18]. The scanner permits PET acquisition of 89 image slices in three-dimensional (3D) mode with a slice thickness of 2.45 mm. Performance tests showed the intrinsic reso-lution of PET images to be 4.2–4 .3 mm in the transaxial direction. The PET/MRI scanner was calibrated with a dose-calibrator (CRC-12, Capintec Inc., NJ, USA) be-forehand using a pool phantom and 18F-solution, ac-cording to the manufacturer’s scanner guidelines.
PET and MRI data acquisition
The patients underwent brain PET/MRI scans using a standard head coil (8-channnel HD Brain, GE Health-care) for simultaneous PET and MRI acquisition. A 3-min list-mode 3D PET scan in TOF acquisition mode was started at the time of a bolus tracer injection of 555 MBq 15O-water via the antecubital vein. During the PET scan, LAVA-Flex (GE Healthcare) T1-weighted im-ages (repetition time, 4 ms; echo time, 1 .7 ms; flip angle, 5°; slice thickness, 5 .2 mm with 2 .6 mm overlap; 120 slices; pixel size, 1.95 × 2.93 mm; acquisition time, 18 s) were acquired for MRAC in the head position using the default CT atlas-based map [19]. A 3D radial acquisition was also performed for the ZTE approach in the axial direction with the following parameters: field of view (FOV) 264 mm, matrix 110 × 110 × 116, voxel size 2.4 × 2.4 × 2.4 mm3, flip angle 0.8°, number of excitations 4, bandwidth ± 62.5 kHz, and acquisition time of 41 s [20, 21]. MR angiography (MRA) and other anatomical MR images such as 3D-T1WI, T2WI, fluid-attenuated inver-sion recovery (FLAIR), etc. were acquired in the same position after the PET scan.
AB- and ZTE-based attenuation map
pre-filtering and histogram-based normalization, followed by an intensity-based segmentation of the head, bias correction, identification of voxels affected by par-tial volume effects, and segmentation of the sinus, bone, and cavity masks. After these steps, a pseudo-CT map was generated with bone tissue linearly scaled based on the ZTE intensity. This mapping was determined by fit-ting of registered CT and ZTE data in the bone density range. To convert the pseudo-CT into a MRAC map, the images were re-sampled with a 60 × 60 × 25 cm3 FOV in 128 × 128 × 89 matrix, and finally re-scaled to 511 keV attenuation coefficients.
PET reconstruction and CBF image calculation
The dynamic PET images were reconstructed from the PET data using the 3D ordered-subset expectation maximization (OSEM) method and point spread func-tion (PSF) modeling algorithm in 21 frames of 12 × 5 s, 6 × 10 s, and 3 × 20 s. Two OSEM parameter sets were applied for PET image reconstruction as follows: (A) subset, 32; iteration, 4; transaxial post-reconstruction Gaussian filter cutoff, 2 mm; and (B) subset, 28; iter-ation, 3; Gaussian filter cutoff, 3 mm in 256 mm FOV and 2 × 2 mm pixel size. Image data set A was used for estimation of the arterial input function using the IDIF method, and image data set B was used for CBF image calculation [13]. Decay of radio-activity in the dynamic PET data was corrected to the starting point of each scan.
Details of the IDIF extraction are described elsewhere [13]. In brief, the average image of the initial phase (10– 40s) of dynamic PET data was used to extract voxels only inside the ICA, where the 30 most intensely
radioactive voxels were selected as the volume of inter-est (VOI) mask at the region of the cavernous part of the ICA. Individual 3D TOF-MRA images were used to confirm the position of the arterial VOI mask exactly on the ICA [12, 13]. Time-activity curves (TACs) for IDIF were obtained by applying the ICA VOI masks on the dynamic PET data.
CBF images (mL/min/100 g) were calculated by the autoradiographic method with individual look-up tables using arterial IDIF and a partition coefficient of 0.9 [13, 15,23]. Since the IDIF was obtained from the same dy-namic PET data at the skull base, no correction for the delay time of tracer arrival was needed.
Statistical analyses in CBF values
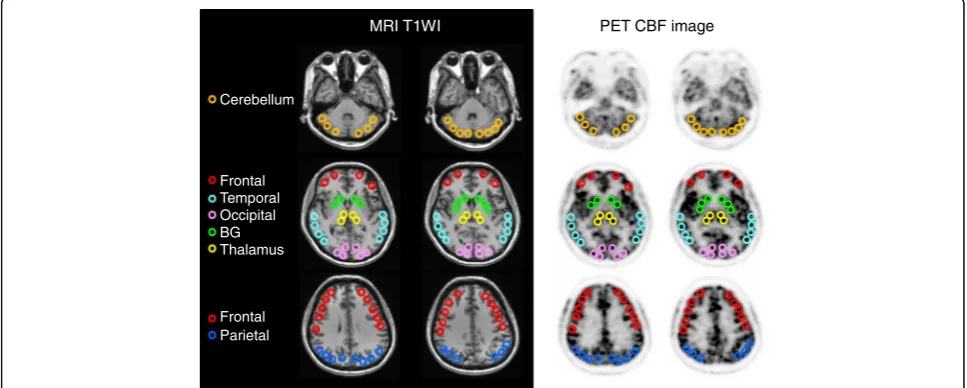
To compare the cortical CBF values between the two MRAC methods, 10–30 circular regions of interest (ROIs) 10-mm in diameter were set manually for each region of the bilateral hemispheres using the individual 3D-T1WI images (Fig. 1). Dr. View (AJS Co., Ltd., Tokyo, Japan) was used for the ROI analysis. Large re-gions such as the cerebral cortices and the cerebellum include 25–30 ROIs for each hemisphere and small brain regions such as the basal ganglia and the thalamus includes 10 ROIs. CBF values in the affected region and infarction, if any, were excluded. Each regional value was the average of ROIs in the same region. Two of the au-thors who are radiologists (HO and TT) determined the location of the ROIs and confirmed they were appropri-ate. Repeated measures analysis of variance (ANOVA) with a post-hoc paired t test was applied to analyze the difference in the mean cortical CBF values between the two MRAC methods of AB and ZTE. P< 0.05 was
MRI T1WI PET CBF image
Cerebellum
Frontal Temporal Occipital BG Thalamus
Frontal Parietal
considered to be statistically significant. To observe re-gional correlation of the two methods, CBF values from 310 ROIs in total were plotted for each patient. Bland-Altman plot analysis was also applied to the result when a wide variation was observed in the scatter plot.
Results
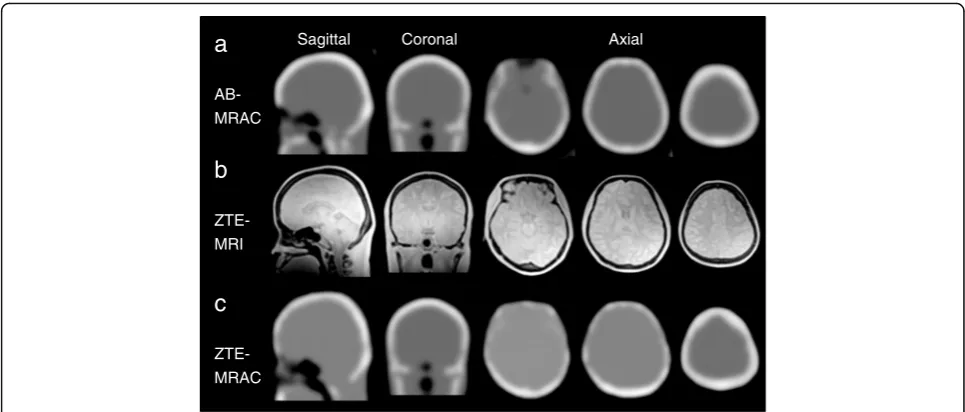
Figure 2 shows MRAC maps and ZTE images for the PET attenuation correction. Although the ZTE-MRAC (Fig. 2c) shows similar head AC maps to AB-MRAC (Fig.2a), slight differences can be observed in the frontal
a
AB-MRAC
b
ZTE-MRI
c
ZTE-MRAC
Sagittal Coronal Axial
Fig. 2MRAC maps from the AB- (a) and ZTE-based (c) methods, and ZTE images (b) for PET attenuation correction. Although the ZTE-MRAC shows similar head AC maps to AB-MRAC, there are slight differences in the frontal sinus region (left column of axial sections) and bone thickness in the parietal region (middle and right column of axial sections)
Fig. 3aAverage percentage differences in arterial radioactivity at each point of dynamic PET frames. The difference of each point was less than
5%, although variance (SD) was about ± 10%.bA representative IDIF curve from a patient is presented at the bottom. The error bars were
sinus region and thickness of skull bone, especially in the frontal part.
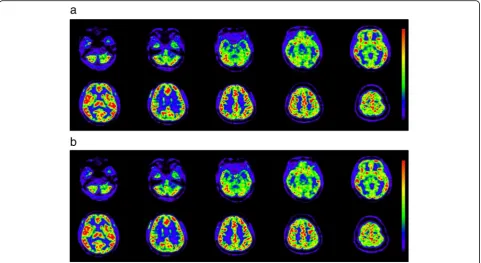
Figure 3 shows the average differences in arterial radioactivity at each point of the dynamic PET frame. The differences were less than 5%, although the vari-ances (SD) were as large as ± 10% (Fig. 3a). Figure 3b shows a representative IDIF curve from a patient with error bars calculated from the average differences of each time point. Estimation errors were small, especially in the phase of lower radioactivity, indicating that only small differences may be expected in the area under the curve of IDIF from the AB- and ZTE-MRAC PET im-ages. As the result of this small difference in IDIF curves, the CBF images calculated from AB-MRAC re-construction and those from ZTE-MRAC were very close, and the regional values were almost the same
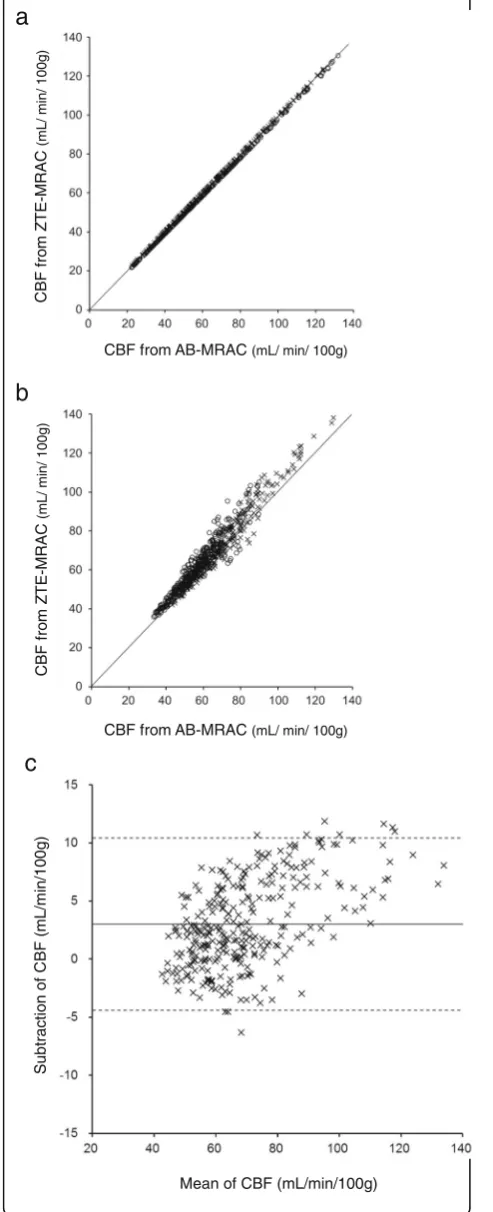
(Fig. 4). Table 1 shows the regional average values at baseline and after the acetazolamide challenge test. The regional values averaged for the bilateral hemispheres showed no significant differences between the two MRAC methods. A scatter plot of the regional CBF values from the 310 ROIs used for CBF measurement showed a good correlation. Figure5shows two represen-tative cases of regression analysis; one of them had ex-cellent correlations for both at baseline and after acetazolamide administration (Fig. 5a, R2= 1.0). Even in the second case, which had greater variance, the correl-ation coefficient was excellent (Fig. 5b, R2= 0.96). The means of slopes and correlation coefficients for all PET scans were 1.02 ± 0.08 and 0.97 ± 0.03, respectively. The Bland-Altman plot for the latter case showed no signifi-cant bias, although the CBF image with AB-MRAC Fig. 4Representative CBF images calculated from dynamic PET data reconstructed by the AB- (a) and ZTE-MRAC (b) methods. Color scales in the same range show that the two images are very close and regional values are almost the same
Table 1Regional CBF values (mL/min/100 g) from two MRAC methods (mean ± SD)
AB baseline (n= 14) ZTE baseline (n= 14) AB ACZ (n= 11) ZTE ACZ (n= 11)
Frontal 46.7 ± 14.0 45.2 ± 12.5 50.9 ± 15.2 50.6 ± 15.0
Parietal 45.6 ± 10.7 44.1 ± 9.7 56.4 ± 13.0 56.0 ± 12.2
Temporal 45.0 ± 11.9 45.6 ± 11.6 59.5 ± 15.4 60.4 ± 15.6
Occipital 45.6 ± 12.4 45.4 ± 12.3 64.6 ± 21.2 64.6 ± 20.8
Basal ganglia 50.9 ± 13.9 51.4 ± 13.5 60.9 ± 13.5 61.3 ± 13.5
Thalamus 53.3 ± 16.9 53.6 ± 16.6 78.7 ± 25.1 79.3 ± 24.6
Cerebellum 51.1 ± 13.2 52.2 ± 13.4 68.9 ± 18.5 70.1 ± 19.6
tended to show greater values in the higher mean CBF range (mean difference 3.0 ± 3.8; range −4.4–10.4 mL/ min/100 g) (Fig.5c).
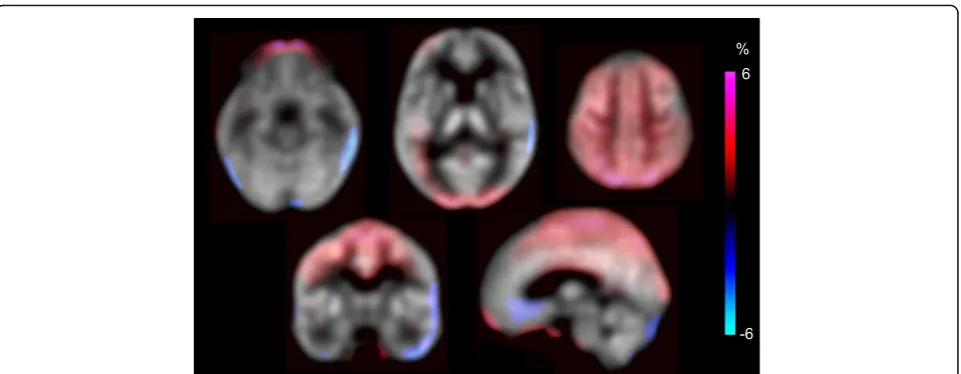
Figure 6 shows the mean percentage differences in
CBF images calculated from individual CBF by
2 × [AB-MRAC − ZTE-MRAC] / [AB-MRAC +
ZTE-MRAC]. Red color indicates higher values and blue indicates lower values for the AB-MRAC method. The parietal to occipital region shows higher CBF values for the AB-MRAC method compared with those of the ZTE-MRAC method, although the difference was less than 5%. Other brain regions showed no differences and the quantitative CBF values were very close.
Discussion
The present study evaluated the effects of a new MRAC method using ZTE images on the quantitative PET and CBF values calculated from brain H215O PET/MRI. We compared arterial input curves from the IDIF method and regional CBF values calculated separately from two different dynamic PET images of AB- and ZTE-MRAC reconstruction, and found no significant differences be-tween the two methods. The TACs from the IDIF showed mean differences less than 5% at each time point, and did not show significant differences in the areas under the curves of the TACs. The 3-min H215O-PET average images as well as quantitative CBF images from the AB-MRAC reconstruction method tended to show greater regional values compared with the ZTE-MRAC reconstruction method (Fig. 6). How-ever, the values at the skull base, where the IDIF-TAC was obtained, were similar. Previous FDG-PET studies also showed a tendency of overestimation of AB-MRAC images in the parietal region compared with images from CTAC [6, 21]. Thus, the ZTE-MRAC method seems to be appropriate for the quantitative evaluation of brain PET. Our previous study showed that overall CBF values from H215O PET/MRI using the IDIF method were reasonable in healthy volunteers [13], and were consistent with a previous multicenter study in Japan using15O-PET for healthy volunteers [14].
CBF from AB-MRAC(mL/ min/ 100g)
CBF f
ro
m
Z
TE
-MRAC
(m
L/ min/ 100
g)
CBF f
ro
m
Z
T
E
-MRAC
(m
L/ m
in/
100g)
CBF from AB-MRAC(mL/ min/ 100g)
b
a
Mean of CBF (mL/min/100g)
Subtrac
tion o
f
CBF
(m
L
/m
in/
1
0
0
g
)
c
Fig. 5Two representative regression analyses for regional CBF
obtained from 310 ROIs for all brain regions (see Table1). The first
case (a) showed excellent correlation at baseline (○:y= 0.99x+ 0.48,
R2
= 1.0) as well as after acetazolamide administration (×:y= 0.99x+
0.13,R2= 1.0). Several cases showed slightly greater variance, as
shown in panel (b), although the correlation coefficient was
excellent (baseline (○):y= 1.1x+ 4.5,R2= 0.96; acetazolamide (×):y=
1.1x+ 1.3,R2= 0.90). Graphcshows the Bland-Altman plot for the
second case which had no significant bias, although the AB-MRAC CBF image tended to show greater values in the higher range of the CBF mean (mean difference 3.0 ± 3.8;
There were no significant differences in the regional CBF values from each brain area obtained from patients with cerebrovascular disease in the present study. Al-though recent FDG-PET/MRI studies showed little re-gional differences in PET counts when using several new MRAC methods [5, 21], about 5% regional difference at maximum may affect results of statistical mapping ana-lysis if we use normal database obtained from different calculation methods of PET image. To apply brain PET/ MRI images for statistical mapping analysis, the same method of PET/MRI reconstruction should be used for both control as well as patient images.
Several previous studies reported that the AB-MRAC method provided reasonable PET values, although AB-MRAC tended to overestimate in the parietal regions, and the ZTE-MRAC method showed a tendency of slight underestimation for the whole brain [4,6,21]. These results, comparing FDG accumulation in the brain, are consistent with the present study. If we had compared our CBF data with images from other AC methods such as CTAC, similar results may have been observed because the ZTE-MRAC method would provide quantitative images very close to the CTAC PET images [16]. One of the reasons for the higher CBF values in the parietal region with the AB-MRAC method may have been caused by the thickness of the skull CT atlas prepared by the vendor. The frontotemporal part of the upper skull showed a thicker bone map on AB-MRAC images compared with ZTE-MRAC (Fig.2, right column in axial view). This small difference may have induced the over-estimation in AB-MRAC images.
The TOF technique for PET reconstruction using PET/MRI seems to be important, especially for quantita-tive images. The frontal part of the skull sometimes
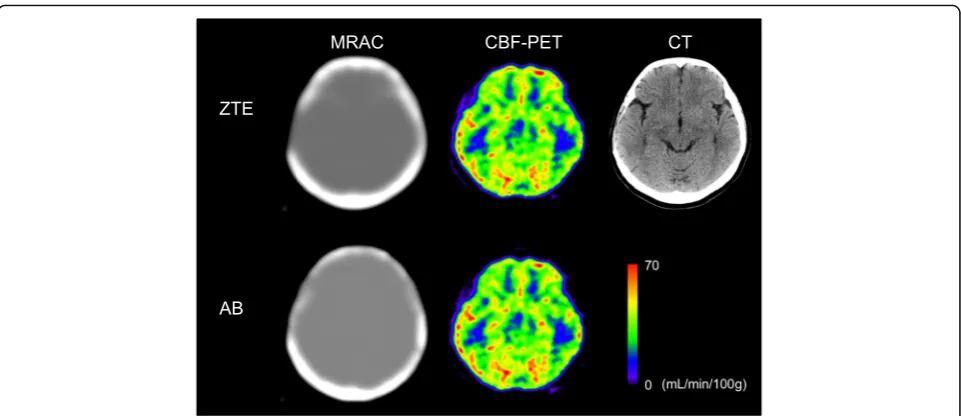
shows substantial differences between AB-MRAC and CTAC due to the frontal sinus. If the difference between MRAC and CTAC strictly affects the PET image calcula-tions, brain cortices close to the sinus would show sig-nificant differences in regional radioactivity concentration, as well as on quantitative images. How-ever, even in the cases with a relatively large frontal sinus as well as temporal bone defects after neurosurgi-cal operation, the CBF values close to the bone defect were not significantly different (Fig. 7). This result indi-cates that the TOF acquisition technique would substan-tially compensate for the errors in MRAC [6, 24]. TOF reconstruction is reported to be less sensitive to errors in attenuation correction, and is beneficial in multimodal systems such as PET/MRI [25].
A limitation of the present study was that we evalu-ated only a small number of patients with cerebrovascu-lar disease who had unilateral occlusive changes in the major cerebral arteries. Since each IDIF was obtained from an unoccluded part of the internal carotid artery, and all patients had excellent input curves very close to those of healthy volunteers [13], the IDIF curves were considered to be appropriate and did not affect the CBF calculation. Furthermore, the purpose of the study was to compare the difference in quantitative results ob-tained from two different MRAC methods. Although the patient number was limited, 25 PET scans were com-pared in total. Thus, we consider that the results of the present study are reliable.
Conclusion
The CBF images calculated from AB- and ZTE-MRAC reconstruction showed no significant differences in
6
-6 %
quantitative regional values, although the parietal region tended to show greater values on AB-MRAC images compared with ZTE-MRAC. Arterial radioactivity at the skull base was very similar between them, and almost the same IDIFs were obtained, with small errors, which provided similar CBF values for the brain. Since the commercially available single-CT-atlas-based method transforms the CT-atlas into AB-MRAC using individual Dixon-MRI images, it may induce slight bias on MRAC maps as well as regional PET counts [4, 6, 16]. The ZTE-MRAC reconstruction method, estimating bone at-tenuation from individual ZTE-MRI images, is expected to be used as a standard method for quantitative brain PET studies.
Abbreviations
3D:Three dimensional; AB: CT atlas-based; AC: Attenuation correction;
ANOVA: Analysis of variance; CBF: Cerebral blood flow; CTAC: CT attenuation correction; FLAIR: Fluid-attenuated inversion recovery; FOV: Field of view; ICA: Internal carotid artery; IDIF: Image-derived input function; MCA: Middle cerebral artery; MRA: MR angiography; MRAC: MR attenuation correction; OSEM: Ordered subset expectation maximization; PSF: Point spread function; ROI: Region of interest; TAC: Time-activity curve; TOF: Time of flight; UTE: Ultra-short TE; VOI: Volume of interest; ZTE: Zero-TE
Acknowledgements
The authors thank Hiroshi Oikawa and other staff of the Biomedical Imaging Research Center and doctors in the Department of Neurosurgery, University of Fukui for technical and clinical support.
Funding
This study was partly funded by a Grant-in-Aid for Scientific Research from the Japan Society for the Promotion of Science (18H02763).
Availability of data and materials
The datasets used and/or analyzed during the current study are available from the corresponding author on reasonable request.
Authors’contributions
HO designed the study. TT, YH, TM, and HO contributed to data acquisition. HO calculated CBF images based on the two MRAC methods. HO and TT contributed to the data analysis and interpretation. HO and TT performed the statistical analysis. HO, TT, YH, KK, AM, and YK contributed to drafting of the manuscript together. All authors read and approved the final manuscript.
Ethics approval and consent to participate
The protocol of this study was approved by the Ethics Committee of University of Fukui, Faculty of Medical Sciences (#20170225). Written informed consent was obtained from each patient.
Consent for publication Not applicable.
Competing interests
The authors declare that they have no competing interests.
Publisher’s Note
Springer Nature remains neutral with regard to jurisdictional claims in published maps and institutional affiliations.
Author details
1Biomedical Imaging Research Center, University of Fukui, 23-3, Matsuoka-Shimaizuki, Eiheiji-cho, Fukui 910-1193, Japan.2Deartment of Neurosurgery, Faculty of Medical Sciences, University of Fukui, 23-3, Matsuoka-Shimaizuki, Eiheiji-cho, Fukui 910-1193, Japan.
Received: 23 January 2019 Accepted: 6 March 2019
References
1. Drzezga A, Barthel H, Minoshima S, Sabri O. Potential clinical applications of
PET/MR imaging in neurodegenerative diseases. J Nucl Med. 2014;55:47S–55S.
2. Sekine T, Buck A, Delso G, Ter Voert EE, Huellner M, Veit-Haibach P, Warnock
human brain: application of a head atlas and comparison to true CT-based
attenuation correction. J Nucl Med. 2016;57:215–20.
3. Teuho J, Johansson J, Linden J, Hansen AE, Holm S, Keller SH, Delso G,
Veit-Haibach P, Magota K, Saunavaara V, Tolvanen T, Teräs M, Iida H. Effect of attenuation correction on regional quantification between PET/MR and PET/ CT: a multicenter study using a 3-dimensional brain phantom. J Nucl Med.
2016;57:818–24.
4. Sekine T, Burgos N, Warnock G, Huellner M, Buck A, Ter Voert EE, Cardoso
MJ, Hutton BF, Ourselin S, Veit-Haibach P, Delso G. Multi-atlas-based
attenuation correction for brain18F-FDG PET imaging using a time-of-flight
PET/MR scanner: comparison with clinical single-atlas- and CT-based
attenuation correction. J Nucl Med. 2016;57:1258–64.
5. Cabello J, Lukas M, Kops ER, Ribeiro A, Shah NJ, Yakushev I, Pyka T, Nekolla
SG, Ziegler SI. Comparison between MRI-based attenuation correction methods for brain PET in dementia patients. Eur J Nucl Med Mol Imaging.
2016;43:2190–200.
6. Sekine T, ter Voert EE, Warnock G, Buck A, Huellner M, Veit-Haibach P, Delso
G. Clinical evaluation of zero-echo-time attenuation correction for brain18
F-FDG PET/MRI: comparison with atlas attenuation correction. J Nucl Med.
2016;57:1927–32.
7. Su Y, Rubin BB, McConathy J, Laforest R, Qi J, Sharma A, Priatna A,
Benzinger TL. Impact of MR-based attenuation correction on neurologic PET
studies. J Nucl Med. 2016;57:913–7.
8. Ladefoged CN, Law I, Anazodo U, St Lawrence K, Izquierdo-Garcia D, Catana
C, Burgos N, Cardoso MJ, Ourselin S, Hutton B, Mérida I, Costes N, Hammers A, Benoit D, Holm S, Juttukonda M, An H, Cabello J, Lukas M, Nekolla S, Ziegler S, Fenchel M, Jakoby B, Casey ME, Benzinger T, Højgaard L, Hansen AE, Andersen FL. A multi-centre evaluation of eleven clinically feasible brain PET/MRI attenuation correction techniques using a large cohort of patients.
Neuroimage. 2017;147:346–59.
9. Zanotti-Fregonara P, Chen K, Liow JS, Fujita M, Innis RB. Image-derived
input function for brain PET studies: many challenges and few
opportunities. J Cereb Blood Flow Metab. 2011;31:1986–98.
10. Su Y, Arbelaez AM, Benzinger TLS, Snyder AZ, Vlassenko AG, Mintun MA,
Raichle ME. Noninvasive estimation of the arterial input function in positron emission tomography imaging of cerebral blood flow. J Cereb Blood Flow
Metab. 2013;33:115–21.
11. Su Y, Vlassenko AG, Couture LE, Benzinger TL, Snyder AZ, Derdeyn CP,
Raichle ME. Quantitative hemodynamic PET imaging using image-derived arterial input function and a PET/MR hybrid scanner. J Cereb Blood Flow
Metab. 2017;37:1435–46.
12. Islam MM, Tsujikawa T, Mori T, Kiyono Y, Okazawa H. Estimation of arterial input
by a noninvasive image derived method in brain H215O PET study: confirmation
of arterial location using MR angiography. Phys Med Biol. 2017;62:4514–24.
13. Okazawa H, Higashino Y, Tsujikawa T, Arishima H, Mori T, Kiyono Y, Kimura H,
Kikuta K. Noninvasive method for measurement of cerebral blood flow using
O-15 water PET/MRI with ASL correlation. Eur J Radiol. 2018;105:102–9.
14. Ito H, Kanno I, Kato C, Sasaki T, Ishii K, Ouchi Y, Iida A, Okazawa H,
Hayashida K, Tsuyuguchi N, Ishii K, Kuwabara Y, Senda M. Database of normal human cerebral blood flow, cerebral blood volume, cerebral oxygen extraction fraction and cerebral metabolic rate of oxygen measured by
positron emission tomography with15O-labelled carbon dioxide or water,
carbon monoxide and oxygen: a multicentre study in Japan. Eur J Nucl Med
Mol Imaging. 2004;31:635–43.
15. Okazawa H, Yamauchi H, Sugimoto K, Toyoda H, Kishibe Y, Takahashi M.
Effects of acetazolamide on cerebral blood flow, blood volume and oxygen metabolism: a PET study with healthy volunteers. J Cereb Blood Flow
Metab. 2001;21:1472–9.
16. Khalifé M, Fernandez B, Jaubert O, Soussan M, Brulon V, Buvat I, Comtat C.
Subject-specific bone attenuation correction for brain PET/MR: can ZTE-MRI
substitute CT scan accurately? Phys Med Biol. 2017;62(19):7814–32.
17. Okazawa H, Kudo T. Clinical impact of hemodynamic parameter
measurement for cerebrovascular disease using positron emission
tomography and15O-labeled tracers. Ann Nucl Med. 2009;23:217–27.
18. Levin CS, Maramraju SH, Khalighi MM, Deller TW, Delso G, Jansen F. Design
features and mutual compatibility studies of the time-of-flight PET capable
GE SIGNA PET/MR system. IEEE Trans Med Imaging. 2016;35:1907–14.
19. Wollenweber SD, Ambwani S, Delso G, Lonn AHR, Mullick R, Wiesinger F,
Piti Z, Tari A, Novak G, Fidrich M. Evaluation of an atlas-based PET head attenuation correction using PET/CT and MR patient data. IEEE Trans Nucl
Sci. 2013;60:3383–90.
20. Wiesinger F, Sacolick LI, Menini A, Kaushik SS, Ahn S, Veit-Haibach P, Delso
G, Shanbhag DD. Zero TE MR bone imaging in the head. Magn Reson Med.
2016;75:107–14.
21. Delso G, Kemp B, Kaushik S, Wiesinger F, Sekine T. Improving PET/MR brain
quantitation with template-enhanced ZTE. J Nucl Med. 2018;181:403–13.
22. Abella M, Alessio AM, Mankoff DA, MacDonald LR, Vaquero JJ, Desco M,
Kinahan PE. Accuracy of CT-based attenuation correction in PET/CT bone
imaging. Phys Med Biol. 2012;57(9):2477–90.
23. Raichle ME, Martin WRW, Herscovitch P, Mintun MA, Markham J. Brain blood
flow measured with intravenous H215O: II. Implementation and validation. J
Nucl Med. 1983;24:790–8.
24. Boellaard R, Hofman MB, Hoekstra OS, Lammertsma AA. Accurate PET/MR
quantification using time of flight MLAA image reconstruction. Mol Imaging
Biol. 2014;16(4):469–77.
25. Conti M. Why is TOF PET reconstruction a more robust method in the