POVERTY IN LONDON
1885 - 95
A thesis presented for the
degree of Master of Arts and Honours in History
in the University of Canterbury,
Christchurch, New Zealand.
by
M.J. CULLEN
ii.
Preface
Poverty is a relative term. Therefore the first task in this study was to establish working definitions of "poverty" and the "poor" together with an estimate of the extent of poverty in London1 in our period. This task had already been done for us by Charles Booth in his great survey of the Life and Labour of the People in London. The problem was thus reduced to one of testing Booth's conclusionsi this question is dealt with in Chapter I.
The rest of this work is concerned with describing the structure of poverty in London in our period. The end of that period is
marked by the completion of the investigations carried cut for the Industry Series of the Booth Survey, the beginning by the finish of the Royal Commission on the Housing of the Working Classes of 1884-5. The Booth Survey is the major source for our study, but the decade 1885-95 also saw a number of Royal Commissions and Select Committees on topics related to the structure of poverty. Indeed, the Parlia-mentary Papers of the period contain a wealth of material on our
subject. It was not possible to utilize this material quite as fully as had been hoped because the microcards of the Parliamentary Papers did not arrive at Canterbury as expected. Consequently, the Papers had to be used during a somewhat extended visit to Wellington.
However, it must be emphasized that this is not a thesis about the Booth Survey but a thesis about poverty in London in the decade
1885-95.
i.ii.
Table of Contents
Page
Preface ii
Note on Abbreviations, etc. v
Chapter I: The Booth Survey and its Reliability 1
Chapter II: The Family Budget 46
Chapter III: Unemployment 72
Chapter IV: Human Failure 100
Chapter V: Population Pressure 122
Chapter VI: The Conditions of Working and Living 157
Chapter VII: Concluding Ob1servations 176
Appendix Bibliography
182 184
Note on Abbreviations, etc.
The following abbreviations have been used: GBPP: Great Britain Parliamentary Papers.
JRSS: Journal of the Royal Statistical Society.
LL Booth, Charles, et al.: Life and Labour of the People in London (Jrd edition, London, 1902-J). First Series: Poverty [I]. 4 volumes [i-ivJ and 1 volume of maps.
Second Series: Industry ~~ • 5 volumes [i-v}.
Tabulation of Statements: Condition of the Working Classes. Rep. and Tabulation of Statements made by men living in certain selected districts in London in March, 1887; GBPP 1887 (C.5228) lxxi, JOJ.
The volume number of journals has been given only where there was more than one volume a year. In all other cases the year or years of the bound volume sufficiently defines the volume.
Chapter I
The Booth Survey and its Reliability.
"London, every Body knows, is a City extreamly rich ••• and yet the Town is crouded with Beggars."
1.
Henri Misson, Memoires and Observations on his Travels over England, 1670-85.1
It would not be much of an exaggeration to say that in the late nineteenth century the question of the nature and extent of poverty was, like Gladstone's understanding of his defeat in 1874, "drowned in a torrent of gin and beer". The great majority of social comment-ators confounded the question of poverty and the Problem of Drink to such an extent that, apart from a few "bitter cries11
,2 the two became
indistinguishable; poverty existed largely because the poor drank too much. Thus late Victorian social reform still tended to be concerned with reforming people rather than with the social conditions which had deb~sed them. 3 Some Victorians had advanced beyond such views,
notably Edwin Chadwick,4 but it was not the least of Charles Booth's achievements that he was one of the pioneers in the fonnulation of new concepts concerning the origins of poverty. Booth perhaps made the most complete break with the rigidly moralistic approach to the problem of poverty and attempted to give an objective description of the causes and extent of poverty in the largest urban area in the world, London. 1 Quoted in H. and P. Massingham, The London Anthology, p.71.
2 The reference is to the pamphlet The Bitter Cry of Outcast London published by the London Congregational Union in 1883.
J
For a fuller discussion of this problem of drink see Chapter IV. 4 See M.W. Flinn, Introduction to Re ort on the Sanita Condition of2.
The paradox of the existence of poverty amidst plenty, which Misson had noted two centuries earlier, was one which concerned Booth deeply. His background was that of the Liverpool mercantile interests and hence of an essentially laissez-faire philosophy which stressed the inevitability of the existence of this paradox in a free enterprise society. Certainly the Noncomformist merchants of the north, Booth's
1
father among them, accepted a concept of their responsibility to help the poor, but the question of the existence of poverty scarcely
troubled them - every workshop, even the workshop of the world, had its waste products.
Though Booth never rejected in essence the individualist philosophy he was more conscious than most of his peers of the responsibility of wealth and more prepared to accept the logical consequences of this "doctrine of the inescapability of the responsibility of wealth and
2
power". His experiences as a young man electioneering for the Liberals in 1865 in some of the poorest quarters of Liverpool led him to a period of self-doubt and rejection of authority which was to culminate in a complete breakdown of his health in 1872.
3
If the religious principles of his age had led men to an acceptance of a system in which the rich man lived in his castle while the poor man nearly starved at his gate then those principles must be wrong. Thus, out of Booth's almost self-destructive reappraisal of the assumption of his class and times, there arose what might be called1 T.S. and M.B. Simey, Charles Booth: Social Scientist, p.16. 2 Ibid., p.29.
the intellectual "predisposing factors" for the work of his pioneering survey. The occasion was to be the publication in the earlier 18801s of a number of estimates and interpretations of poverty in London. Booth considered these to be inexact and sensationalist. The most important of these publications were the London Congregational Union's Bitter Cry of Outcast London of 1883 (though the Simeys cast doubt on this as an influence on
Booth's decision to undertake the survey1) and the Social Democratic Federation's estimate in 1885 that as many as 25 per cent of the population were living in conditions of extreme poverty. This last was probably the decisive factor; Booth, as an opponent of socialist tendencies, was determined to undertake a more scientific survey which, he felt, would show the claim of Hyndman1s group to
b ea gross exaggera ion. t . 2
The problem that now presented itself was, of course, how such a scientific survey was to be carried out. At preliminary meetings with some of Booth's friends, notably his wife's cousin, Beatrice
J.
Potter, it had been agreed that the task was one worthy of attention, but no tactical plan had emerged, only the overall strategy of
describing poverty and its relationship to industrial conditions.3 The man who solved this problem was Joseph Chamberlain, at this time carrying on a rather strange courtship of Beatrice.
4
1 Ibid., p.66. Even without documentary evidence it would seem a
reasonable assumption that this pamphlet affected Booth's thinking. 2 Ibid., p.69.
3 Ibid., p.79.
4.
Before the Royal Commission on the Housing of the Working Classes in 1885 Chamberlain had stated that he had found the School Board Visitors very useful when conducting an investigation into conditions
f d . . B" " h l
o overcrow 1ng in 1rm1ng am. The Simeys state that the idea of using the records of these Visitors was merely conveyed to Booth by Beatrice,2 though she herself stated in her autobiography that Booth followed Chamberlain's suggestion without any mention of her own part in informing Booth of the idea. 3
Thus, unobtrusively, the great project began. It had already been decided that the East End of London should be investigated first,
4 since this was generally agreed to be the area of greatest poverty. A preliminary survey of a sub-registration district containing about 20,000 people was made. The sub-registration districts were the smallest of the census districts. The largest were the ten divisions into which England and Wales were grouped; London formed a division which was split into thirty registration districts and then into 131 sub-registration districts. All these units varied greatly in size and the sub~registration district chosen was somewhat smaller than the average for such districts in London. The results and the method used in the investigation of the sub-district wa*2submitted in October 1886 to Professor Alfred Marshall, the Cambridge economist, for
criticism. Marshanrs reply has been lost but "it was presumably
1 Housing of the Working Classes. R. Com.._t:Un!i.s. Q.f Ev., p.443; GBPP 1884-5 (C.4402-I) xxx, 533.
2 T.S. and M.B. Simey, op. cit., p.80. 3 Beatrice Webb,
:My
AEprenticeshi~· p.228.5.
i \'\C\ v \ t''-/
encouraging since Booth promptly extended his,, to cover the whole of the Tower Hamlets" School Board Division.1 Excluding the City of London there were ten School Board Divisions in London, each being the unit of administration of elementary education in its area. The Tower Hamlets Division comprised the registration districts of Whitechapel, St. George's-in-the-East, Stepney, Mile End Old Town, and Poplar with a population estimated to be somewhat in excess of 450,000 in 1889.2
By June 1887 Booth was ready to lay the results of the inquiry into the Tower Hamlets School Board Division before the Royal
Statistical Society. Booth was a member of the Society and had read a paper to it the previous year.3 The Society had been founded in 1834 as the Statistical Society of London and it published the first volume of its Journal in 1838. It became the Royal Statistical Society in January 1887 and the Journal for that year tells us that the objects of the Society were to "collect, arrange, digest, and publish facts illustrating the condition and prospects of society in its material, social,and moral relations; these facts being for the most part arranged in tabular forms and in accordance with the principles of the numerical' method".4 Thus Booth was very much on home ground in the Society. His paper on the Tower Hamlets 5 was in
1 Ibid., p.86.
2 LL, I, ii, Appendix, Table II.
3 "Occupations of the People of the United Kingdom, 1841-81, being a re-statement of the figures given in the Census returns arranged to facilitate comparison", Journal of the Statistical Society, 1886, p.314.
4 (J]ournal of the [Rloyal (S1tatistical [S1ociety, 1887, p.453. 5 "The Inhabitants of the 'rower Hamlets ( School Board D:i. vision),
6.
the nature of a trial run; Booth was conscious of its imperfections but felt the time had come for his methods and aims to be submitted t o more exper scru iny. t t. 1
2
The discussion on the paper must have disappointed Booth to some extent. The distinguished members of the Royal Statistical Society showed themselves to have, on the whole, little more knowledge of the conditions of the poor than most of their wealthy contemporaries. Professor Leoni Levi, one of the most prominent economists and
statisticians of the century, had the "impression" that "poverty proper in the district which had been described was more frequently produced by vice, extravagance, and waste, or by unfitness for work, the result in many cases of immoral habits, than by real want of employment or low wages11•3 To be fair it must be stated that Levi
also suggested that some attempt should be made to include lower
class budgets, a suggestion which Booth followed with valuable results.4 But Levi's criticism did scant justice to Booth and his associates and showed all the defects of that "a priori reasoning" of political economists on the subject that Booth deplored. 5 The thirty-four School Board Visitors had been questioned for an average 19i hours on
6 the information that was to be found in their routine notebooks, and this information was checked, where possible, by obtaining a return
1 Ibid., pp. )27, 375, 401. 2 See .!lllli.§., 1887, pp. )92-401. J Ibid., p.J94.
4 See LL, I, i, PP• 1)1-145.
from the rent collectors for the main blocks of buildings in the area and by using the information contained in the police records of the registered co~on lodging houses.1
The basis of the structure that was now beginning to be built
7.
was the information furnished by the School Board Visitors, sometimes known as the school attendance officers. It was the function of these Visito~s to check on absenteeism and, more significantly, to assess the claims of particular families to a remission of the school fees. The Visitors performed a house-to-house visitation and they kept records of every house in every street, with details of every family in which there were children of school age. The scheduling of the children began two or three years before they reached school age and records remained in the Visitors' books after the children left school. According to Booth the Visitors had "a very considerable knowledge of the parents of the school children, especially of the poorest amongst them, and of the conditions under which they live".2 No doubt the Visitors varied in quality, while new men may not have been as knowledgeable about their district as men with many years' experience of the same area (although it seems reasonable to assume that they would still have their predecessors' notebooks). But we must agree that these Visitors provided the closest approximation to the modern field worker that existed in Booth's time. Certainly those Visitors who appeared before the Royal Commission on the Housing
of the Working Classes of 1884-5 demonstrated their ability to
1
answer specific questions about particular streets and houses. The information provided by these men was checked in a variety of ways when the sc6pe of the survey was widened to the whole of the metropolis. As we have already seen,each Visitor was cross-examined by Booth or one of his secretaries, a process in which neither the investigator nor the Visitor knew what the shape of the final structure would be and in which the prejudices of the various
8.
people involved tended to cancel each other out according to Beatrice Webb, who had attended some of these interviews.2 Then a first draft of the famous "poverty map" was drawn up. On this the various streets, or parts of streets (if they were long and varied widely in character), were coloured in the appropriate shade to denote their social character (starting, of course, with black). This draft was revised by Booth and his secretaries, who inspected each street to
judge its outward appearance, and by the Visitors themselves. Further revision was carried out by the parish relieving officers of each Poor Law Union, the members of the Charity Organisation Society, the police (for the streets coloured black), and the clergy
and their district visitors "for most of the poorer part". 3
To help him in the work of the survey Booth had a growing team of helpers. For the interviews with the School Board Visitors he
1 Housing of ·the Working Classes. R. Com. Mins. of Ev., pp.62-6, 142-6, 156-63, 174; GBPP 1884-5 (C.4402-I) xxx.
9.
used members of his own office staff, notably Jesse Argyle and G.E. Arkell who wa~also to play an important part in the series of investigations on the Industries of London. For the special topics that were included in the Poverty Series a number of outside helpers were recruited. The first of these was, naturally, Beatrice Potter who wrote on the Jewish Community in East London and the
organization of the docks. Another early recruit was Hubert Llewellyn Smith (1864-1945) who was one of the men from Toynbee Hall to join Booth's team. Smith, the son of a Quaker grocer, gained a first class in mathematical mo~erations in 1884 and a first class in the final school of mathematics in 1886 at Corpus Christi, Oxford. In 1893 he joined the Board of Trade and rose to the position of permanent secretary in 1907. He was responsible for the organ-ization of the labour exchanges, national insurance, and, in 1915, the Ministry of Munitions. From 1928 to 1935 he was the director of the New Survey of London Life and Labour. Another Toynbee Hall
~~~~
man who was to play a~ important part,after Booth himself, was Ernest Aves (1857-1917). Aves's first piece of work in the survey was a chapter on the furniture trade in the East End. In the Industry Series he did the whole section on the building trades and wrote about half of the concluding volume. Aves had gained a first class in the Moral Sciences Tripos in 1883 at Trinity College, Cambridge.
10.
Australia and New Zealand for the Home Office and carrying out special enquiries for the Board of Trade. Another man who helped Booth and later rose to prominence in the civil service was T. Graham Balfour (1858-1929).1 Balfour carried out a survey of Battersea using the same methods that Booth had applied in the East End.
Although trained as a lawyer he became a prominent leader of educational movements and became general director of education in Staffordshire.
Other persons of high ability involved in the survey were Clara Collet, G.H. Duckworth, Esme Howard, S.N. Fox and D.F. Schloss. Clara Collet was one of the first women graduates of the University of London and was later to be responsible for parliamentary returns on women I s work. Duckworth, later Sir George, did much of the work in the Industry Series and afterwards "distinguished himself in the Government service in various capacities11
•2 He brought in his friend, Esme Howard, who spent much of his career in the Foreign Office and who became a Privy Councillor, Ambassador to Washington (1924-JO) and first Baron Howard of Penrith. Fox and Schloss were both lawyers and both wrote chapters on the sweating trades in East London for the Poverty Series. Schloss was also a leader of the Jewish community.
Although the fact that these men and women of high tale:rtworked on the Survey proves that the whole Survey was not a "one-man job" but a coll eat ion of possibly divergent views, the actual work of assessing the extent of poverty in London was completed by Booth and
1
2
The Simeys confuse Balfour with his father Dr. T. Graham Balfour (1813-91) who chaired the meetings of the Royal Statistical Society for Booth's papers on poverty (see T.S. and M.B. Simey, op.cit., Esnfe0
11.
his secretaries unaided (with the exception of Balfour's work in Battersea). The methodology and results of this great inquiry must now be examined.
*
*
*
Booth first had to devise some means of classifying the vast amount of information which had been collected. This he did by dividing the population into four main classes with two sub-groups in each. The classes were:
"A. The lowest class of occasional labourers, loafers, and semi-criminals.
B. Casual earnings - 'very poor'. C. Intermittent earnings )
) together the 'poor'. D. Small regular earnings)
E. Regular standard earnings - above the line of poverty. F. Higher class labour.
G. Lower middle class. H. Upper middle class.111
Although there was supposed to be some qualitative difference between classes A and Bin that the first class was bordering on the criminal, we may take them together as the "very poor". Classes C and D form the "poor", Classes E and F the comfortable working classes and classes G and H the middle classes. Thus those"in poverty"
consisted of classes A to D inclusive and Booth's famous invention, the "poverty line", was drawn between classes D and E. Booth's
definitions of the very poor and the poor are worth quoting in toto for they have led to some confusion.
"By the word 'poor' I mean to describe those who have a sufficiently regular though bare income, such as 18s to 2ls per
12.
week for a moderate family, and by 'very poor' those who from any cause fall below this standard. The 'poor' are those whose means may be sufficient, but are barely sufficient, for decent independent life; the 'very poor' those whose means are insufficient for this according to the usual standard of life in this country. My 'poor' may be described as living under a struggle to obtain the necessaries of life and make both ends meet; while the 'very poor' live in a state of chronic want. It may be their own fault that this is so; that is another question; my first business is simply with the numbers who, from wha!ever cause, do live under conditions of poverty or destitution".
Clearly Booth's definitions were flexible ones. The poverty line was not marked at 2ls per week, though Booth has often been interpreted in this way. The poverty line was drawn between those who could barely manage to sustain a "decent independent life" according to the "usual standard of life" in a particular place and time (England in the 18801s and 18901s) and those who could sustain such a life with relative ease. That the line of poverty was not a rigid one (and therefore valueless) is conclusively demonstrated in the final volume of the Industry Series where Booth, after analyzing the wages returns for the eighty-nine trade groups into which he had divided the population, decided that his earlier figure of 2ls was
2
too low. In fact later analysis in this work will strongly suggest that it is almost impossible to give such a wage equivalent, certainly on the basis of the wages .. returns that Booth and his fellow
1 Ibid.
13.
investigators obtained.1
Of course an objection may be raised immediately: Booth's definitions may sound acceptable but did they mean anything in
practice. Certainly Booth recognized that his divisions into classes would necessarily be arbitrary.2 Moreover, some such classification has to be made if one is to be able to talk in terms of anything more than the vaguest generalities. Classification may lead to some distortion; it is sometimes avoided by those nervous of the results of categorizing people, fearful that in,,some way it will tarnish the greatness of the individual man. But classification is frequently too useful a tool to be discarded. The a priori arguments which sometimes form a substitute for criticism in modern historiography) must be discarded. The question is not "to categorize or not to categorize" but whether or not the given categorization is a useful and meaningful one.
Criticism which immediately carps at the definitions made by Booth is pointless but criticism which asks whether or not Booth
successfully carried out his plan is not. However, we are immediately faced with the problem that the accuracy of the figures contained in the §urvey is difficult to check - there is nothing comparable to the Survey which would provide us with an independent assessment of the extent of poverty in London. The vague, casual estimate provides no possible corrective but merely demonstrates the abysmal ignorance 1 See below, Chapters II and III.
2 LL, I, i, p.33.
11+.
of Booth's contemporaries and the pioneering nature of his work. Thus some of the normal methods of historical analysis, of balancing the evidence contained in various sources (or, to put it more
cynically, of safely steering a via media between conflicting
viewpoints), scarcely apply to the figures that Booth gives for the extent of poverty in London. It is clear that Booth's work must be approached in a different way: one must look for internal evidence which will either confirm or cast doubt upon the work's reliability. The lower hurdles have perhaps already been cleared: Booth's sources of information were probably the best available and he approached them with a critical eye, while his system of classification would seem a sensible one, in theory at least. But the high hurdles of successful achievement have yet to be attempted.
*
*
*
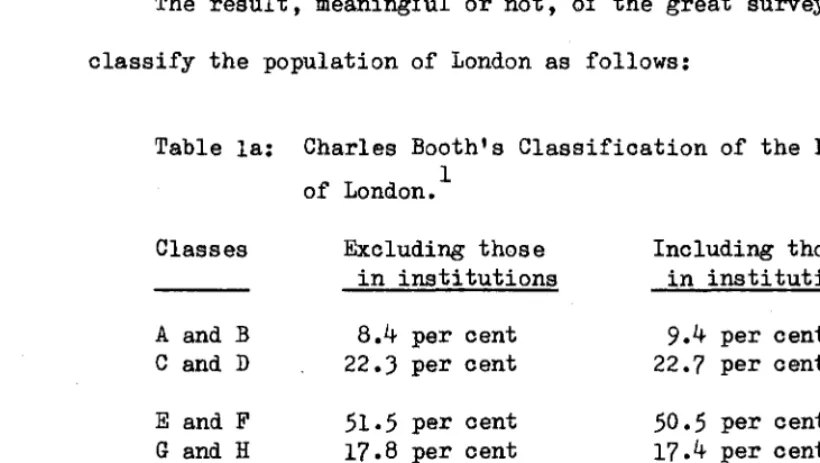
The result, meaningful or not, of the great survey was to classify the population of London as follows:
1
Table la: Charles Booth's Classification of the Population 1
of London.
Classes Excluding those Including those in institutions in institutions A and B 8.1+ per cent 9.4 per cent
c
and D 22.J per cent 22.7 per centE and F 51.5 per cent 50.5 per cent
G and H 17.8 per cent 17.4 per cent
[image:19.668.78.488.515.746.2]15.
Thus 32.1 per cent of the total population and 30.7 per cent of the population not in institutions were classified as living in poverty. But in fact what Table la shows is the proportion of the population with at least one child in the age.group three to thirteen which was living in poverty. For Booth had assumed, for the purposes of compiling statistics, that "as is the condition of the tested part
••• so is the condition of the whole population".1 Now the tested part consisted of those families containing at least one child in the specified age-group. It could well be questioned whether or not this "tested part" was representative of the whole population.
These doubts are not in any way dispelled by the fact that Booth was unusually vague about the proportion this sample bore to the whole population. In the paper on the Tower Hamlets Division he estimated the proportion at "from half to two-thirds of the whole population112 including the children, heads of families, their wives, and other children wholly or partly dependent on the heads of families. In
the first volume of the Survey this estimate drops to "fully one half". 3 The lower figure seems scarcely credible in an age of high mortality
(and hence ~f few old people, many of whom would in any case be in institutions) and large families. It would be statistical casuistry to classify various members of the same household in different classes -the family must be taken to be -the unit of poverty. Even the higher figure of two-thirds would seem a conservative estimate of the teated proportion.
1 LL, I, i, p.5.
16.
This is an important question for Booth believed, possibly correctly, that in fact the general condition of the population -including those families without any children in the three to thirteen age range - was somewhat better than that of the tested part. 1 There is a worrying element of doubt introduced here - what if the condition of the untested part was substantially different from the condition of those dealt with by the School Board Visitors? This confusion is not diminished by the fact that whereas in the
examples of streets given in the first volume of the Poverty Series those families without children in the specified age group had no classification assigned to them,2 those in the second volwne3 and the families in the samp}e blocks of buildings described in the third
4
volwne were classified. These classifications were carried out only for the sample streets and blocks of dwellings and were ignored in the final estimate since Booth reiterates that it is upon the school children (he includes those of just pre-school age in this rather misleading term) that the final figures are based.5
But the data on the sample streets and blocks of dwellings given in the second and third volumes make it possible to resolve these doubts. We took a count of 5822 classified persons,
6
of whom 4610(77 per cent) belonged to families in which there was at least one
1 Ibid.
2 See LL, I, i, pp.7-24.
J
See LL, I, ii, pp.46-225. 4 See LL, I, iii, pp.48-57.5
LL, I, ii, p.16.17.
child aged three to thirteen. Of these 4610, 28.5 per cent were classified by Booth as "very poor" and another 41.2 per cent as "poor", making 69.7 per cent living in poverty. The corresponding figures for the 1212 persons living in families with no such children were 18.0 per cent, J9.6 per cent, and 57.6 per cent. Clearly there is a significant difference between these two groups but the figures for all 5822 persons were 26.5 per cent, 40.9 per cent, and 6?.4 per cent. These figures are not substantially different from those of Booth's "tested part". Moreover, the sample is clearly not repre-sentative and the direction of the error introduced by this fact is undoubtedly towards exaggerating the difference between the two sets of figures. The figures for the total number of families with children in the three to thirteen age range in London were 8.4 per cent, 22.J per cent, and JO.? per cent. Thus in the selected
streets and blocks of dwellings there was a very high over-represent-ation of the very poor and a high over-representover-represent-ation of the poor. Among these groups large families tended to be the rule and so the picture is somewhat distorted. If the same relative reductions from the "tested part" to the total population found in the sample streets and blocks of buildings applied to the whole of London, then the figure of 8.4 per cent for the very poor would be reduced to ?.8 per
18.
must be repeated, were greatly over represented in the sample) and less so in Booth's "purple" and "pink" streets which better represented the general run of London's working-class streets. This analysis of sample streets and blocks, therefore, appears to show that even:c the small error of 0.8 per cent which Booth's method appears to have introduced is probably an over-estimate of the actual error.
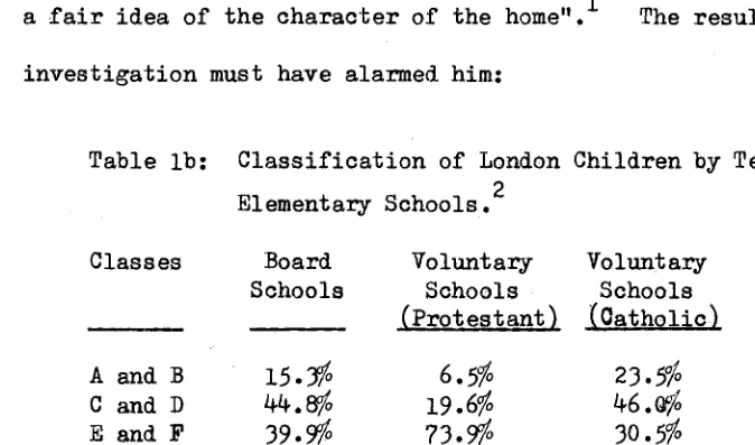
The last methodological hurdle has thus been cleared but there still remains the general question of the reliability of the figures Booth presents. Booth attempted to apply a number of tests himself. The first of these was an attempt to get the teachers in the elementary schools to classify ·their classes according to social status. Booth was hopeful that from the "regularity or irregularity of attendance, the condition in which the children come to school, the demands for remission of fees, and in many other ways, the teachers can, and usually do, acquire a very considerable knowledge of the parents, and a fair idea of the character of the home''. 1 The results of this investigation must have alarmed him:
Table lb: Classification of London Children by Teachers in
2
Elementary Schools. Classes
A and B C and D E and F Total
Board Schools
15.Y/o
44.8%
39.g1/p
441,609
1
LL, I, iii,p.195.
2
From LL, I, iii,p.199.
Voluntary Schools (Protestant)
6.5%
19.6%
73.Cf'/o
175,417
Voluntary Total Schools
(Catholic}
23.5%
13.2'/o
46
.<1/~
37.4%
[image:23.667.111.489.535.757.2]19.
Excluding the small number of children from classes G and H present in the above sample and scaling the rest in order to total 82.2 per cent for classes A to F (the total derived from the Visitors' reports), then 45.0 per ~ent of the population was classified as
being in poverty by the teachers,
11.B
per cent being classified as very poor.1 These figures, especially those for the poor, were substantially in excess of those derived from the School Board Visitors. However, this is not as serious a situation as it might at first appear. Firstly, the teachers were only asked to state the proportions of the various classes to be found among their pupils. As Booth said, "in such general statements there will be a tendency to exaggeration".2 This is especially likely since the teachers brought to the school a set of middle-class values which ill-fittedthem to understand the working-classes.3 Clearly Booth's test had failed. The difference between the estimates based on the information supplied by the School Board Visitors, who were full-time officials working amongst the poorer classes, and the estimates of the school teachers is understandable and it would seem incorrect to doubt the accuracy of the survey on the basis of the latter estimates. On the other hand, it cannot be claimed that the accuracy of the survey was confirmed by these estimates. But certainly we do not need to introduce the large element of doubt that Booth almost unconsciously did when he stated that "the teachers in distinguishing between class
1 From LL, I, iii, p.200. 2 Ibid., p.lOl.
) For a study of this problem in modern grammar schools see Brian
20.
and class may have drawn the lines of demarcation somewhat above the levels we have attempted to maintain. A very little change as to this would be enough to throw large numbers down from E to D and C, or from C to B11
•1
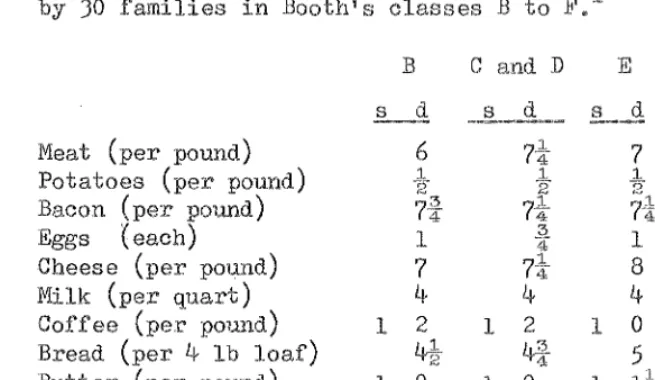
Booth's attempt to give substance to his figures by examining thirty selected families and their income and expenditure was m©re
2
successful. The first case was a family of five - a sick dock labourer, his consumptive wife, and 18 year old son and two girls aged 8 and
6.
The family lived in two rooms, neither more than 10 feet square and their diet consisted largely of bread, margarine, tea, and sugar. In five weeks only3
lbs. of meat were bought.3
Disturbing as it was, this case was by no means the worst that could be found in class B.4 The fifth case, also from class B, was that of a less unfortunate family. Yet even here "the only luxury(?) [was] an occasional bottle of ginger beer".5
The sixth case6 Booth regarded as fairly typical of those on the dividing line between class Band classes C and D. The man was a dock labourer earning 20s to 2ls a week. His wife occasionally did some work but was usually busy with their five children under 10 years of age. There was alsoa daughter, a domestic servant, who still received money and clothes from home. In five weeks the family consumed 40 lbs of meat,
1 LL, I, ii, p.201.
2 These family budgets are analyzed mare fully in Chapter II.
3
LL, I, i, p.140. 4 Ibid., p.141.25 lbs of fish, 150 lbs of potatoes, 172 lbs of bread, 15 lbs of flour, 6 or 7 lbs of butter, and 36 lbs of sugar, "besides minor
21.
matte:ris. This may not be choice fare, but there is something like plenty about it". It might seem so to Booth when such a long period is considered, but when broken down to the daily consumption of a family of seven (3 oz of butter, 18oz of meat, lloz of fish, 69 oz of potatoes, 79oz of bread per day) then there seems little of plenty about it except for the large consumption of bread and potatoes. The ten cases of class C and D families seem a little, thought not much, better. Bacon, eggs, and cheese were sometimes bought.1 The proportion of the family budget spent on bread tended to fall. These tendencies increased in the ten cases of class E and the four of class F. In the six class B families 13.4 per cent of the total income was spent on bread alone, this figure dropping slightly to 11.5 per cent in the ten class C and D families and to 7.7 per cent and 7.2 per cent for the ten class E and four class F families respectively.
The general impression to be gained from the thirty budgets presented by Booth is that there existed definite differences between the classes, though with some overlapping in the various divisions of expenditure (food, rent, etc.) Most importantly, the family budgets show that the classification system used was flexible and was not merely an attempt to describe the distribution of income. Further than that it would be perhaps dangerous to go, except perhaps to state
22.
that by present day standards it would appear unlikely that the original survey overstated the amount of poverty - it is apparent that "the usual standard of life" in Booth's time was still a low one.
Booth himself was clearly dissatisfied with the tests of reliability that he was able to apply in the Poverty Series. The 1891 Census provided him with much additional information and it was this information which was to give him what he regarded as the con-elusive test of the great survey. In the Census of that year the people wer~ for the £irst time, asked to state how many rooms they lived in. Although the word "room" was not defined - and therefore different people probably placed different interpretations upon it -this is not the problem that it might appear since the poor usually lived in only one or two rooms with no extra rooms such as kitchen, laundry, bathroom, or lavatory. Using the Census· information Booth was able to construct the following table:
Table le: Accommodation Conditions in London, 1891.1 Description
J or more persons per room 2 and under J persons per room Common lodging houses, etc.
1 From LL, II, i, p.10.
Percentage of the population
19.0) 0.5)
12.0)
) )
19.5
23.
1 and under 2 persons per room 23.4 ) )
Less than 1 person per room 3.7 ) )
Occupying more than 4 rooms 23.9 ) 56.4 )
Servants 5.0 ) )
Persons living in large shops,etc. 0.4 ) ) (Not
) Crowded) 4 or more persons to 1 servant 5.5 ) ) 68.5 3 or less persons to 1 servant 6.0 )
12.1 ) Inmates of hotels and boarding
o.6 ) )
houses where servants kept ) )
1
rhus, setting the level of "crowding" at two or more persons per room, the percentage of the population, excluding those living in institutions, classified as "crowded" (31.5) was very nearly the same as that classified as living in poverty (30.7). Moreover, those living 3 and under 4 per room were divided into two by Booth, one half being added to those living 4 or more persons per room and one half to those living 2 and under 3 persons per room and an even more startling connection emerged. The lower section of the crowded then totalled 340,000 persons (compared to 354,000 previously class-ified very poor) and the upper section 934,000 persons (compared to 938,000 classified poor).1
The correspondence between the poverty figures and the crowding figures was impressive, but it must be emphasized that Booth had really been very lucky. Although the crowding level that he set
2
became accepted it was as arbitrary as any of the definitions used in the Poverty Series. It might well have been found that the
1 LL, II, i, p.13.
24.
percentage of the populatipn in poverty corresponded to the percentage living more than 2.31 persons, say, to a room. It was convenient that the correspondence should come at an integer but, and Booth never realized this, no great significance could be attached to this fact by itself.
*
*
*
Thus criticism must be made even of the one test of reliability that it seems Booth felt was conclusive. To test his figures other methods will have to be adopted, though Booth himself provided some of the necessary data for the following analysis. Thia he did in the paper he read before the Royal Statistical Society in 1893.1 In this paper Booth presented a crowding index, which was the percent-age of the population living two or more to a room in each of the registration districts of London in 1891; the average birth rate in each registration district for the ten years 1881-90; the average death rate in each district for the six years 1885-90; an early marriage index, which was the number of married females under 25 per 10,000 of the p~pulation in each registration district in 1891; and the rate of natu.val, increase in the registration districts. This last was shown to bear no relationship to the percentage of poverty in the registration districts, but the other indices appeared to bear a relationship and thus could well have provided the independent tests that Booth had been seeking.
For some reason Booth dropped all these tests, except the version of the crowding index for the whole of London which has
already been examined, when he came to write the Industry Series. 1 25.
It is possible that he felt that he could not demonstrate as adequately as he would have wished the relationships between the indices.
Booth was a careful tabulator of facts but in his statistical reasoning he often showed great naivete. For example, as the percentage crowded and the percentage in poverty for the whole of London were very nearly equal Booth seems to have felt that some
such neat relationship of equality should hold for all the registration districts. This apparent naivete is, of course, due to the fact
that Booth did not have at his disposal the necessary statistical
tools to deal with the material that he had culled from the 1891 Census. Although theoretical statistics had made some advances by Booth's time the major practical applications were yet to be made. The main
interest of statisticians until the end of the nineteenth century still seems to have lain in the normal probability curve and its
applications to hypothesis testing.2 The principle of fitting a line to bivariate data had been discovered as far back as 1805 by the great French mathematician Legendre, but the name regression line was not given to this technique of curve-fitting for more than a century after Legendre's discovery. Moreover, correlation analysis was not developed
1 See LL, II, i, chapter I. The Simeys do not mention the additional data that was included in the 1893 paper (see T.S. and M.B. Simey, op. cit., pp.121-3).
2 For example see F.Y. Edgeworth, "Methods of Statistics11
26.
to any degree of sophistication until this century.
Even some of Booth's contemporaries who were professional
statisticians showed themselves to possess a rather primitive ability to deal with data. Thus Robert Giffen, President of the Statistical Society 1882-4 and chief of the statistical department of the Board of Trade, was prepared to argue in 1885 that by 1985 the population of the English race would be nearly 1,000 millions, merely on the basis of the overall increase between 1788 and 1885.1 Booth,
therefore, cannot be in any way criticized for not using the methods which were not available in his day.
However, the modern techniques of regression and correlation2 which have over recent years been applied by the new breed of
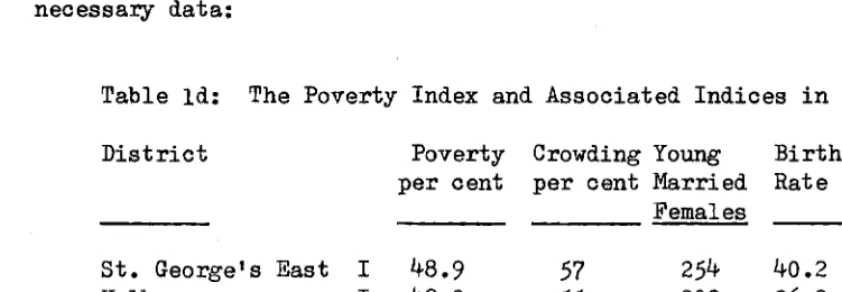
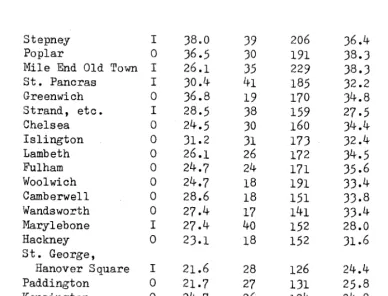
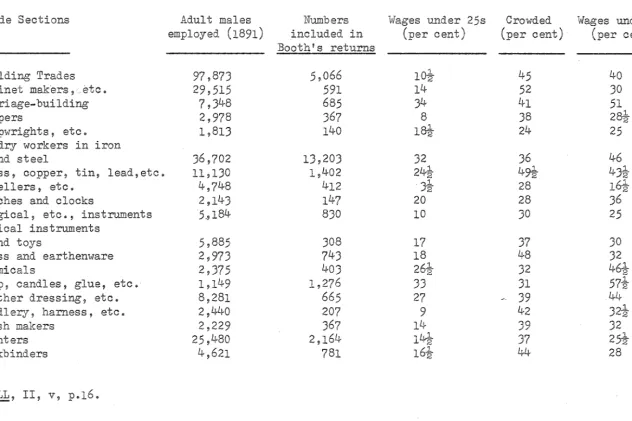
econometric historians may also be applied to social history. Using these techniques it is possible to test Booth's figures much more adequately then has been attempted so far. Table ld sets out the necessary data:
Table ld: The Poverty Index and Associated Indices in London.
1
District
St. George Is East Holborn
Whitechapel Bethnal Green Shoreditch St. Saviour St. Olave
I I I I I I I Poverty per cent
48.9 48.9 39.2 44.6 40.2 43.4 42.2
Crowding Young per cent Married
Females
----57 254
55
20954 242
49 223
49 217
42 213
35 240
Birth Rate 40.2 36.2 35.1 40.l 38.4 36.7 37.8 "Some General Uses of Statistical Knowledge", Journal of the
Statistical Society, 1885 (Jubilee Vol.), p.101.
2 For an attempt to explain these techniques see the Appendix.
[image:31.668.102.523.549.695.2]27.
Stepney I JS.O
39
206 J6.4 26.7Poplar 0 36.5 JO 191 J8.J 21.8
Mile End Old Town I 26.1 35 229 JS.J 21.9
St. Pancras I J0.4 41 185 J2.2 21.5
Greenwich 0 J6.8 19 170 J4.8 20.6
Strand, etc. I 28.5 JS 159 27.5 26.6
Chelsea 0 24.5 JO 160 J4.4 22.0
Islington 0 Jl.2 Jl 173 J2.4 19.6
Lambeth 0 26.1 26 172 J4.5 20.7
Fulham 0 24.7 24 171 35.6 20.1
Woolwich 0 24.7 18 191 JJ.4 18.6
Camberwell 0 28.6 18 151 JJ.8 19.2
Wandsworth 0 27.4 17 141 JJ.4 18.2
Marylebone I 27.4 40 152 28.0 2J.2
Hackney 0 2J.1 18 152 J1.6 18.4
St. George,
Hanover Square I 21.6 28 126 24.4 21.1
Paddington 0 21.7 27 131 25,8 18.1
Kensington 0 24.7 26 124 24.8 18.8
Lewisham 0 18.1 7 105 27.8 14.5
Hampstead 0 1J.5 16 104 2J.4 14.6
Table ld is a modified version of the Appendix to Booth's 1893 paper.1 A number of points in the Table need to be explained. Firstly, only 27 registration districts are included instead of the full JO into which London was divided. Following Booth the City of London has been omitted as "its population is so abnormal as to yield no results useful for comparison11
• 2
The population of the City was declining at such a rapid rate that all other demographic factors were likely to be thrown out of joint. Moreover, Booth did not give the number of married females under 25 per 10,000 of the population in the City; on this ground alone the City of London would have to be excluded. The other alteration that Booth made was to amalgamate the three
registration districts of the Strand, St. Giles and Westminster because they were contiguous, small, and because Booth did not have 1 "First Results of an Inquiry based on the 1891 Census", pp.592-J.
[image:32.666.137.525.79.375.2]28.
a complete set of separate figures for each of these districts.1 The second point that requires explanation is the fact that an I or an O has been placed by the name of each district. An I denotes that the district was in the inner eircle, an O that it was in the outer circle of London. The division of the districts into inner circle and outer circle follows that of the Registrar General in the 1891 Census. Unfortunately three districts2 straddle the dividing line - Marylebone, St. Pancras, and Lambeth. The first two were classified as inner circle as most of their sub-districts lay in the inner circle and both districts showed all the characteristics of inner circle areas (for example, in the decade 1881-91 the population of St. Pancras declined by 0.8 per cent and that of Marylebone by 8.0 per cent, while the population of all London increased by
9.7
per cent). Lambeth was classified as outer circle, mainly because of its geographical position. Its characteristics were all typical of London as a whole and therefore no great error will have been introduced by a possible mistake in classification. Thus there are 14 outer and 13 inner circle districts. 62 per cent of the population lived in outer and 38 per cent in inner London. 3 We may now proceed to analyze the figures contained in Table ld.The scatter diagrams constructed from Booth's Crowding Index (c)
and the Poverty Index (P) are given in Diagrams 1.1 and 1.2. The
1 Ibid.
c
60
50
40
JO
20
10
0
Diagram lel ~ Soatter~diagram of Boothis Poverty Index and the Crowding Index.
I
I
/
I
/
I
I
I I
0 0 0
a
00
0 0 00 0
0
0
10 20
JO
40I
I
I I
p
50
40
JO
20
10
0
Diagram 1.2 - Scatter-diagram of the Crowding Index and Booth's Poverty Index.
I I
I
I
0
0 0
I
0 I
0 I
0 I
0 00 0
OI
0
0
I I
I
5
10 15 20 25 JO35
40 45 5055
60JO ..
31.
first point to notice is that the correspondence between the inner circle registration districts (marked I on the diagrams) and high crowding is more marked than that between these districts and a high percentage of poverty. Of the 13 inner circle districts 12 have a higher crowding figure than any of the outer circle districts. For the poverty index this number drops to 8.
The equation of the regression line for diagram 1.1 is C = - 2 .4)57
+
l .1159P1the correlation coefficient being .790, which is significant at the .001 level. This equation is not greatly different from the simple equation
c
pfor which the correlation coefficient is .766. This does not
demonstrate very well the fact that in the central areas the percentage crowded tended to be greater than the percentage in poverty and that in the outer areas the reverse tended to be the case. It should be noticed also that the regression line does not divide the inner and outer circles evenly; only four of the outer circle areas lie above the line and only three of the inner circle areas below it. The regression line for Diagram 1.2,
P = 13.1007
+
.5607cdemonstrates better the relationship between the poverty index and the crowding index. This equation obviously differs substantially from the simple relationship
p =
c
for which the correlation coefficient is only .478.
)2.
That the relationship between the crowding index and the poverty index follows the pattern already suggested is best demonstrated by forming the linear regression for the difference between C and P and nP, where n
=
+
1 for inner circle districts and -1 for outer circle districts:C - P = .)529 + .1568nP
hence C = .)529
·+
P+
.1568nP n =±
1The last equation yields a high correlation coefficient of .874,
substantially in excess of the ordinary linear correlation coefficient (.790). This is probably as high a correlation as could be expected between the crowding index, which obviously is a reasonably valid
measure of poverty, and the poverty index. Moreover, the relationship that has been demonstrated corresponds to the relationship which we would expect to find if the poverty index is a reliable one - that is, if it accurately measures what it purports to measure. The pressure of population in the inner areas would tend to make the crowding figures higher than might normally be predicted from the amount of poverty in the areas, and vice versa for the outer areas. Thus the first test has proved successful - a high correlation between the crowding index and the poverty index has been established.
33.
The first of these indices is the early marriage index, that is the number of married females under 25 years of age per 10,000 of the population in each of the 27 registration districts.
The equation of the regression line for the poverty index and the early marriage index (see Diagram 1.3) is
MF = 61.4673
+
3.7234 Pthe correlation coefficient being .836. For the crowding index and the early marriage index (see Diagram 1.4) the equation is
MF = 99.4628
+
2.4240 Cthe correlation coefficient being .766. Thus the poverty index gives a substantially higher correlation than the crowding index, though both yield high correlations.
Unfortunately, when we pass to the birth rate we are faced with a number of problems. The first of these is that Booth did not make an adjustment for all the hospitals in the districts. Only in the case of Queen Charlotte's Hospital in Marylebone did he redistribute the births to their home districts; he considered that the other hospitals served only the local areas.1 We have to rely on Booth's good judgment here and our confidence in doing so must be increased by the fact that in the case of the death rate he did carry out a complete redistribution, reali2ing that the deaths in hospitals and other institutions substantially distorted the picture.2
The second problem is that there is a high correlation, as one would expect, between the early marriage index and the birth rate;
260
220
180
140
100
60
0
Diagram leJ - Scatter-diagram of the Poverty Index and Married Females under 25 per 10,000 of the population.
JI+.
I /
II
I I
I
0 0
I 0
0
00
0 I
0
IO
0 0I 0
0 0
10 20
JO
50
Diagram 1.4 - Scatter~diagram of the Crowding Index
and Married Females u.nder 25 per 10,000 of the population.
260
I
I I
I I
220
I
I I
0 0
I 180
0 00
0 I
8
I140
0
or
/ 0
0
100 ·
60
c
. , _ ~ ~ ~ ~ - - - 1 . ~ ~ ' - - ~ - ' - ~ - ' - - ~ - - ' - ~ _ _ . . _ ~ ~ ~ ~ ~ ~ ~ ~ ~ ~ ~
)6.
in fact the coefficient is .86. This would indicate that the two tests are not completely independent ones. This is true in only one sense - given the high correlations between early marriage index and the poverty index and between the early marriage index and the birth rate one would expect at least a reasonable correlation between the poverty index and the birth rate, though the level of that
correlation is by no means predetermined. Moreover, the high correlation between the crowding index and the early marriage index means that a correlation of .86 between the latter and the birth rate does not determine, or even suggest, which will be the higher of the two correlations poverty index birth rate and crowding index -birth rate. As this last is what we are mainly interested in the two tests are in fact independent ones for our purposes.
The regression equation between poverty and the birth rate (see Diagram 1.5) is
BR 20.7757
+
.3976 Pthe correlation coefficient being .761. The scatter-diagram shows a definite tendency to flatten at both ends and rise steeply in the middle. Choosing an arbitrary origin at BR= 201 when P = 0 it is possible to form such a regression curve, the equation being
log (BR-20) 1.5797 - 14"1420 p
the logarithms being to base 10 and the correlation coefficient being .814. Undoubtedly other origins could be chosen which would increase 1 It is implicit in this type of equation that an origin has to be
BR
40
35 ·
JO
25
20
15
Diagram
1.5 -
Scatter ... diagram of the Poverty Index and the Birth Rates.I
0 0 0
0
0
0 0 I 0
/
00
IO
I I
0
I
O I
I
I
1
37.
I
10 - - - ~ - - - - ~ - - - - ~ - - - ' - - ~ - - - - · - - ' - - - - t P
38.
the correlation still further, though not a great deal.
For the crowding index and the birth rate (see Diagram 1.6) the equation of the regression line is
BR = 27.1829
+
.1857 C.The correlation coefficient is .499, or well below even the linear coefficient for the poverty index and the birth rate (.761). Thus both the early marriage index and the birth rate show high correlations with the poverty index (in excess of .800), but only the early
marriage index has a high correlation with the crowding index. The test with the death rate gives, at first sight, a slightly different picture. The death rate given in Table ld is not the same as that given by Booth. Both allow for the redistribution of deaths in institutions to their own districts, but the index in Table ld is also adjusted to a standard population (that of England and Wales).1 This was done to remove any excessive vagaries due to an unusual age-distribution of the population in a given district, thus placing the various death rates on a standard basis. Booth's figures are accurate for the redistributed crude death rate, the only exception being
2
Marylebone whose crude death rate was given as 14.2 , the correct figure being 21.4 (the possibility of a typographical error at some stage of Booth's calculations seems a very strong one).
1 The calculations are based on the Supplement to the 5Sth Annual Report of the Registrar General, p.xli and pp.97-126; GBPP 1895
(c.7769) xxiii Pt.I. Information was available for the six years 1885-90, but not for the full intercensal decade 1881-90.
BR
20 '
1.5
Diagram 1.6 .... Scatter-diagram of the Crowding Index and the Birth Rates.
0
0 0
00
0
0
()
0
0 0
I
I
I
I
0 I
I I
39.
I
I
40.
For the poverty index and the standard redistributed death rate (see Diagram 1.7) the regression equation is
DR 11.6395
+ .
3201 Pthe correlation coefficient being .805.
The regression equation for the crowding index and the death rate (see Diagram 1.8) is
DR = 1).8326 + .2417 C.
Here the correlation coefficient is .855. Thus for the whole of London the crowding index shows a higher correlation than the poverty index with the death rate, through the latter is still a high
correlation. A closer examination of Diagrams 1.7 and 1.8 suggests that this is because of the high correspondence between the upper
half of the death rates and the inner circle of London, a correspondence which it has already been noted exists for the crowding index. This correspondence of high death rates and location in the inner circle is not surprising - the high rate of human contact caused by living in crowded quarters in a small area no doubt facilitated the spread of all infectious diseases.
A final two-stage regression was carried out between the poverty index and the other four indices giving the equation
P = -18.146627 + .127677c + .045368MF
+
.546590BR+
.879686DR.DR
30
25
20
15
10
Diagram l $ 7 - Sca·tter .. diagram of the Poverty
Index and the Death Rates.
I I
I I
I () I
0 I
0 0
0
0
0 0
0 0
0 0
0 0
10 20
JO
40I
I I
I I
p
DR
30
25 ·
20
15 ·
Diagram 108 ~ Scatter~diagram of the Crowding Index and the Death Rates~
1I
I
/ /
/
/
II I
8
I I I0 0
0
0 0
0 0
0
0 0
42.
I
I
4).
excellence of Booth's sources of information, the care shown in cross-checking the information, and the fact that the percentage in poverty for the whole of London equalled the percentage crowded, the last term being defined at a level which became generally accepted, then the somewhat artificial, though useful, division between
"validity" and "reliability" which statisticians make can be ignored. Our faith in the Booth Survey is strengthened further when we turn to an analysis of the inner and outer circles separately. We may expect that a reduction in the number of cases will reduce the correlations. Certainly this happens in the case of the poverty
index and the crowding index. For the whole of London the correlation coefficient was .790. For the inner circle it remains at .78) but drops to .L~45 for the outer circle. This latter correlation is not significant at the
.05
level. This should not be surprising and in no way casts doubt upon the reliability of the poverty index. It is in the outer areas, where space was greater and rents lower that we would expect sometimes to find poverty unaccompanied by crowding, though this tendency would act with greatly varying force in thedifferent areas. Hence the acid test of the poverty index, especially when compared with the crowding index as a true index of poverty,
comes when we consider the inner and outer circles separately, with the latter carrying the casting vote.
coefficients are set out below.
44.
Table le: Correlation Coefficients between the Poverty Index and the Crowding Index and other indices of poverty in the i:rr..'ler circle.
Poverty Crowding
Early marriage index
.748
.602Birth rate
• 753
.565
Death rate .62L~
.557
Table lf: Correlation Coefficients between the Poyerty Index and the Crowding Index and other indices of poverty in the
outer circle.
Poverty Crowding
Early marriage index
• 7)5
.516
Birth rate
• 777
.296
Death rate
.764
.758
These tables demonstrate conclusively the greater validity of the poverty index as a measurement of poverty. Only one of its six correlations (that with the death rate in the iru1er circle) is not significant at the .01 level, although even this one is significant at the
.05
level. On the other hand, only one of the correlation coefficients of the crowding index (that with the death rate in the outer circle) is significant at the .01 level and another four (early marriages in both circles, the birth rate in the inner circle, andthe death rate in the inner circle) are only just significant at the
.05 level. The correlation coefficient between the birth rate and the crowding index in the outer circle is not even significant at