Automatic segmentation of brain tissue based on improved
fuzzy c means clustering algorithm
Zhuang Miao1, Xiaomei Lin2, Chengcheng Liu2
1Department of neurosurgery, China-Japan Union Hospital, Jilin University, Jilin, China;
2Institute of electrical and electronic engineering, Changchun University of Technology, Changchun, China
Email: [email protected], [email protected], [email protected] Received 9 November 2010; 12 November 2010; 23 November 2010.
ABSTRACT
In medical images, exist often a lot of noise; the noise will seriously affect the accuracy of the segmentation results. The traditional standard fuzzy c-means(FCM) algorithm in image segmentation do not taken into account the relationship the adjacent pixels, which leads to the standard fuzzy c-means(FCM) algorithm is very sensitive to noise in the image. Proposed im-proved fuzzy c-means(FCM) algorithm, taking both the local and non-local information into the standard fuzzy c-means(FCM) clustering algorithm. The ex-periment results can show that the improved algo-rithm can achieve better effect than other methods of brain tissue segmentation.
Keywords: Local Information; Non-local Mean; Brain Tissue Segmentation
1. INTRODUCTION
Image segmentation is the key technology in image processing and analysis .In the medical field, with the imaging technology development and medical imaging application success in the clinical, image segmentation is playing an increasingly larger role. On the MRI (mag-netic resonance imaging) brain images in the white mat-ter (WM), brain gray matmat-ter (GM) and cerebrospinal fluid (CSF) such as the organizational structure of the correct segmentation in medical applications is of great significance. However, there is a lot of noise; the noise will seriously affect the accuracy of the segmentation results. The traditional standard FCM algorithm in image segmentation do not taken into account the relationship adjacent pixels, which leads to the standard FCM algo-rithm is very sensitive to noise in the image. Although some noise in the image can be removed in split before use of smoothing filters and other methods of, but in most cases, this approach is unwise, because some of the
details in the image and edge information and noise may also be removed together by some standard filters. In order to reduce image noise affect to image and better for the partition of the segmented image, here we pro-pose a new algorithm in this chapter, in the propro-posed new algorithm, take both the local and non-local infor-mation into the standard FCM clustering algorithm.
Non-local means algorithm (NL Means), who by Buades and other peoples as image denoising algorithm first proposed [1,2]. This algorithm attempts to use the image height of the redundant information to complete the work of digital image denoising, in other words, for each pixel in the image, we can find a lot of images with which had the same structure of adjacent domains sam-ples, then we are dealing with these redundant pixels to be weighted average of the sample. Experimental results show that non-local means algorithm can successfully remove the image noise at the same time save the image in the more complete boundary information. However, in medical images, the boundary between different organi-zations is often blurred, and the details of the image, redundant information is not always present. In order to protect the image of the fine structure and details of the information and made them not be destroyed, in the use of non-local means algorithm at the same time, local information should also be considered.
2. AUTOMATIC SEGMENTATION ASED
ON IMPROVED FUZZY C MEANS
CLUSTERING ALGORITHM
2.1. Improved Fuzzy C Means Clustering Algorithm Distance Function
algo-
2
rithm in this chapter, we will distance function in the standard FCM rewritten as
2 , 1 2 , ,
j i j l j i j nl j
D x v d x v d x vi (1)
Among them, is the distance by the impact of lo-cal information, nl has been affected by the
dis-tancenon-local information,
l d
d
j
is used to control the proportion parameters between these two diatances, the valur range is [0,1]. For a pixel xi, i is selected with
fixed-size local neighborhood structure, if the k N
x in the i is very close to a pixel gray value of, the center
pixel then i N
x should be affected largely by it,
Other-wise, its impact should be very small to xi. According
to the above description, the distance formula affected by the local neighborhood information is:
2 2 , , , , k j k jl k j k i
x N l j i
l k j x N
w x x d x v
d x v
w x x
(2)Where, is the weightin in the neighbor-hood of each pixel,defined as:
,
l k j
w x x
2 2 , k j x x l k jw x x e
(3) Formula (3) is the variance of pixel gray value in the neighborhood , use it to control the bending degree of curve. i
N
All the distance dnl affected by the non-local informa-tion is the weighted average in all pixel input image I, calculated as:
2 , , 2
k
nl j i nl k j k i x l
d x v w x x d x v
,
(4) Among them, the weighted values isdetermined by
,
nl k j
w x x
j
x , xk the similarity of pixels to
2
. Generally speaking, wnl, wnl
x xk, j
satisfy thefol-lowing conditions:
0wnl x xk, j 1,
,
k
nl k j x l
w x x
2.2. Improved Fuzzy C Means Clustering Algorithm Weight
The similarity of Pixel xk and xj is determined by
the gray value the degree of similarity the vector v N
kand v N
j of, the two the similarity of vectors isde-scribed as a weighted Euclidean distance, among them a is a Standard deviation of the Gaussian kernel function, and meet a > 0 If a pixel structure of the neighborhood
with similar structure to the gray neighborhood xj
Then the pixel is relatively large weight, that should be a
relatively large impact xj. Weight is calculated as:
,
1nl k j k j
j
,x x U x x
Z x
(5)
Among them U x
k,xj
is the similarity of theexpo-nential form, Z x
j for the regularization constraints
2 2, 2
,
k j a
v N v N
h k xj
U x e
(6)
2 2, 2k j a
v N v N
h j
k
Z x e
(7) Parameter h is the control parameter, which controls the degree of exponential decline, the same, and also control the recession of the Euclidean distance weight function. For convenience of calculation, for the search similar to neighborhood structure is often limited to a program called “search window”, use i. For example, in [3]
experiments, the size of neighborhood is defined as the 7
×7 square, the search window size is set to 21 × 21.
To determine the parameters ji in the formula (1),
proposed called “sorting means algorithm” approach in here. This algorithm and Garnett and other peoples [4] proposed statistical method is very similar to ROAD. Suppose xj is the pixels we have to consider, the size
of the search window i is S × S, for each pixel in
the search window, by the formula (6) to calculate the index of similarity, and then descending order of their values, then the pixelsthe balance parameter xj is
de-fined as:
1 ,
1
m
j U x xi k j
m
i
(8) Among them, Ui ranking in the search window is theU-value of i first big, m value is defined as m = S- 1.
3. EXPERIMENTAL RESULTS
In this section, the improved FCM algorithm is applied to synthetic square image, include simulated brain im-ages and real brain imim-ages, and results were compared with the expansion of the standard FCM algorithm. In experiments, additional brain tissue (such as the cerebral cortex, fat, etc.) has been removed before the split.
3.1. MRI Images
save the image in detail, we set the parameters h = 500,
the neighborhood size Nj = 3 × 3, the search window size Ωi = 7 × 7.
Figure 1(a) contains a 9% noise images of brain
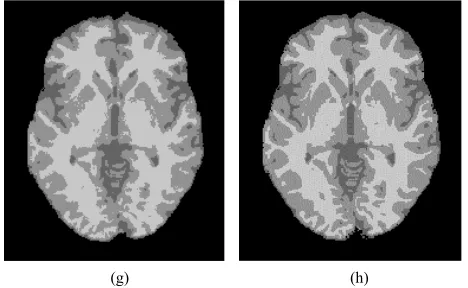
slices, using the standard FCM, FCMSI, IFCM, RFCM and ASFCM image segmentation algorithm, the results were as shown in Figure 1(b) toFigure 1(f). Figure 1(g)
is the use of segmentation algorithms proposed in this paper, after the results. Figure 1(a) The Ground Truth as
shown in Figure 1(h).
To test the proposed algorithm in this paper in dif-ferent noise levels in the segmentation results, we conducted the following comparative experiments.
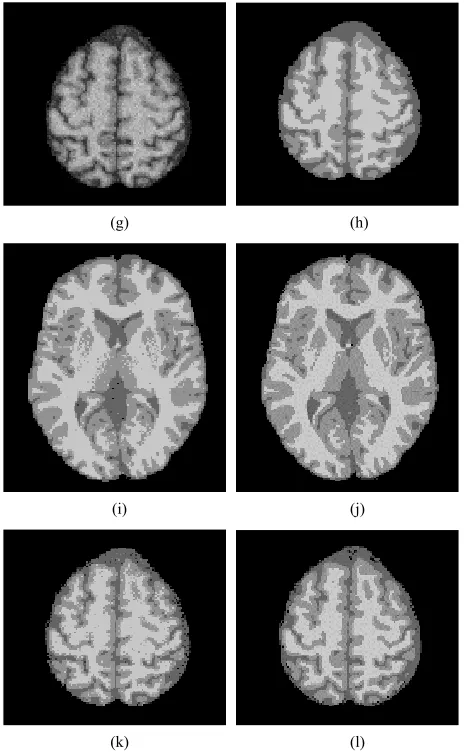
Figures 2(a), (e) and (i) respectively, contain 3%, 5%
and 7% of the noise of the MRI brain images, using segmentation algorithm proposed in this chapter, the results are, respectively, Figures 2(b), (f) and (g). These
(a) (b)
(c) (d)
(e) (f)
[image:3.595.308.542.79.223.2] [image:3.595.56.541.296.729.2](g) (h)
Figure 1. MRI brain images of different methods of comparing
the results of Segmentation (a) brain image (z = 70) damaged by 9% noise, (b) FCM. (c) FCMSI. (d) IFCM. (e) RFCM. (f) ASFCM. (g) The proposed method in this paper. (h) Ground Truth.
(a) (b)
(c) (d)
(g) (h)
(i) (j)
(k) (l)
under differe
sults with the standard FCM segmentation results and rithms are applied in the differe no
ing and subjective factors, the good repeatability. Therefore, automatic segmentation
NCES
[image:4.595.55.287.78.454.2]B. and Morel, J.M. (2005) A non-local ge denoising. IEEE Computer Society
Figure 2. Segmentation results nt noise levels
compared (a), (e) and (i) contain 3%, respectively, 5% and 7% of the noise of the image. (b), (f) and (j) are the application of the segmentation algorithm proposed. (c), (g) and (k) are the segmentation results. (d), (h) and (l) are Ground Truth.
re
Ground Truth compare the accuracy of our method can obviously be shown.
Next, the six algo nt
ise levels of the three-dimensional brain image seg-mentation; this division is carried out by the order biopsy. It can be seen, when the image does not contain noise or low noise level, all the results generated by those algo-rithm are the same but with the noise level enhanced, in contrast to several other algorithms, the segmentation algorithm proposed in this paper.
4. CONCLUSION
Because of time-consum
artificial segmentation of brain MR images results is not
method of brain tissue is needed to complete the Auto-matic segmentation of MR images. But the morphology of brain tissue structure for the complex maneuver, combined with noise, partial volume effect (PVE) and image bias field (BF) existing the division of their or-ganization with strong pixel ambiguity and uncertainty, which makes the fuzzy clustering compared to other technologies are more widely used in brain MR image segmentation. In this paper, proposed a modified fuzzy C means clustering algorithm. In medical images, there is often a large noise to exist. The noise can seriously affect the accuracy of the segmentation results. This method use of non-pixel neighborhood information to suppress the image of the noise, through a new distance calculation method to replace Euclidean distance meas-ure algorithm of the traditional fuzzy C means to achieve the process of denoising in the during division. Through a large number of experiments and different algorithms comparison, proved the validity and correctness of the algorithm.
REFERE
[1] Buades, A., Coll, algorithm for ima
Conference on Computer Vision and Pattern Recognition, 2, 60-65.
[2] Buades, A., Coll, B. and Morel, J.M. (2004) On image denoising methods. Technical Report 2004-15, CMLA. [3] Garnett, R., Huegerich, T., Chui, C. and He, W.J. (2005)
A universal noise removal algorithm with an impulse de-tector. IEEE Transactions on Image Processing, 14, 1747-1754. doi:10.1109/TIP.2005.857261
[4] Johnston, B., Atkins, M.S., Mackiewich, B., et al. (1996) Segmetation of multiple selerosis lesions in intensity corrected multispectral MRI. IEEE Transactions on Medical Imaging, 15, 154-169. doi:10.1109/42.491417 [5] Suri, J.S., Singh, S. and Reden, L. (2002) Computer
vi-sion and pattern recognition techniques for 2D and 3D MR cerebral cortical segmentation (Part I): A state-of- the-art review. Pattern Analysis & Application, 5, 46-76.
doi:10.1007/s100440200005
[6] Suri, J.S., Singh, S. and Reden, L. (2002) Fusion of re-gion and boundary/surface-based computer vision and pattern recognition techniques for 2D and 3D MR cebral cortical segmentation (Part II): A state-of-the-art re-view. Pattern Analysis & Application, 5, 77-98.
doi:10.1007/s100440200006
[7] Kapur, J.N., Sahoo, P.K. and Wong, A.K.C. (1985) A new method for gray-level picture thresholding using the en-tropy of the histogram. Computer Vision, Graphics and Image Processing, 29, 273-285.
doi:10.1016/0734-189X(85)90125-2
[8] Abutaleb, A.S. (1989) Automatic thresholding of gray- level pictures using two-dimension entropy. Computer Vision, Graphics and Image Processing, 47, 22-32. [9] Styner, M., Brechbuhler, C. and Szckely, G. (2000)
MRI. IEEE Transactions on Medical Imaging, 19, 153-165.
doi:10.1109/42.845174
[10] Bezdek J. (1980) A convergence theorem for the fuzzy ISODATA clustering algorithms. IEEE Transactions on
Pattern Analysis and Machine Intelligence, 2, l-8.