warwick.ac.uk/lib-publications
Original citation:
Parker, Alexander S., Al Botros, Rehab, Kinnear, Sophie L., Snowden, Michael E., McKelvey,
Kim M. (Kim Martin), Ashcroft, Alexander T., Carvell, Mel, Joiner, Andrew, Peruffo, Massimo,
Philpotts, Carol and Unwin, Patrick R.. (2016) Combinatorial localized dissolution analysis :
application to acid-induced dissolution of dental enamel and the effect of surface
treatments. Journal of Colloid and Interface Science, 476. pp. 94-102.
Permanent WRAP URL:
http://wrap.warwick.ac.uk/81648
Copyright and reuse:
The Warwick Research Archive Portal (WRAP) makes this work by researchers of the
University of Warwick available open access under the following conditions. Copyright ©
and all moral rights to the version of the paper presented here belong to the individual
author(s) and/or other copyright owners. To the extent reasonable and practicable the
material made available in WRAP has been checked for eligibility before being made
available.
Copies of full items can be used for personal research or study, educational, or not-for-profit
purposes without prior permission or charge. Provided that the authors, title and full
bibliographic details are credited, a hyperlink and/or URL is given for the original metadata
page and the content is not changed in any way.
Publisher’s statement:
© 2016, Elsevier. Licensed under the Creative Commons
Attribution-NonCommercial-NoDerivatives 4.0 International http://creativecommons.org/licenses/by-nc-nd/4.0/
A note on versions:
The version presented here may differ from the published version or, version of record, if
you wish to cite this item you are advised to consult the publisher’s version. Please see the
‘permanent WRAP URL’ above for details on accessing the published version and note that
access may require a subscription.
1
Combinatorial Localized Dissolution Analysis: Application to Acid-induced
Dissolution of Dental Enamel and the Effect of Surface Treatments
Alexander S. Parker,†
aRehab Al Botros,†
aSophie L. Kinnear,
aMichael E. Snowden,
aKim McKelvey,
aAlexander
T. Ashcroft,
bMel Carvell,
bAndrew Joiner,
bMassimo Peruffo,
cCarol Philpotts,
cand Patrick R. Unwin
a*a Electrochemistry and Interfaces Group, Department of Chemistry, University of Warwick, Coventry CV4 7AL. b Unilever Oral Care, Quarry Road East, Bebington, Wirral CH63 3JW, UK.
* Corresponding author: Patrick R. Unwin, Electrochemistry and Interfaces Group, Department of Chemistry, University of Warwick, Coventry CV4 7AL, UK.
† These authors contributed equally to this work
A combination of scanning electrochemical cell microscopy (SECCM) and atomic force microscopy (AFM) is used to quantitatively study the acid-induced dissolution of dental enamel. A micron-scale liquid meniscus formed at the end of a dual barrelled pipette, which constitutes the SECCM probe, is brought into contact with the enamel surface for a defined period. Dissolution occurs at the interface of the meniscus and the enamel surface, under conditions of well-defined mass transport, creating etch pits that are then analysed via AFM. This technique is applied to bovine dental enamel, and the effect of various treatments of the enamel surface on acid dissolution (1mM HNO3) is studied. The
treatments investigated are zinc ions, fluoride ions and the two combined. A finite element method (FEM) simulation of SECCM mass transport and interfacial reactivity, allows the intrinsic rate constant for acid-induced dissolution to be quantitatively determined. The dissolution of enamel, in terms of Ca2+ flux (𝑗
𝐶𝑎2+), is first order with respect to the interfacial proton concentration and given by the following rate law: 𝑗𝐶𝑎2+ = 𝑘0 [𝐻+], with 𝑘0= 0.099 ±0.008 cm.s-1. Treating the enamel with either fluoride or zinc slows the dissolution rate, although in this model system the partly protective barrier only extends around 10-20 nm into the enamel surface, so that after a period of a few seconds dissolution of modified surfaces tends towards that of native enamel. A combination of both treatments exhibits the greatest protection to the enamel surface, but the effect is again transient.
Introduction
The dissolution of solid materials is an area of significant interest1 across many fields, including the earth sciences,2, 3 corrosion
science,4 and the life sciences, 5 as well as in chemistry.6-12 Studies of the mechanism and kinetics of dissolution processes are
important for both fundamental understanding and for various technical applications. This area requires methodologies that can probe dissolution under conditions of high and well-defined mass transport,13 so that surface kinetics can be extracted free from
convolution from mass transport.13, 14 This means that dissolution experiments must deliver sufficiently high and well-defined
mass transport rates that surface kinetics are manifest in the measurement.
This paper describes a powerful combinatorial approach for dissolution studies, in which a large number of micron scale measurements are made rapidly on a small area of a single sample surface, for which different portions have been treated in different ways. The focus is on the acid-induced dissolution of dental enamel as an exemplar system, and one which is also of significant interest. Enamel is the hardest mineral found in the human body,15 forming the outer protective layer of teeth. Its
main component is calcium hydroxyapatite (HAP, Ca10(PO4)6(OH)2) which makes up more than 95% of enamel by weight,16 with
the remainder comprised of a matrix of organic molecules, macromolecules and water.17 Dental enamel is constructed from rods
or prisms, each containing a tightly packed mass of HAP nanocrystallites in a highly orientated and organised structure.18 Once
formed, enamel has no vascular or nerve system, and can only regenerate minerals through remineralisation processes in the oral cavity.19 Conversely, the enamel layer can be affected adversely through acid-induced dissolution processes associated with
dental caries or erosion from the modern diet.20-22
Acid attack of HAP is reasonably described by the following reaction:23
Ca10(PO4)6(OH)2 (S) + 8H+(aq) ⇌ 10 Ca2+(aq) + 6HPO42-(aq) +2 H2O (1)
This is the primary process of tooth demineralization: protons react with HAP, which releases Ca2+ and HPO42- ions into the
solution,15, 24, 25 coupled with further solution processes (vide infra).
2
main approach, with well-defined mass transport, used in studies of enamel and HAP dissolution is the rotating disk (RD) method.27-33 However, while RD method it is often restricted to bulk solution measurements which places severe limitations on
the time and spatial resolution of the technique.13 This is particularly detrimental for the investigation of surface treatments that
have a transient (temporary) effect, which may be short lived. To elucidate such effects requires methods with high time resolution. In terms of spatial resolution, a number of studies have used high resolution microscopy to study enamel dissolution at the nanoscale20, 34-41 However, with the exception of scanning electrochemical microscopy,40 the approaches often have
rather low mass transport rates and all require the sample to be exposed to solution for long periods, making it difficult to monitor transient effects on dissolution, such as the influence of surface treatments.
Several treatments have been used to protect enamel from acid dissolution.42, 43 It is well documented that treatment of enamel
with fluoride results in a surface layer of fluoridated hydroxyapatite and fluorapatite44-47 which resists acid attack better than
natural enamel,48, 49 thus inhibiting demineralization.48, 50 The effect of Zn2+ treatment of enamel also decreases the loss of Ca2+
and PO43- ions from the surface. The binding of Zn2+ is proposed tolead to the precipitation of an apatite-like phase, and the
formation of a zinc complex at the surface of enamel has been suggested.47, 51-54
The work presented here employs a new approach for the study of dissolution processes, coupling localized measurements with high and controlled mass transport through the use of SECCM. 55-59 The aim is to demonstrate the methodology and to gain a
better understanding of the acid induced dissolution process on enamel surfaces as well as the effect of treating the enamel surface with zinc and fluoride. Localized dissolution is achieved by confining the experiment to the meniscus of a pipette with a diameter ca.1 µm, and making a series of such measurements, with different exposure times, across the surface. Migration of ions in the probe geometry allows fast surface kinetics can be investigated.56 In essence SECCM is used as a tool to allow very
fine control of the delivery of acid to the enamel surfaces resulting in localized etch pits. These dissolution etch pits are then analysed using AFM and, using a finite element method (FEM) simulation, the intrinsic rate for proton induced dissolution (Ca2+
release) is extracted. We have presented preliminary data using this method as part of a multi technique approach to elucidate a new treatment for enamel erosion that was presented in a special issue.60 Here, we apply the technique in much more detail to
common treatments of dental enamel, highlighting the spatial resolution of the approach and developing a full theoretical model to quantitatively analyse data.
Experimental details
Solutions
All solutions were prepared using resistivity 18.2 MΩ cm (25°C) water (Purite). Etching solutions (50 mM KNO3 and 1 mM HNO3
(Sigma-Aldrich)) were prepared daily (pH 3.3, Denver Instruments UB-10 pH meter). Zinc salt solutions used for enamel pretreatment were made using 1000 ppm of Zn2+ from ZnCl2 (Sigma-Aldrich). Fluoride solutions for enamel pretreatment were
1000 ppm of F- using NaF (Sigma-Aldrich).
Sample preparation
Bovine enamel samples were received from Unilever as 36 mm2 area blocks polished to a 3 µm root mean squared (rms)
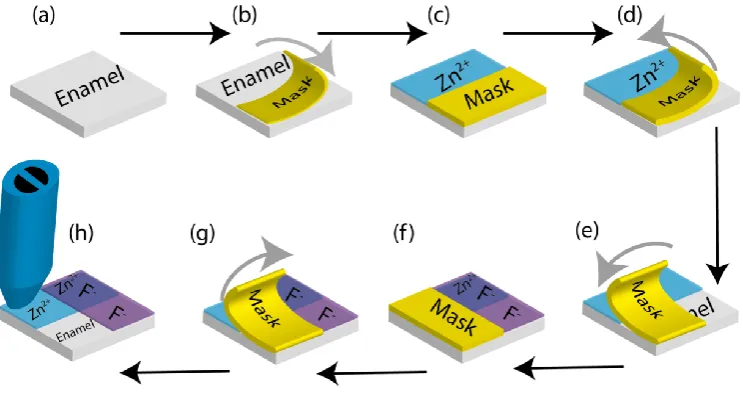
roughness, as measured by AFM (Bruker). The samples were then further polished using diamond lapping particles on a silk polishing pad, starting with 3 µm sized particles and slowly working down to 50 nm (Buehler). The polishing was carried out until a mirror finish was achieved with an rms of 1.5 ± 0.6 nm measured by AFM. Three different treatments were applied to each enamel block, one treatment per section, with rinsing of the sample in Purite water between treatments. To selectively treat a particular section, a low tack polyester tape (3M) was used to protect all but the area of interest, before submerging the sample in the treatment solution for 2 minutes (see Fig 1). The treatments used were 1000 ppm F-, 1000 ppm Zn2+, and a sector of the
3
Fig 1: Representation of the localized treatments applied to an enamel block: a) Enamel block polished before any treatment applied; b) Half the sample masked off
with polyester tape; c) Zn2+ treatment applied to sample; d) Polyester mask removed; e) Mask reapplied at 90° rotation; f) Zn2+ treatment applied to sample; g) Mask
removed; h) the final surface studied by SECCM.
SECCM method
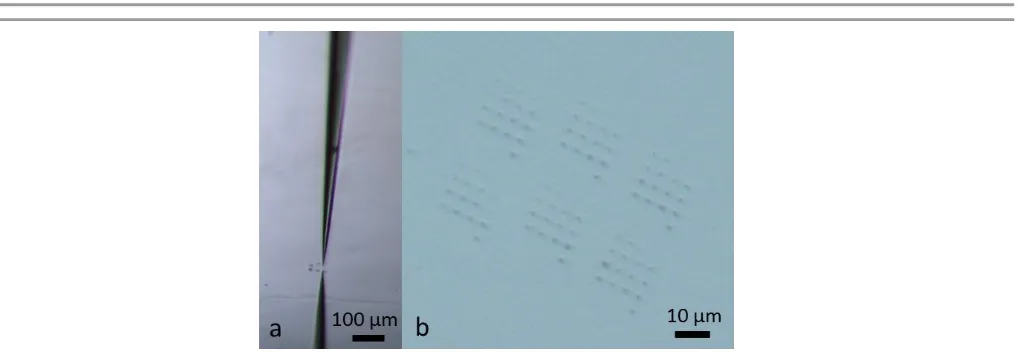
The SECCM tips used were fabricated from 1.5 mm diameter borosilicate theta capillaries (Harvard Apparatus) that were pulled to a sharp point using a P-2000 laser puller (Sutter Instruments Co.). After pulling, the tip of the resulting pipette was oval and approximately 800 nm across the main axis. A representative tip is pictured in Fig 2(a). Each pipette was filled with the etching solution and a quasi-reference counter electrode (QRCE) comprising an AgCl-coated Ag wire was inserted into each barrel.
The SECCM technique was set up as recently described.59 The pipette was positioned close to the enamel surface using a manual
micrometer system (M-461 series, Newport) aided by a digital camera (Pixelink). Fine positioning of the pipette was achieved using a piezoelectric positioner system with a range of 38 µm normal to the substrate, in the z-axis (P-753.3CD positioner, Physik Instrumente) and 300 µm parallel to the substrate in the x- and y-axes (Nano-Bio300, Mad City Labs). A potential of 0.25 V was applied between the QRCEs in the barrels of the theta pipette using a home-built instrument controlled via LabVIEW 2011 and a field programmable gate array card (PCI-783R, National Instruments). An oscillation of 80 nm amplitude was applied to the z-position of the tip, with a frequency of 233.5 Hz, using an external lock-in amplifier (SR830DSP, Stanford Research Systems), and the resulting alternating current (AC) magnitude at the driving frequency was measured and used to inform on the meniscus condition. An approach-hold-withdraw method, as illustrated in Fig 2(b), was used to carry out local dissolution at the enamel surface with different solution contact times. First, as shown in Fig 2(b)(i), the z-piezo was used to move the pipette towards the surface and the approach was stopped when the meniscus made contact with the surface (without the pipette itself making contact) as evidenced by a sudden change in the AC value. Typically, a threshold value of one order of magnitude higher than the background AC measured when the tip was in air.61 The meniscus was held in contact with the surface for a precise period of
time (Fig 2(b)(ii)), after which the pipette was rapidly translated away from the surface (20 µm s-1), breaking meniscus contact
(Fig 2(b)(iii)). The pipette was then moved laterally to the next approach location at a velocity of 1 µm s-1 (taking 5 seconds), in
this time the solution in the meniscus retuned to its initial conditions (equilibrium reached in << 1 sec).59 This procedure was
used to prepare an array of local etch features, following the pattern described in Fig 2(c), which also shows the path of the pipette. The array created in this experiment started with a 1 s meniscus hold time on the surface, and this was increased by 1 s for each subsequent position, up to a total of 16 s. Six arrays were created in each treatment section of an enamel surface and a total of four bovine enamel samples were studied, meaning that 24 separate arrays were
4
Fig 2: (a) SEM image of a pipette tip. (b) Representation of the experimental setup used. The approach-hold-withdraw cycle and probe path used in SECCM
[image:5.595.196.406.64.263.2]experiments. (i) Probe approaches enamel surface. (ii) Meniscus makes contact with the surface and is held for a set time. (ii) The probe is withdrawn and meniscus removed from the surface. (c) The path the probe takes during the whole array used. Red line represents tip path. Meniscus contact in each spot is 1 second longer than the previous spot.
Fig 3: Optical images of: a) an experiment in progress; b) close up image of arrays of dissolution pits formed on a surface.
Atomic Force Microscopy
The SECCM etch pits were characterized using a Bruker Nano Enviroscope AFM with a Nanoscope IV controller in tapping mode. Tips used were 0.01-0.025 Ω-cm Sb doped Si cantilevers (Veeco). The resultant images were analysed using SPIP 6.0.10 software.
Theory and Simulations
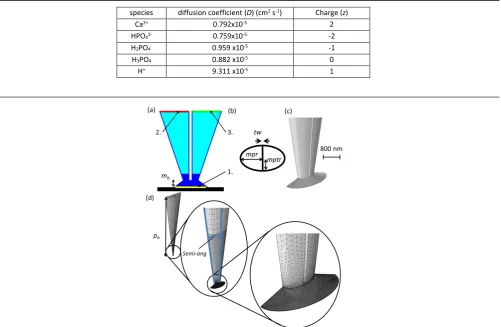
A 3D finite element method (FEM) model was used to extract the acid induced dissolution rate of enamel. The theta pipette presents a symmetry plane perpendicular to the pipette septum such that it was possible to model only half a pipette, for computational efficiency, as illustrated in Figure 4. Values for the parameters used to describe the theta pipette geometry were typical values obtained from SEM images of the pipette: the major pipette radius perpendicular to the septum (mpr = 440 nm); the minor pipette tip radius parallel to the septum (mptr = 260 nm); septum width (tw = 74 nm), pipette semi-angle
[image:5.595.47.556.310.488.2]5
Table 1: Diffusion coefficients of key solution species.62
species diffusion coefficient (D) (cm2 s-1) Charge (z)
Ca2+ 0.792x10⁻⁵ 2
HPO42- 0.759x10⁻⁵ -2
H2PO4- 0.959 x10⁻⁵ -1
H3PO4 0.882 x10⁻⁵ 0
H+ 9.311 x10⁻⁵ 1
Fig 4: The pipette geometry used. (a) 2D representation of the 3D simulations. (b) 2D representation of the end of the pipette. (c) The simulation geometry use d
zoomed into the region of the meniscus. (d) 3D representation of pipette also showing the meshing points used in experiments.
For simplicity the simulation assumed a planar enamel surface due to the relatively shallow pits formed after etching, especially at the short times. However, the meniscus contact width (mw) that is shown in Figure 4(a) was adjusted for each experimental
time simulated, as informed from AFM data of etch pits. The meniscus height (mh = 300 nm), and the fraction of the potential
that falls across the simulation boundaries (𝐸𝑓) were determined by matching the ionic conductance current in the simulation
(with an inert substrate surface) to the experimental barrel current of an approach to an inert silicon oxide wafer substrate.56
The pipette height (ph = 100µm), which is the height of the tip domain that was simulated, was chosen to be sufficiently large so
not to influence the results of the simulation.59 All simulations were carried out using the FEM simulation software Comsol
Multiphysics (v4.3, Comsol AB) with LiveLink for Matlab (R2011a, Mathworks).
The Nernst-Planck equation (eq. 2) coupled with the electroneutrality condition (eq. 3) was solved to determine ionic concentration distributions in the pipette and meniscus domains:
∇. (−𝐷
𝑖∇c
𝑖− 𝑧
𝑖𝑢
𝑖𝐹𝑐
𝑖∇𝑉) = 𝑅
𝑖(2)
∑ 𝑧
𝑖 𝑖𝑐
𝑖= 0.
(3)
where 𝑐𝑖 is concentration, 𝐷𝑖is diffusion coefficient,56 𝑧𝑖 is charge, 𝑢𝑖is ionic mobility (calculated based on the Einstein equation)
of species i, F is the Faraday constant, and 𝑉 is the electric field (between the 2 QRCEs). The values used are given in Table 1. 𝑅𝑖
indicates reactions leading to the formation or loss of species i within the field. Species in the solution were always kept at equilibrium, described by the following equations.
{H3PO4⇌ H
++ H
2PO4− 𝐾𝑎1∗ = [H2PO4
−][H+]
[H3PO4]
H2PO4−⇌ H++ HPO42− 𝐾𝑎2∗ = [HPO4
2−][H+]
[H2PO4−]
6
where 𝐾1𝑎∗ and 𝐾2𝑎∗ are acid dissociation constants for H3PO4 and H2PO4-, respectively, corrected for the ion activity coefficients
using MINEQL+ (Chemical Equilibrium Modelling System v4.6). In this simulation, convection from the electroosmotic flow was
reasonably assumed to be negligible and so was not included because diffusion and migration play a much larger role under the experimental conditions.58 As the experimental contact times (1-16 s) were much longer than the time needed to reach
steady-state in the pipette, it was reasonable to assume steady-steady-state dissolution for the simulation.56
The initial concentrations for Ca2+, HPO42-, H2PO4-, and H3PO4 were assigned to zero in the simulated domain. The bulk
concentrations, (i) were maintained at boundaries 2 and 3 (Figure 4(a)) with the following equation:
𝑐
𝑖= 𝑐
𝑖∗
(5)
is initial concentration of species i. To simulate the bias, 0 𝑉 was applied to surface 3 (one barrel), and 𝐸𝑓 was applied to surface
2 (the other barrel).56
At the interface between the meniscus and the enamel surface, represented in 2D (Figure 4(a)) with surface 1 as enamel (yellow), a flux relation was applied to represent the dissolution process:
{
−𝑛. 𝑁
Ca2+= 𝑘
0. [H
+]. (
10
8
)
−𝑛. 𝑁
H2PO42−= 𝑘
0. [H
+]. (
6
8
)
−𝑛. 𝑁
H+= − 𝑘
0. [H
+]
(6)
where n is the inward unit vector and 𝑁𝑖 is flux vector of species i, The intrinsic rate constant for dissolution is 𝐾0.
The fractions
(
108)
and(
68)
represents the stoichiometry coefficients of the acid dissolution reaction (eq. 1). All other boundaries, pipette walls and meniscus sides, were considered to be electrically insulating and have no flux (normal).Results and Discussion
Etch Pit analysis
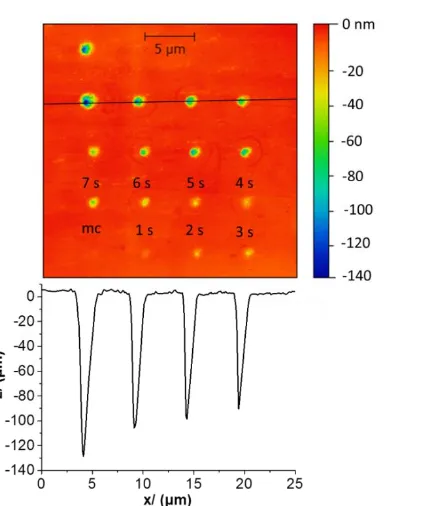
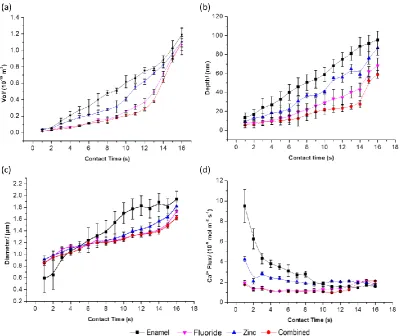
Six arrays (each comprising 16 etch pits) were generated on each of the four enamel samples for each treatment. This resulted in 384 etch pits for each of the four treatment conditions, all of which were analysed using AFM. A representative AFM image of an array is shown in Fig 5. There is a noticeable trend towards deeper and wider dissolution pits with increased time. It can also be seen that SECCM dissolution results in highly localised dissolution at the position of meniscus contact with the enamel surface. The volume of the pits for each hold time was averaged across all the arrays and samples to produce Fig 6(a), which shows pit volume against meniscus contact time for untreated enamel, F- treated enamel, Zn2+ treated enamel and the combined
7
Fig 5: Typical array of etch pits formed using SECCM. Black line marks point of the profile at the bottom of the AFM image. The first point only makes momentary
contact (mc), used for orientation of the sample.
In order to elucidate quantitative dissolution rates, it was necessary to know the pit diameter (Fig 6(c)), which relates to the area of meniscus contact. The change in diameter, and thus the area of contact between the meniscus and the surface, was taken into account and inputted into the simulations used to analyse the data i.e. a time dependent meniscus area was considered to ensure that surface fluxes were determined with high accuracy (vide infra, e.g. Figure 8).
Overall, the treatments appear to show F- treatment providing more protection of the enamel surface to acid attack than Zn2+
[image:8.595.198.412.54.307.2]8
Fig 6: Plots of: (a) average etch pit volume, (b) average pit depth, (c) average pit diameter, (d) average Ca2+ flux as a function of time. Error bars show standard error
of the mean, n=24. Curves through the points are to guide the eye.
The flux of Ca2+ (mol cm-2 s-1) was determined using the time-dependent pit volume and area (calculated using SPIP 6.0.10
software) to calculate the molar amount of enamel removed (density of enamel is 3.16 g cm-3,molar mass is 502 g mol-1).15-19, 63
The average flux for each contact time for the different enamel substrates is shown in Fig 6(d).
Table 2: Calculated intrinsic rate constants for the different enamel substrates. Error is standard error of the mean (n=384).
All values are statistically different (p < 0.01) analysed by ANOVA and Tukey-Kramer analysis.
Simulations
The model described earlier was implemented to calculate Ca2+ fluxes as a function of 𝑘0 which was varied in the simulations
between 1x10⁻³ cm s-1 and 7x10⁻⁵ cm s-1. The ratio of the diameter of contact area (obtained from AFM images of the pits, as
described) to the diameter of the pipette was varied between 0.5 and 3. Fig 7 shows example concentration profiles for the key species involved in the acid attack and dissolution process for a rate constant, k0=0.08 cm s-1, which is at the upper end of those
Sample Intrinsic rate constant (k0) for Ca2+ release (cm s-1)
Enamel 0.099 ±0.008
Zinc treated 0.058 ±0.007
Fluoride treated 0.033 ±0.008
[image:9.595.47.572.497.631.2]9
[image:10.595.173.418.121.312.2]measured experimentally (vide infra). It can be seen that protons are significantly consumed at the enamel surface (interfacial concentration ca. 0.1 mM) but that, even with this rate constant, there is some contribution from surface kinetics, which can be determined. The profiles also show that there is some asymmetry in the transport of ions to and from the surface due to the electric field between the 2 QRCEs in the pipette.56
Fig 7: The concentration profiles of simulated species and electric potential at the end of the tip using an intrinsic rate constant, k0, of 0.08 cm s-1.
Determination of dissolution kinetics
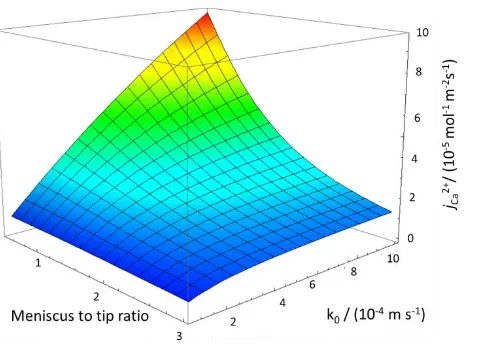
A 3-D working plot showing the interfacial calcium ion flux from the enamel surface as a function of the dissolution (acid attack) rate constant and ratio of meniscus radius to pipette radius ratio is shown in Figure 8. The experimental data yield jCa2+, as
described above, along with the area of meniscus contact, leaving the kinetic term, k0, which can then easily be determined. This
calibration surface was used to derive the rate constant using the experimental results for all four treatment conditions and over all times. The average rate constant for each treatment is shown in Table 2. The result for the untreated enamel substrate is comparable to that of our previous work, (0.1 ±0.05 cm s-1) usinga different local method giving great confidence in the
technique.30 In particular, it proves that there are no deleterious issues, for example, from solution that could have been left
behind from meniscus contact. As described above, it can be seen that F- treatment is more effective than Zn2+, and that the two
combined gives the best barrier to acid attack of enamel. This is important new information for the protection of enamel against acid attack. The variation between the rates constants for different treatments was proven to have statistical significance by using one-way analysis of variance (ANOVA) (p = 2.9x10⁻⁹, 99%).
Conclusions
10
Fig 8: Simulated results showing Ca2+ flux (mol m-2 s-1) vs. intrinsic rate constant of dissolution (m s-1) vs. meniscus to tip ratio.
This method has proven to be particularly powerful for the investigation of dental enamel surfaces, which may show some inter-sample variability. With this approach herein, a single inter-sample can be subjected to multiple treatments in different locations and their relative efficacy assessed, removing inter-sample effects. A particularly powerful aspect of the technique is that dissolution can be monitored for very short times, which is very beneficial as surface treatments often provide only a thin, transient coating, as shown herein. We expect that this approach could have myriad applications in the future for examining surface coatings and treatments. Although not exploited in this study, it should also be pointed out that dissolution can be monitored via the ion-conductance current during meniscus contact59 which further enhances the capabilities of this technique.
For the systems studied, it has been found that both zinc and fluoride act initially to protect enamel from acid-induced dissolution, with fluoride having the greatest effect, whilst a combination of both treatments provided the optimum protection. This study demonstrates that the method outlined can be used to test treatments in a high throughput, automated approach to test single and multiple (combination) treatments of a surface quickly and effectively.
Acknowledgements
We would like to thank both the EPSRC and Unilever for funding this work under the CASE scheme for ASP. Funding for SLK, RAB, MES and PRU was part provided by the European Community’s (EC’s) 7th Frame-Work Programme
(FP7/2007-2013)/ERC-2009-AdG2471143-QUANTIF. KM thanks the EPSRC for a MOAC/DTC studentship. We also acknowledge the support of Advantage West Midlands Science City Advanced Materials Project and the European Regional Development Fund for providing some of the equipment used in this work.
Notes and references
Corresponding Author
* To whom correspondence should be addressed E-mail: [email protected].
Author Contributions
All authors have given approval to the final version of the manuscript.
ABBREVIATIONS
SECCM, scanning electrochemical cell microscopy; AFM, atomic force microscopy; FEM, finite element method; HAP, calcium hydroxyapatite; QRCE, quasi reference counter electrode; TEM, transmission electron microscopy; SEM, scanning electron microscopy; ppm, parts per million; rms, root mean squared; ANOVA, analysis of variance.
1. A. Dokoumetzidis and P. Macheras, Int. J. Pharm., 2006, 321, 1-11.
11
3. R. B. Bjorklund and H. Arwin, Langmuir, 1992, 8, 1709-1714.
4. E.-S. M. Sherif, R. M. Erasmus and J. D. Comins, J. Colloid Interface Sci., 2007, 309, 470-477. 5. D. C. Smith, M. Simon, A. L. Alldredge and F. Azam, Nature, 1992, 359, 139-142.
6. S. Azarmi, W. Roa and R. Lobenberg, Int. J. Pharm., 2007, 328, 12-21.
7. K. D. Demadis, P. Lykoudis, R. G. Raptis and G. Mezei, Cryst. Growth Des., 2006, 6, 1064-1067.
8. J. Desarnaud, O. Grauby, P. Bromblet, J.-M. Vallet and A. Baronnett, Cryst. Growth Des., 2013, 13, 1067-1074. 9. J. Kameda, H. Sugimori and T. Murakami, Phys. Chem. Miner., 2009, 36, 537-544.
10. T. C. Mauldin and M. R. Kessler, J. Mater. Chem., 2010, 20, 4198-4206.
11. M. Peruffo, M. M. Mbogoro, M. A. Edwards and P. R. Unwin, Phys. Chem. Chem. Phys., 2013, 15, 1956-1965. 12. H.-D. Yu, D. Yang, D. Wang and M.-Y. Han, Adv. Mater., 2010, 22, 3181-3184.
13. P. R. Unwin and J. V. Macpherson, Chem. Soc. Rev., 1995, 24, 109-119. 14. P. R. Unwin, J. Chem. Soc., Faraday Trans., 1998, 94, 3183-3195.
15. C. Robinson, R. C. Shore, S. J. Brookes, S. Strafford, S. R. Wood and J. Kirkham, Crit. Rev. Oral Biol. Medicine, 2000, 11, 481-495. 16. A. Boyde, in Teeth, Springer Berlin Heidelberg, 1989, vol. 5 / 6, pp. 309-473.
17. R. P. Shellis, Arch. Oral Biol., 1984, 29, 697-705.
18. M. I. Kay, R. A. Young and A. S. Posner, Nature, 1964, 204, 1050-1052.
19. L. F. Francisconi, H. M. Honorio, D. Rios, A. C. Magalhaes, M. A. A. M. Machado and M. A. R. Buzalaf, Oper. Dent., 2008, 33, 203-208. 20. N. X. West, J. A. Hughes and M. Addy, J. Oral Rehabil., 2000, 27, 875-880.
21. W. I. Higuchi, J. A. Gray, J. J. Hefferren and P. R. Patel, J. Dent. Res., 1965, 44, 330-341. 22. R. W. Phillips and G. Van Huysen, J. Chem. Educ., 1946, 23, 579.
23. J. A. Gray, J. Dent. Res., 1962, 41, 633-645.
24. K.-Y. Kwon, E. Wang, A. Chung, N. Chang and S.-W. Lee, J. Phys. Chem. C, 2009, 113, 3369-3372. 25. K. G. Scheckel and J. A. Ryan, Environ. Sci. Technol., 2002, 36, 2198-2204.
26. S. V. Dorozhkin, Prog. Cryst. Growth Charact. Mater., 2002, 44, 45-61. 27. H. G. Linge and G. H. Nancolla, Calcif. Tissue Res., 1973, 12, 193-208.
28. M.-S. Wu, W. I. Higuchi, J. L. Fox and M. Friedman, J. Dent. Res., 1976, 55, 496-505. 29. D. W. Bishop, J. D. Eick, G. H. Nancolla and W. D. White, J. Dent. Res., 1974, 53, 198-198. 30. W. D. White and G. H. Nancollas, J. Dent. Res., 1980, 59, 1180-1186.
31. M. S. Wu, W. I. Higuchi, J. L. Fox and M. Friedman, J. Dent. Res., 1976, 55, 496-505. 32. W. White and G. H. Nancollas, J. Dent. Res., 1977, 56, 524-530.
33. G. H. Nancollas, K. Sawada and E. Schuttringer, in Biomineralization and Biological Metal Accumulation, eds. P. Westbroek and E. W. de Jong, Springer Netherlands, 1983, pp. 155-169.
34. J. C. Voegel and R. M. Frank, Calcif. Tissue Res., 1977, 24, 19-27.
35. M. E. Barbour, D. M. Parker, G. C. Allen and K. D. Jandt, Eur. J. Oral Sci., 2003, 111, 258-262. 36. M. Finke, K. D. Jandt and D. M. Parker, J. Colloid Interface Sci., 2000, 232, 156-164.
37. A. Pyne, W. Marks, L. M. Picco, P. G. Dunton, A. Ulcinas, M. E. Barbour, S. B. Jones, J. Gimzewski and M. J. Miles, Arch. Histol. Cytol., 2009, 72, 209-215.
38. N. W. Johnson, D. F. G. Poole and J. E. Tyler, Arch. Oral Biol., 1971, 16, 385-394.
39. L. J. Wang, R. K. Tang, T. Bonstein, C. A. Orme, P. J. Bush and G. H. Nancollas, J. Phys. Chem. B, 2005, 109, 999-1005. 40. C.-A. McGeouch, M. A. Edwards, M. M. Mbogoro, C. Parkinson and P. R. Unwin, Anal. Chem., 2010, 82, 9322-9328. 41. L. Qin, W. Zhang, J. Lu, A. G. Stack and L. Wang, Environ. Sci. Technol., 2013, 47, 13365-13374.
42. Q. Y. Ma, T. J. Logan, S. J. Traina and J. A. Ryan, Environ. Sci. Technol., 1994, 28, 408-418. 43. Y. Tanizawa, K. Sawamura and T. Suzuki, J. Chem. Soc., Faraday Trans., 1990, 86, 1071-1075.
44. R. D. Martin, M. A. Beeston, P. R. Unwin and M. E. Laing, J. Chem. Soc., Faraday Trans., 1994, 90, 3109-3115. 45. H. G. McCann, Arch. Oral Biol., 1968, 13, 987-1001.
46. J. M. Ten Cate and J. D. B. Featherstone, Crit. Rev. Oral Biol. Med., 1991, 2, 283-296. 47. M. Peld, K. Tõnsuaadu and V. Bender, Environ. Sci. Technol., 2004, 38, 5626-5631. 48. J. A. Gray, J. Dent. Res., 1965, 44, 493-501.
49. K.-Y. Kwon, E. Wang, M. Nofal and S.-W. Lee, Langmuir, 2011, 27, 5335-5339.
50. X. Wang, A. Klocke, B. Mihailova, L. Tosheva and U. Bismayer, J. Phys. Chem. B, 2008, 112, 8840-8848.
51. S. Loher, W. J. Stark, M. Maciejewski, A. Baiker, S. E. Pratsinis, D. Reichardt, F. Maspero, F. Krumeich and D. Günther, Chem. Mater., 2005, 17, 36-42.
52. Y. Honda, T. Anada, S. Morimoto, Y. Shiwaku and O. Suzuki, Cryst. Growth Des., 2011, 11, 1462-1468. 53. K. O. A. Chin and G. H. Nancollas, Langmuir, 1991, 7, 2175-2179.
54. N. R. Mohammed, M. Mneimne, R. G. Hill, M. Al-Jawad, R. J. M. Lynch and P. Anderson, J. Dent., 2014, 42, 1096-1104. 55. N. Ebejer, M. Schnippering, A. W. Colburn, M. A. Edwards and P. R. Unwin, Anal. Chem., 2010, 82, 9141-9145.
56. M. E. Snowden, A. G. Guell, S. C. S. Lai, K. McKelvey, N. Ebejer, M. A. O'Connell, A. W. Colburn and P. R. Unwin, Anal. Chem., 2012, 84, 2483-2491. 57. K. McKelvey, M. A. O'Connell and P. R. Unwin, Chem. Commun., 2013, 49, 2986-2988.
12
60. A. S. Parker, A. N. Patel, R. Al Botros, M. E. Snowden, K. McKelvey, P. R. Unwin, A. T. Ashcroft, M. Carvell, A. Joiner and M. Peruffo, J. Dent., 2014, Supplement 1, 42, S21-S29.
61. C.-H. Chen, K. E. Meadows, A. Cuharuc, S. C. S. Lai and P. R. Unwin, Phys. Chem. Chem. Phys., 2014, 16, 18545-18552. 62. D. R. Lide, CRC Handbook of Chemistry and Physics, 90th Edition, Taylor & Francis, 2009.