Title: Precipitation drives global variation in natural selection
Authors: Adam M. Siepielski1*, Michael B. Morrissey2, Mathieu Buoro3, a, Stephanie M.
Carlson3, Christina M. Caruso4, Sonya M. Clegg5, Tim Coulson6, Joseph DiBattista7, Kiyoko M. Gotanda6, 8, Clinton D. Francis9, Joe Hereford10, Joel G. Kingsolver11,Kate E. Augustine11, Loeske E.B. Kruuk12, Ryan A. Martin13, Ben C. Sheldon5, Nina Sletvold14, Erik I. Svensson15, Michael J. Wade16, Andrew D.C. MacColl17
Affiliations:
1Department of Biological Sciences, University of Arkansas, Fayetteville, AR, U.S.A. 2School of Biology, University of St. Andrews, St. Andrews, U.K.
3Department of Environmental Science, Policy & Management, University of California
Berkeley, CA, U.S.A.
4Department of Integrative Biology, University of Guelph, Guelph, Ontario, Canada 5Edward Grey Institute, Department of Zoology, University of Oxford, U.K.
6Department of Zoology, University of Oxford, Oxford, U.K.
7Department of Environment and Agriculture, Curtin University, Perth, WA, Australia
8Redpath Museum and Department of Biology, McGill University, Montreal, Quebec, Canada 9Department of Biological Sciences, Cal Poly State University, San Luis Obispo, CA, U.S.A. 10Department of Evolution and Ecology, University of California, Davis, CA, U.S.A.
11Department of Biology, University of North Carolina, Chapel Hill, NC, U.S.A.
13Department of Biology, Case Western Reserve University, Cleveland, OH, U.S.A.
14Department of Ecology and Genetics, Uppsala University, Norbyvägen, Uppsala, Sweden 15Department of Biology, Lund University, Lund, Sweden
16Department of Biology, Indiana University, Bloomington, Indiana, U.S.A. 17School of Life Sciences, University of Nottingham, Nottingham, U.K.
*Correspondence to: [email protected] tel: 479-575-6357
Current or secondary addresses:
aINRA, Univ. Pau & Pays Adour, St Pée sur Nivelle, France.
One sentence summary: Global and local climate conditions predict variation in natural selection across diverse plant and animal populations.
Abstract:
Main text:
Climate affects organisms in ways that ultimately shape patterns of biodiversity (1). Consequently, the rapid changes in Earth’s recent climate impose challenges for many
organisms, often reducing population fitness (2-4). While some species may migrate and undergo range shifts to avoid climate-induced declines and potential extinction (5), an alternative
outcome is adaptive evolution in response to selection imposed by climate (6). However, we lack a general understanding of whether local and global climatic factors such as temperature,
precipitation, and water availability influence selection (2, 7). Understanding these effects is critical for predicting the consequences of increasing droughts, heat waves, and extreme precipitation events that are expected in many regions (8, 9).
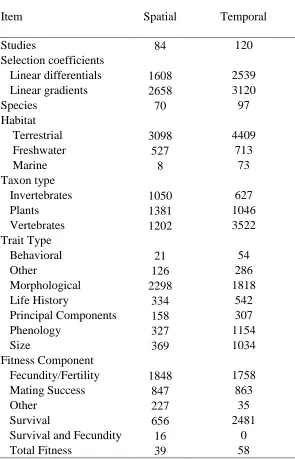
To quantify how climate variation influences selection, we assembled a large database of standardized directional selection gradients and differentials from spatially (mean = 4.6 ± 5.4 [standard deviation, SD] populations, range = 2 - 59 populations) and temporally (mean = 5.2 ± 6.8 [SD] years, range = 2 - 45 years) replicated selection studies (N = 168) in plant and animal populations (Table 1, Database S1). We focused on directional selection (selection that can generate increases or decreases in trait values) because it is well-characterized and is likely to drive rapid evolution (10) in response to variation in climatic factors. However, selection acting on trait combinations and trait variance may also be affected by climate (7). Selection gradients estimate the strength and direction of selection acting directly on a trait, while differentials estimate ‘total selection’ on a trait via both direct and indirect selection because of trait correlations (11). These standardized selection coefficients describe selection in terms of the relationship between relative fitness and quantitative traits measured in standard deviations, thus facilitating cross-study comparisons (11, 12).
Geographically, the database contains many estimates of selection from temperate, mid-latitude regions centered at 40° N (Fig. 1A). The populations in this database span many
has rarely been quantified (Fig. 1B). This exception is concerning because tundra and tropical rainforests are likely to face severe effects of climate change (1, 13). Spatially and temporally replicated studies of selection in aquatic environments are also uncommon (Table 1), so our results pertain mainly to terrestrial systems. Additionally, the majority of studies are from vertebrate and plant populations, use fecundity or survival as a fitness measure, and use morphological traits (Table 1).
These data allowed us to determine whether directional selection covaries with changes in climatic factors among populations or across time within a given population. For each set of selection estimates, we geo-referenced the population and cross-referenced each population and time point with corresponding values of both local and global climatic factors (Database S2). We then used a random effects Bayesian Markov chain Monte Carlo meta-analysis to estimate the proportion of variation in selection within spatially and temporally replicated studies that was associated with climatic factors (14). This analysis is a hierarchical model, which separates the observation process (accounting for statistical noise in inference of individual selection
coefficients because of sampling error) from a process model (modelling variation in the
selection coefficients in relation to climate variables) (14). Under this analytical framework, we used a random regression mixed model component to model the distribution of within-study variation in the dependence of selection on climatic factors (14). As a measure of effect size, we present the mean and 95% credible intervals of the proportion of within-study variation in selection explained by a given climatic factor.
values of climatic factors influenced directional selection, as well as variation (the standard deviation [SD]), and the influence of extremes (minimum and maximum monthly values for a year) in these climatic factors because climate extremes frequently determine fitness and are expected to increase with climate change (15, 16).
When combining spatial and temporal studies, models that included temperature factors did not explain variation in selection (Fig. 2A, B). However, 20-40% of the variation in selection was associated with precipitation mean, maximum, and SD (Fig. 2C, D). Because precipitation factors are correlated (Table S1), our results collectively illustrate the potentially general
importance of local precipitation as a selective force. In addition, minimum PET explained more than 20% of the variation in selection across the dataset (Fig. 2E, F). When we ran the analyses separately for spatial and temporal selection, the results largely mirrored the patterns in the combined analysis (Figs. S1-S2). However, we found that for selection gradients, but less so for differentials, precipitation factors were more strongly associated with temporal rather than spatial variation in selection (Figs. S1-S2). A multivariate model that included means and SDs of both precipitation and temperature together (14) supports the finding that variation in selection is most closely associated with precipitation factors (Table S2). However, given the low levels of
replication typical of individual studies, we cannot unambiguously attribute a direct effect to any one of these four climate factors (Table S2).
We also explored whether within-study variation in selection associated with local climatic factors differed among subsets of major trait types, fitness components, and taxonomic groups (14). This analysis also indicated effects of precipitation and PET, although, there is substantial variation across the different subsets (Tables S3-S5). Among fitness components, no precipitation or PET climatic factors were consistently most associated with selection through mating success; however, selection through fecundity and survival were affected by
traits (Table S4). Precipitation also explained variation in selection on plants, whereas minimum PET consistently explained variation in selection among all major taxonomic groups (Table S5). While these findings are intriguing, it is important to note that the overall analysis revealed somewhat low precision in the estimates of the dependence of selection on climatic factors (Fig. 2, S1 and S2), and these subset analyses resulted in many estimates. With these important caveats in mind, we encourage a cautious interpretation of the above subset findings (14).
In addition to local climate variation, global climate cycles are known to be powerful agents of selection (17), but their capacity to operate as drivers of selection more broadly is unclear. To explore how annual global climate cycles may affect selection, we modeled the relationship between temporal variation in selection and the North Atlantic Oscillation (NAO) and the Oceanic Niño Index (ONI), which provide measures of inter-annual variability in atmospheric circulation for northern hemisphere and equatorial regions, respectively (14).
We found that the NAO explained between 10-30% of the variation in selection, whereas the ONI explained no appreciable variation (Fig. 3). The NAO was also most associated with selection through fecundity as a fitness component (Table S3), selection on morphological traits (Table S3), and on invertebrate and plant populations (Table S5). The overall stronger effect of the NAO (Fig. 3) relative to the ONI index is perhaps not unexpected because the ONI index would presumably be more important at equatorial latitudes (where studies of selection are rare), whereas the NAO index would be more important at northern latitudes (where selection is well documented; Fig. 1A). Indeed, although global in their reach, there are frequently correlations between large-scale climatic indices and local variation in climatic conditions that have subsequent effects on ecological and evolutionary processes (18, 19). Moreover, these global climate cycles are changing in response to climate change (20) and may therefore have cascading effects on selection at a global scale.
add a further nuance to these potential climate effects and suggest that variation in fitness associated with precipitation may also influence selection (Fig. 2, S1-2). Increases in strong precipitation events that are predicted for the near future (21) could therefore result in
considerable shifts in patterns of selection. Similarly, variation in selection was associated with variation in minimum PET—conditions when water deficits are low. While correlative, our findings do not support the idea that short-term moisture stress, as indicated by minimum
precipitation or maximum PET, is a major driver of selection. Conversely, the effects of changes in mean precipitation could result from sustained drought conditions or changes in resource abundance related to water availability (17).
Whether climate-selection coupling will lead to local adaptation and reduce the risk of extinction is difficult to predict (3, 6), because adaptive evolution also depends on genetic variation in the traits under selection (3, 11). Moreover, if selection is strong relative to existing genetic variation, and if the rate of climate change is rapid, selection might result in population extinction faster than adaptation and evolutionary rescue (3, 22). Phenotypic plasticity might also therefore have a key role in promoting population persistence due to climate change (6, 7).
Our analysis benefits from drawing on decades of accumulated inferences about natural selection. However, we acknowledge a potential limitation: annual measures of local climate factors may not always reflect the most relevant scale underpinning selection in a population (19). Although annual variation at even larger geographic scales such as the NAO (Fig. 3) often have considerable predictive power for explaining variation in demographic rates (18, 19), short-term climatic and extreme weather events, including winter storms and heat waves, can also generate strong selection (23). Our finding of no effect of temperature on selection, despite case studies showing an influence of temperature (24), suggests that such selection may be
the observed relationship between precipitation and selection at the annual scale makes sense because moisture availability is determined by precipitation over longer periods. Ultimately, to more fully understand and predict the consequence of climate variation on selection we also need replicated transplant experiments across broad climate gradients in diverse systems (6).
Transplant experiments would be especially beneficial because past selection may have eroded trait variation as populations locally adapted to a given climate regime, and such experiments would force populations to experience potentially stronger selective climate conditions, much like they could under climate change.
We have identified a signature of the effects of climate on selection in a phylogenetically diverse dataset across multiple environments. This provides evidence that local and global climate cycles are likely important drivers of selection in the wild. Thus, rather than selection being driven entirely by the local idiosyncrasies of each system, selection is partly predictable based on shared environmental features. Although ecologists and biogeographers have long recognized the importance of climate for explaining major ecological patterns, our analyses reveal a role for climate in explaining a key evolutionary process. In this era of unprecedented change to Earth’s climate (8, 9), and as future climatic conditions are expected to become increasingly more variable (15), natural populations will likely have to contend with greater climate variation than they have in the recent past. Such shifting climatic conditions, particularly changing precipitation patterns (2, 21), may present a challenge for many organisms (7, 16).
References and Notes:
1. O. E. Sala et al., Global biodiversity scenarios for the year 2100. Science 287, 1770-1774 (2000).
3. G. Bell, S. Collins, Adaptation, extinction and global change. Evolutionary Applications
1, 3-16 (2008).
4. M. C. Urban, Accelerating extinction risk from climate change. Science 348, 571-573 (2015).
5. I.-C. Chen, J. K. Hill, R. Ohlemüller, D. B. Roy, C. D. Thomas, Rapid range shifts of species associated with high levels of climate warming. Science 333, 1024-1026 (2011). 6. A. A. Hoffman, C. M. Sgrò, Climate change and evolutionary adaptation. Nature 470,
479-485 (2011).
7. L. M. Chevin, R. Lande, G. M. Mace, Adaptation, Plasticity, and Extinction in a Changing Environment: Towards a Predictive Theory. PLoS Biology 8, (2010).
8. M. Donat et al., Updated analyses of temperature and precipitation extreme indices since the beginning of the twentieth century: The HadEX2 dataset. Journal of Geophysical Research: Atmospheres 118, 2098-2118 (2013).
9. S. Rahmstorf, D. Coumou, Increase of extreme events in a warming world. Proceedings of the National Academy of Sciences 108, 17905-17909 (2011).
10. A. P. Hendry, M. T. Kinnison, Perspective: The pace of modern life: Measuring rates of contemporary microevolution. Evolution 53, 1637-1653 (1999).
11. R. Lande, S. J. Arnold, The measurement of selection on correlated characters. Evolution
37, 1210-1226 (1983).
12. J. G. Kingsolver et al., The strength of phenotypic selection in natural populations.
American Naturalist 157, 245-261 (2001).
13. M. E. Dillon, G. Wang, R. B. Huey, Global metabolic impacts of recent climate warming.
Nature 467, 704-706 (2010).
14. Materials and methods are available at Science Online.
15. D. R. Easterling et al., Climate extremes: observations, modeling, and impacts. science
16. D. P. Vázquez, E. Gianoli, W. F. Morris, F. Bozinovic, Ecological and evolutionary impacts of changing climatic variability. Biological Reviews, n/a-n/a (2015).
17. P. R. Grant, B. R. Grant, Unpredictable evolution in a 30-year study of Darwin's finches.
Science 296, 707-711 (2002).
18. N. C. Stenseth et al., Review article. Studying climate effects on ecology through the use of climate indices: the North Atlantic Oscillation, El Niño Southern Oscillation and beyond. Proceedings of the Royal Society of London B: Biological Sciences 270, 2087-2096 (2003).
19. T. Hallett et al., Why large-scale climate indices seem to predict ecological processes better than local weather. Nature 430, 71-75 (2004).
20. T. R. Karl, K. E. Trenberth, Modern Global Climate Change. Science 302, 1719-1723 (2003).
21. M. G. Donat, A. L. Lowry, L. V. Alexander, P. A. Ogorman, N. Maher, More extreme precipitation in the worlds dry and wet regions. Nature Clim. Change 6, 508-513 (2016). 22. R. Gomulkiewicz, R. D. Holt, When does evolution by natural selection prevent
extinction? Evolution 49, 201-207 (1995).
23. H. C. Bumpus, The elimination of the unfit as illustrated by the introduced sparrow, Passer domesticus. Biol Lectures, Marine Biol. Lab., Woods Hole., 209-226 (1899). 24. A. Husby, M. E. Visser, L. E. B. Kruuk, Speeding up microevolution: the effects of
increasing temperature on selection and genetic variance in a wild bird population. PLoS Biology 9, e1000585 (2011).
25. A. M. Siepielski et al., The spatial patterns of directional phenotypic selection. Ecology Letters 16, 1382-1392 (2013).
26. A. M. Siepielski, J. D. DiBattista, S. M. Carlson, It's about time: the temporal dynamics of phenotypic selection in the wild. Ecology Letters 12, 1261-1276 (2009).
28. R. A. Garcia, M. Cabeza, C. Rahbek, M. B. Araújo, Multiple dimensions of climate change and their implications for biodiversity. Science 344, 1247579 (2014).
29. P. A. Stephens et al., Consistent response of bird populations to climate change on two continents. Science 352, 84-87 (2016).
30. J. B. Fisher, R. J. Whittaker, Y. Malhi, ET come home: potential evapotranspiration in geographical ecology. Global Ecology and Biogeography 20, 1-18 (2011).
31. E.J. Pebesma, R.S. Bivand, Classes and methods for spatial data in R. R News 5: htpp://cran.r-project.org/doc/Rnews/ (2005).
32. G. Kunstler, BIOMEplot: Plot the Whittaker biomes. R package version 0.1 (2014). 33. R.E. Ricklefs, The economy of nature. W. H. Freeman and Company (2008).
34. M. B. Morrissey, J. Hadfield, Directional selection in temporally replicated studies in remarkably constant. Evolution 66, 435-442 (2011).
35. J. D. Hadfield, MCMC methods for multi-response generalized linear mixed models: the MCMCglmm R package. Journal of Statistical Software 33, 1-22 (2010).
36. A. Gelman, Prior distributions for variance parameters in hierarchical models (comment on article by Browne and Draper). Bayesian analysis 1, 515-534 (2006).
37. J. Hadfield, MCMCglmm course notes. Available at cran. us. r-project.
org/web/packages/MCMCglmm/vignettes/CourseNotes. pdf. Accessed October 13, 2014 (2015).
38. Open Science Collaboration. Estimating the reproducibility of psychological science. Science. 349, aac4716 (2015).
39. T. H. Parker et al., Transparency in ecology and evolution: real problems, real solutions.
Trends in Ecology & Evolution 31, 711-719 (2016).
41. N. P. Lemoine et al., Underappreciated problems of low replication in ecological field studies. Ecology 97, 2554-2561 (2016).
Acknowledgments: We thank the field biologists whose efforts allowed us to perform this analysis, and C. Benkman, A. Hendry, and M. McPeek for comments. This work originated from a NESCent working group (NSF grant EF-0905606). AMS acknowledges NSF (DEB1620046); BCS is a Wolfson Research Merit Award holder; RAM was supported by NSF (DBI-1300426); KMG was supported by NSERC; LEBK was supported by the Australian Research Council. The data reported in this paper are available at Datadryad.org and as Supporting Online Material. Supplementary Materials:
Materials and Methods Figs. S1 and S2
Table S1-S5
Databases S1 and S2 References (25-41)
Figure legends:
Fig. 2. Variation in selection is explained by local climate factors. Shown are mean and 95% credible intervals of the proportion of within-study variation in selection (combining temporal and spatial variation; see fig. S1 and S2 for temporal and spatial variation analyzed separately, respectively) explained by a given climatic factor. Little variation in selection gradients (A) and differentials (B) is accounted for by temperature, whereas considerable variation in gradients (C) and differentials (D) is accounted for by precipitation. Likewise, minimum PET also consistently explains variation in selection for both selection gradients (E) and differentials (F).
Table 1. Summary of records in the selection database. Numbers refer to the number of items in the database. Only those records with SE’s were used in analyses (14).
Replicate type
Item Spatial Temporal
Studies 84 120
Selection coefficients
Linear differentials 1608 2539
Linear gradients 2658 3120
Species 70 97
Habitat
Terrestrial 3098 4409
Freshwater 527 713
Marine 8 73
Taxon type
Invertebrates 1050 627
Plants 1381 1046
Vertebrates 1202 3522
Trait Type
Behavioral 21 54
Other 126 286
Morphological 2298 1818
Life History 334 542
Principal Components 158 307
Phenology 327 1154
Size 369 1034
Fitness Component
Fecundity/Fertility 1848 1758
Mating Success 847 863
Other 227 35
Survival 656 2481
Survival and Fecundity 16 0