Linking Sensory Perceptions and
Physical Properties of Orange Drinks
Josie McCulloch
†, Svetlin Isaev
‡, Khaled Bachour
†Mohannad Jreissat
‡, Christian Wagner
†∗, Charalampos Makatsoris
‡ †School of Computer Science, University of Nottingham, Nottingham, UK‡Sustainable Manufacturing Systems Centre, Cranfield University, Bedford, UK
∗Institute for Computing & Cybersystems, Michigan Technological University, USA
Abstract—This paper investigates if sensory perceptions of orange drinks (e.g., acidity, thickness, wateriness) can be linked to physical measurements (e.g., pH, particle size, density). Using this information, manufactured drinks can be tailored according to consumer’ desires by, for example, the consumer providing a sensory description of their preferred drink. Sensory perceptions of different juices are collected in a survey and used to determine 1) if consumers can distinguish between different drinks using the provided sensory descriptors, and 2) if the perceptions match to physical measurements of the drinks. Results show that most of the given sensory descriptors are useful in describing differences in orange drinks. Additionally, the perceived wateriness and thickness of the drinks can be predicted from measurements. However, the perceived acidity could not be reliably predicted. The results show that personally tailored orange beverages can be manufactured according to some of the consumer’s desires and there is scope for future developments tailored to a wider range of drink attributes.
I. INTRODUCTION
This paper aims to understand if consumer’s perceptions of orange juice based drinks (e.g., acidity, wateriness, etc.) can be linked to the physical measurements of the drink (e.g., pH, density, etc.). With this knowledge, we can tailor drink manufacturing to a consumer’s description. For example a person may ask for “a drink just as sweet and tangy as this one, but thicker.” By learning how the public’s perceptions of an orange drink links to its physical properties, we can know what physical changes are required to the drink to meet the consumer’s desires. The results of this work can be used by food and beverage industries to tailor products to consumers, gaining increased consumer satisfaction. While this paper purposely focuses on orange beverages, the wider research targets the rapidly growing area of personalised manufacturing. The change in consumers’ lifestyle towards more person-alised beverage products has shifted the food and beverage industry to manufacture a greater variety of products to target consumer needs. There is a correlation between the physical properties and sensory attributes of drinks, and so many prod-uct and process parameters in beverage prodprod-uction influence the taste and sensory perceptions. Therefore, control of the physical properties are vital for product acceptance.
Email:
josie.mcculloch; khaled.bachour; [email protected], s.isaev; m.jreissat; [email protected]
We acknowledge with gratitude the role of EPSRC in supporting this work.
We aim to develop a continuous and customised beverage product formulator to control physical properties of drinks. The fundamental difference and novelty of the formulator is its mixing technique (based on oscillatory flow mixing tech-nology) [1], which enables the production of drink products in continuous motion; whereas all traditional beverage manufac-turing techniques are based on batch-wise production. Uniform mixing along the formulator is achieved by a combination of a series of baffles and oscillation mechanism, which enable it to provide uniform mixing and product quality.
To provide consumers with drinks formulated to match their preferences, it is necessary to understand how to map the consumers’ sensory perceptions of drinks to the physical properties. This paper addresses this by collecting sensory perceptions of drinks through a public survey, and then 1) analyses the public’s ability to discern between different drinks, and 2) matches the sensory perceptions to physical measurements.
In our survey, five orange beverages are rated by at least 50 participants each (a total of 261), using a vocabulary of 13 sensory descriptors. In addition, participants were asked to provide an overall preference. Note, it is important to have consumers rather than experts provide a vocabulary of sensory perceptions as it is for the former that industrial manufacturers wish to tailor their goods. Section III discusses the methods of data collection.
This paper analyses consumers perceptions of orange drinks to see if the chosen vocabulary can be reliably used to distinguish between different orange drinks (Section IV). After this, a subset of these perceptions are compared against phys-ical measurements of the drinks to determine if the public’s descriptions match its physical properties (Section V).
II. RELATEDWORK
to evaluate the suitability of the chosen vocabulary and the consumers’ ability to differentiate between different drinks, as well as assessing the ability to link consumer perceptions and physical measurements.
In related work, Harkeret al.[3], [4] explored the relation-ships between sensory perceptions (from an expert panel) and physical measurements of the texture and taste of apple fruits. It was discovered that perceived texture was difficult to predict from measurements, but perceived acidity could be predicted well. Sweetness was difficult to predict due to the interaction between acidity and sugar affecting the perception of sweet flavours. Mehinagic et al. [5] also map sensory quality of apples, such as crunchiness, juiciness and fondant, to the physical properties. Sensory perceptions of apples can then be predicted from physical measurements.
Additionally, Nestrud and Lawless [6] map perceptions of citrus juices provided by culinary professionals and consumers to observe if consumers can identify the similarities and differences between identical and different juices. Rega et al. [7] examined how an increase in pulp content of orange juices increases the perceived flavour and odour of the drinks. Examining soup products, Wood [8] explored the relationship between perceived creaminess and measured viscosity. Results showed that perceived creaminess is sensed best within a ranged viscosity, outside of which changes in creaminess are not perceived.
III. DATACOLLECTION ANDMODELLING
This section details how the sensory perceptions and physi-cal measurements of orange drinks are collected and modelled. Five commercially available brands of orange flavoured bever-ages with various levels of fruit content were selected. These are labelled as
A 100% Orange Juice from concentrate
B 20% Juice
C 12% Juice
D 8% Juice E 2% Juice
Note that the beverages were purposely selected as a range of orange flavoured beverages with varying degrees of actual juice content.
A. Sensory Descriptions
1) Building a Sensory Vocabulary: In order to determine a set of linguistic descriptors to use, three short activities were conducted to engage with consumers to elicit a sensory vocabulary for orange juice drinks:
• Consumers wrote a free text description of their “ideal orange-flavoured beverage”. This task aimed at gener-ating a large corpus of words produced by consumers without any priming.
• Consumers specified descriptors that they want to see in a filter-based search interface for a website selling orange drinks. This task aimed at finding words that are both desirable and undesirable, and that are of particular importance for the consumer.
TABLE I
ORANGE DRINK SENSORY VOCABULARY ESTABLISHED WITH CONSUMER GROUPS.
Taste Flavour Texture
bitter natural acidic fizzy sour tangy fruity smooth sweet artificial watery
fresh thick
• Consumers tasted three different samples of orange-flavoured drinks and described how they differ. This task aimed at finding words that distinguish drinks from each other.
For this paper, a list of words from 16 participants was collated and assigned to sensory and non-sensory categories; only the sensory descriptors are of interest and used in this paper. The sensory descriptors were then reduced to those that were agreed on by at least three participants. This resulted in the 13-word sensory vocabulary shown in Table I. In addition, people were also asked for an overall assessment of how good they perceived each drink.
2) Collecting Sensory Perceptions: Each of the five drinks was sampled by just over 50 different participants. A total of 261 participants (189 Male, 71 Female, mean age 25.1) were instructed to taste the drinks and rate each of the 13 sensory descriptions, as well as providing an overall rating. Each participant was asked to trial only one sample to avoid taste fatigue. Answers were given on a scale of[0,10](where 0 signifiesnot at alland 10 signifiesvery much).
The participants were asked to use intervals to denote their perceptions [9]. By providing an interval answer instead of a single response, people can show their uncertainty in their response. A narrow interval indicates certainty in a person’s answer, and a wide interval indicates uncertainty. A prize draw for three 50 GBP shopping vouchers was offered to incentivise participation.
3) Modelling Sensory Perceptions: To compare and analyse sensory perceptions of the drinks, mean answers and fuzzy models are constructed and compared. In acquiring mean results, only the centres of the intervals are used. This makes the assumption that the centre of each interval provides a meaningful measure of central tendency about the overall interval-valued perception. These average values are used as a starting point to identify correlations with physical measure-ments in this paper.
Fuzzy sets are useful for modelling people’s perceptions as they provide a visual clue of agreement, or lack thereof, about the drink. Using fuzzy sets to model interval-based survey answers has commonly been used to model respondents un-certainty [10], [11], [9]; this paper uses the Interval Agreement Approach (IAA) to construct fuzzy sets from intervals [9].
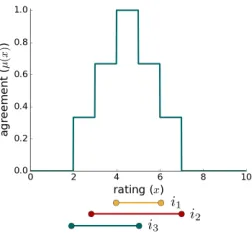
Fig. 1. A fuzzy set constructed from three intervals (i1,i2andi3) using the
[image:3.612.95.248.230.347.2]Interval Agreement Approach.
Fig. 2. Perceived wateriness of drinkArepresented as a fuzzy set.
wateriness of drink A. Fig. 1 shows an example of an IAA fuzzy set constructed from three intervals (i1,i2 andi3).
Fig. 2 shows the fuzzy set modelling how watery people perceived drinkAusing the data collected for this paper. Note that spikes in the models often occur because, for example, where one participant gives the answer[2,3]and another gives [3,4]there will be a spike of agreement at the value 3. While the scales are continuous, participants are often tempted to provide ratings at integer numbers.
By visually observing the data of how watery drink A is perceived, most people agree on ratings in the range [1,6] with highest agreement at 3. Whilst some instead gave higher ratings (e.g., in (6,10]), there is less agreement in these responses.
These fuzzy set models can be used to measure the similar-ity between drinks by calculating how much they overlap (e.g., through the Jaccard ratio [12]), or by visually observing their overlap (e.g., as in Fig. 3 in which the distinct, disjoint peaks indicate a difference between the drinks). These comparisons are examined in Section IV.
B. Physical Measurements
This section details how each drink’s physical measurements of viscosity, pH, density and particle size were measured. Table IV shows the average measurements of the juices based on three tests per drink.
1) Viscosity Measurements: Viscosity measurements were obtained using an AR2000 Rheometer (TA Instruments). A 40mm cone-plate system with cone angle of 2 degrees was
used to determine orange juice viscosity. All measurements were performed at room temperature (20.4◦C) under 10 s−1 shear rate. Using a pipette, each sample was placed on the Peltier plate. Viscosity values (Pa*s) were obtained after two minutes equilibration time. The sample plate was cleaned after each measurement and all samples were measured three times.
2) pH Measurements: pH values of the orange drinks were measured using a microprocessor based bench meter Hanna pH 210 (Hanna Instruments). The glass pH electrode was cleaned after each measurement and all samples were measured three times.
3) Density Measurement: The density of each drink was measured using an accurate dispensing pipette and analytical balance. First 3 mL of each orange juice sample was placed into separate sample bottles, then the weight of each sample was measured using the Mettler Toledo AB304-S/FFACT analytical balance (Mettler Toledo Instruments). Finally, the density of each sample was calculated by dividing its mass in grams by its volume in cubic centimetres. All samples were measured three times.
4) Particle Size Measurements: The particle size distribu-tion and mean particle diameters of the orange drinks were measured by using laser diffraction with a Mastersizer 3000 (Malvern Instruments). To avoid multiple scattering effects, samples were diluted before reading the particle size measure-ments using deionized water. Each individual measurement was an average of 10 runs. All samples were measured three times at room temperature (20.4◦C).
IV. COMPARINGSENSORYPERCEPTIONS BETWEEN
ORANGEDRINKS
This section examines if consumers can perceive differences in the orange drinks using the chosen vocabulary by comparing the collected sensory perceptions. The data is modelled using fuzzy sets (as described in Section III-A3), and comparisons between the drinks are made by measuring the similarity between the fuzzy sets and by visually observing the models. Measuring the similarity between fuzzy sets is a common method of grouping similar subsets of data and distinguishing dissimilarities. The Jaccard similarity is one of the most com-mon methods of comparing fuzzy sets. The Jaccard measure is given as the ratio [12]
s(A, B) =A∩B
A∪B =
Pn
i=1min(µA(xi), µB(xi))
Pn
i=1max(µA(xi), µB(xi))
,
whereA andB are fuzzy sets, and n is the total number of
x values compared. This provides a result in [0,1], where 0 indicates disjoint sets and 1 indicates identical sets.
TABLE II
SUMMARY OF THE SIMILARITIES BETWEEN THE DRINKS AMONG ALL ATTRIBUTES.
min mean median max
0.2826 0.6404 0.6652 0.8421
TABLE III
ATTRIBUTES WITH SIGNIFICANT DISSIMILARITY BETWEEN PAIRS OF JUICES WITH THRESHOLD OF0.6.
Attribute Juice Pairs
acidic AB,AC,AD,AE
artificial AC,AD,AE,BD,BE,CD,CE
fizzy AC,BC,CD
fresh AD
fruity AB,AD,AE
natural AC,AD,AE,BD
sour AB,AD,AE,BC
sweet AB,AC,AD,CE
tangy AD
thick AB,AC,AD,AE
watery AB,AC,AD,AE,CE
good AD,AE,BE
pairs of drinks for which the similarity is less than 0.6 for the given attribute.
A appears the most dissimilar juice to others; in fact, all values of similarity less than 0.5 are a pair containing drink
A. This is expected asA is the only drink containing100% orange juice, whilst all others contain orange juice that has been watered down. Juice C was perceived as more fizzy than others, and this is reflected in the resulting similarities. Additionally, drinksC,DandEall received lower ratings for
naturaltaste, whilstA andB received similar higher ratings. As well as comparing fuzzy sets through the measured val-ues of similarity, they are also compared visually by observing how much they overlap. This helps us to see how given pairs of fuzzy sets resulted in notably high or low values of similarity. For example, Fig. 3 shows the fuzzy sets representing the perceived wateriness of drinks A andE. This pair has a low value of similarity at 0.29.
Examining the fuzzy sets visually shows that this low value of similarity stems from drink A receiving low ratings (at high agreement) at around [2,4], whilst drink E received high ratings at around [7,9]. Although there is some overlap between the sets - giving them a non-zero value of similarity - the degree of overlap could not be described as noteworthy. Therefore, drinkE is perceived as more watery than drinkA. The results of comparing the similarities between the per-ceptions of different orange drinks shows that consumers can perceive differences using the acquired vocabulary. The most stark difference is between drinkAand the remaining drinks. This is expected as A contains 100% orange juice and the others contain watered down orange juice. The dissimilarities between the watered down juices are less apparent but present. Additionally, of the 13 words in the publicly chosen vocabu-lary, 2 were not useful in discriminating between the drinks; these arebitterandsmooth. This suggests that these two words may be a good description of all orange drinks but not useful
Fig. 3. Perceived wateriness of drinksA(green solid line) andE(red dashed line) represented as fuzzy sets.
TABLE IV
MEASUREMENTS OF PH,DENSITY(g/cm3),VISCOSITY(PA*S)AND
PARTICLE SIZE(µm)OF ORANGE DRINKS.
Drink pH Density Viscosity Particle Size
A 3.83 1.0541 0.01060 131.33
B 3.85 1.0489 0.00168 143.33
C 3 1.045 0.00157 107.0
D 3.36 1.011 0.00155 131.33
E 3.14 0.9834 0.00102 160.0
in distinguishing between different orange drinks.
In the next section, correlations between sensory perceptions and physical measurements of drinks are explored to determine if the physical properties can be understood from a person’s sensory description of their ideal orange drink.
V. COMPARINGSENSORYPERCEPTIONS TOPHYSICAL
MEASUREMENTS
This section compares consumers’s perceptions of the or-ange drinks to physical measurements; note that not all of the sensory perceptions collected are compared. These mea-surements include the pH, density (g/cm3), viscosity (Pa*s) and mean particle size (µm). Table IV shows the average measurements of the juices based on three tests per drink. It is expected that the perceived acidity of a drink will match its pH, the perceived wateriness will match the density, the thickness will match viscosity, and the smoothness or wateriness will match the mean particle size.
Table V shows the correlations between each pair of percep-tions and measurements; pairs expected to receive high cor-relations are highlighted in bold. Corcor-relations were calculated using the Pearson and Spearman correlation coefficients on the average centres of the interval responses and the average physical measurements over multiple readings. The remainder of this section evaluates each physical measurement.
A. Acidity
TABLE V
CORRELATIONS BETWEEN PHYSICAL MEASUREMENTS AND SENSORY PERCEPTIONS OF ORANGE DRINKS. RESULTS HIGHLIGHTED IN BOLD
INDICATE EXPECTED HIGH CORRELATIONS.
Measurement Perception Spearman Pearson
pH acidic 0.2 0.454
watery -0.2 -0.463 smooth -0.6 -0.095 thick -0.3 0.48 density acidic 0.6 0.509
watery -0.9 -0.8
smooth -0.3 0.116 thick 0.4 0.486 viscosity acidic 0.6 0.971 watery -0.9 -0.889 smooth -0.3 0.236
thick 0.4 0.992
particle size acidic -0.667 -0.303
watery 0.667 0.539 smooth 0.205 0.132
[image:5.612.83.266.103.384.2]thick -0.718 -0.192
Fig. 4. Scatter plot of measured pH and perceived acidity of the orange drinks.
decreases its perceived acidity [13], [14]. The results in Table V show that the measured pH of a drink cannot be relied upon to predict its perceived acidity.
Note that as drinks use different types of sugar and sweet-eners with unknown quantities, it is not possible to accu-rately control sweetness in commercial drinks. Note, also, that although density and viscosity show some correlation with perceived acidity, as these measurements are unrelated it is assumed that the correlations are coincidental.
B. Density
Fig. 5 shows a plot of each drink’s density compared with its perceived wateriness and Table V shows their correlation. As the density of the drink increases, its perceived wateriness decreases. The density of the drinks also relates to the percent-age of pure orange juice they contain; those containing more orange juice (i.e., are less watered down) are more dense.
C. Viscosity
Next, viscosity is considered. It is expected that viscosity will align with perceived thickness. Fig. 6 shows a plot of viscosity compared with the texture perception thick. The four watered down juices have similar viscosity, and drinkA(with 100% orange juice) is approximately 10 times as viscose.
[image:5.612.83.268.104.387.2]These results suggest that consumers’ can differentiate between drinks with high and low viscosity. However, a
Fig. 5. Scatter plot of measured density (g/cm3) and perceived wateriness
of the orange drinks.
Fig. 6. Scatter plot of measured viscosity (Pa*s) and perceived thickness of the orange drinks.
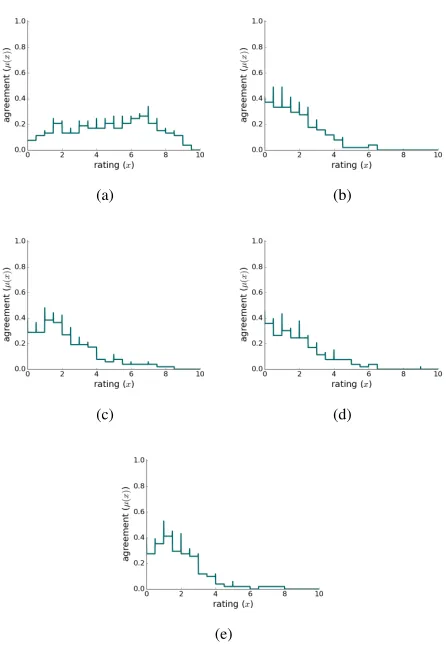
closer look at the survey results provide less dichotomous perceptions. In the survey results, there is high agreement that drinksB,C,DandEhave low thickness. However, the results for drinkAare varied, with no strong agreement. Fig. 7 shows the agreement in ratings for perceived thickness. These results suggest that consumers can perceive low viscosity well, but struggle to identify high viscosity.
D. Particle Size
Turning to particle size, it is expected that the perceived wateriness or smoothness of the drinks should match the particle size. Fig. 8 shows plots of mean particle size com-pared with the texture perceptions watery and smooth, and Table V shows their correlations. No correlation is found with smoothness. Instead, the perceived smoothness of each drink is approximately the same, at around 7. However, some correlation is found between perceived wateriness and particle size, indicating that these two attributes may be linked.
This section has examined the link between consumers’ perceptions and physical measurements of orange drinks. The next section discusses results and conclusions.
VI. DISCUSSION ANDCONCLUSIONS
[image:5.612.366.503.213.316.2](a) (b)
(c) (d)
[image:6.612.61.284.56.379.2](e)
Fig. 7. Fuzzy sets representing the perceived thickness of the orange drinks (a)A, (b)B, etc.
(a) (b)
Fig. 8. Scatter plots showing physical measurements of particle size (µm) and the perceptions (a) watery, (b) smooth.
differences are also noticeable in how sweet, sour, fizzy and watery the drinks with low juice contents are perceived.
Correlations between the perceptions and physical measure-ments of the drinks are calculated. These results show that the perceived wateriness and density correlate as expected, and wateriness can also be linked to mean particle size. Addition-ally, perceived thickness was linked to measured viscosity.
However, the perceived acidity does not correlate with the pH measurements of the drinks. This is likely due to sugars and artificial sweeteners affecting a consumer’s perception of acidity. Therefore, when determining if the acidity of a formulated drink matches a person’s desires, a combination of pH and sugar content measurements is likely to be required. A study using drinks with controlled ingredients produced by
the developed beverage formulator would be most effective for best understanding how perceived sweetness and acidity can be predicted from formulated drinks.
It was expected that total juice content would affect per-ceptions in taste and texture. Therefore, drinks with different amounts were selected for the study. The results show that total juice content does affect the perceived texture, but added sugars and sweeteners also have a prominent effect on taste. In future work, we will also control for sugar and sweetener content to better understand taste perceptions.
Overall, these initial results show that the chosen vocabulary enables consumers to describe their ideal orange drink and we can use a subset of these descriptors to tailor consumers’ drinks to their desires using the oscillatory flow formulator; further analysis of consumers perceptions of orange drinks will be followed up in a journal paper. This work shows promise towards personalised manufacturing of food and beverages, tailoring products to consumers to gain increased customer satisfaction.
REFERENCES
[1] N. E. Pereira and X. Ni, “Droplet size distribution in a continuous oscillatory baffled reactor,”Chemical engineering science, vol. 56, no. 3, pp. 735–739, 2001.
[2] S. Isaev, C. Makatsoris, M. Jressiat, and C. Wagner, “Linking human and machine-towards consumer-driven automated manufacturing,” inFuzzy Systems (FUZZ-IEEE), 2016 IEEE International Conference on. IEEE, 2016, pp. 1789–1796.
[3] F. Harker, J. Maindonald, S. Murray, F. Gunson, I. Hallett, and S. Walker, “Sensory interpretation of instrumental measurements 1: texture of apple fruit,”Postharvest biology and technology, vol. 24, no. 3, pp. 225–239, 2002.
[4] F. Harker, K. Marsh, H. Young, S. Murray, F. Gunson, and S. Walker, “Sensory interpretation of instrumental measurements 2: sweet and acid taste of apple fruit,”Postharvest Biology and Technology, vol. 24, no. 3, pp. 241–250, 2002.
[5] E. Mehinagic, G. Royer, R. Symoneaux, D. Bertrand, and F. Jourjon, “Prediction of the sensory quality of apples by physical measurements,” Postharvest biology and technology, vol. 34, no. 3, pp. 257–269, 2004. [6] M. A. Nestrud and H. T. Lawless, “Perceptual mapping of citrus juices using projective mapping and profiling data from culinary professionals and consumers,”Food quality and preference, vol. 19, no. 4, pp. 431– 438, 2008.
[7] B. Rega, N. Fournier, S. Nicklaus, and E. Guichard, “Role of pulp in flavor release and sensory perception in orange juice,” Journal of agricultural and food chemistry, vol. 52, no. 13, pp. 4204–4212, 2004. [8] F. W. Wood, “An approach to understanding creaminess,”Starch-St¨arke,
vol. 26, no. 4, pp. 127–130, 1974.
[9] C. Wagner, S. Miller, J. Garibaldi, D. Anderson, and T. Havens, “From Interval-Valued Data to General Type-2 Fuzzy Sets,” Fuzzy Systems, IEEE Transactions on, vol. 23, no. 2, pp. 248–269, Apr. 2015. [10] T. Hesketh, R. Pryor, and B. Hesketh, “An application of a
comput-erized fuzzy graphic rating scale to the psychological measurement of individual differences,”International Journal of Man-Machine Studies, vol. 29, no. 1, pp. 21–35, 1988.
[11] D. Wu, J. M. Mendel, and S. Coupland, “Enhanced interval approach for encoding words into interval type-2 fuzzy sets and its convergence analysis,”Fuzzy Systems, IEEE Transactions on, vol. 20, no. 3, pp. 499– 513, 2012.
[12] P. Jaccard, “The distribution of the flora in the alpine zone. 1,”New phytologist, vol. 11, no. 2, pp. 37–50, 1912.
[13] R. L. McBride and R. L. Johnson, “Perception of sugar-acid mixtures in lemon juice drink,”International Journal of Food Science & Technology, vol. 22, no. 4, pp. 399–408, 1987.
[image:6.612.53.289.421.523.2]